• Company
    • About Us
    • Case Studies
    • Press Center
    • Careers
    • Blog
    • Contact us
  • Contact us
  • Login
 
  • English
    • Deutsch
    • Español
    • Français
    • Italiano
    • Português
Paessler
                    - The Monitoring Experts
  • Products
    • Paessler PRTG
      Paessler PRTGMonitor your whole IT infrastructure
      • PRTG Network Monitor
      • PRTG Enterprise Monitor
      • PRTG Hosted Monitor
      • PRTG UVexplorer
      • PRTG extensionsExtensions for Paessler PRTGExtend your monitoring to a new level
    • Icon Features
      FeaturesExplore all monitoring features
      • Maps & dashboards
      • Alerts & notifications
      • Multiple user interfaces
      • Distributed monitoring
      • Customizable reporting
  • Solutions
    • Industries
      IndustriesMonitor various industry sectors
      • Industrial
      • Healthcare
      • Data Center
      • Education
      • Finance
      • Government
    • IT Topics
      IT TopicsMonitor all areas of IT
      • Network Monitoring
      • Bandwidth Monitoring
      • SNMP Monitor
      • Network Mapping
      • WiFi Monitoring
      • Server Monitoring
  • Pricing
  • Resources
    • Getting Started
      Getting StartedModules for self-paced learning
    • How-to Guides
      How-to GuidesGet the most out of PRTG
    • Videos & Webinars
      Videos & WebinarsLearn from Paessler experts
    • IT  Knowledge
      IT KnowledgeExpand your IT knowledge
    • PRTG Manual
      PRTG ManualFull documentation
    • Knowledge Base
      Knowledge BaseShare community knowledge
    • PRTG Sensor Hub
      PRTG Sensor HubGet sensors, scripts & templates
    • Trainings
      PRTG TrainingLearn how to work with PRTG
  • Partners
    • Icon Handshake
      Become a PartnerFor resellers and channel partners
    • Icon MSP
      Become an MSPDeliver monitoring as a managed service
    • icon partner
      Partner PortalLog in to your partner account
    • Deal Registration
      Deal RegistrationRegister your sales opportunities
    • icon search
      Find a PartnerFind partners selling Paessler products
    • icon technology
      Technology AlliancesSee Paessler technology partnerships
    • Partner HubTools for Your Success
  • Company
    • About Us
    • Case Studies
    • Press Center
    • Careers
    • Blog
    • Contact us
  • Contact us
  • Login
  • English
    • Deutsch
    • Español
    • Français
    • Italiano
    • Português
  • Get a quote
  • Free trial

Reliable SaaS Monitoring 

Catch disruptions and performance issues before your users notice 

Free download
PRODUCT OVERVIEW

How do you monitor SaaS application availability and performance from your own network?  

SaaS applications handle most business-critical workflows today, but availability and performance are still your responsibility to track. Vendor status pages are often delayed, show less than what's actually happening, and say nothing about whether your specific users can reach the service. Response times, authentication health, and workload-level issues rarely surface on their own.  

PRTG monitors availability and performance of SaaS applications through HTTP/HTTPS endpoints, REST APIs, and native integrations including Microsoft 365 via the Graph API. Response times, uptime, authentication health, and service status land in one real-time dashboard alongside your on-premises infrastructure. Native sensors cover Microsoft 365 and AWS services directly. For everything else, HTTP and REST API sensors extend coverage to Salesforce, Google Workspace, Slack, Zendesk, ServiceNow, and other cloud applications your organization depends on.

Download PRTG Trial

What you will find on this page

  • Keep Your Stack Running Smoothly
  • How PRTG Monitors SaaS
  • SaaS Monitoring: Manual vs. PRTG
  • FAQs

PRTG is compatible with all major vendors, products, and systems

compatible with all major vendors, products, and systems

SaaS Monitoring That Keeps Your Stack Running Smoothly

Know About SaaS Disruptions Before Your Users Do

Your helpdesk learns SharePoint is down because tickets flood in. Not because monitoring caught it first. By the time you're starting to look for the culprit, users have already lost 20 minutes. With PRTG you monitor your Microsoft 365 service health, mailbox status, and endpoint availability in real-time. You know about downtime the moment it happens, not when complaints pile up.

  • Instant alerts when Microsoft 365 services degrade or go offline
  • Monitor mailbox health via Microsoft Graph API to catch Exchange issues as soon as possible
  • Track the service status for SharePoint, Teams, OneDrive, and other workloads
  • Get notifications via email, SMS, push, or integrated into your ticketing system
  • Reduce mean time to resolution by catching problems before they escalate
PRTG Ping sensor graphs showing response time, min, max, and packet loss over time

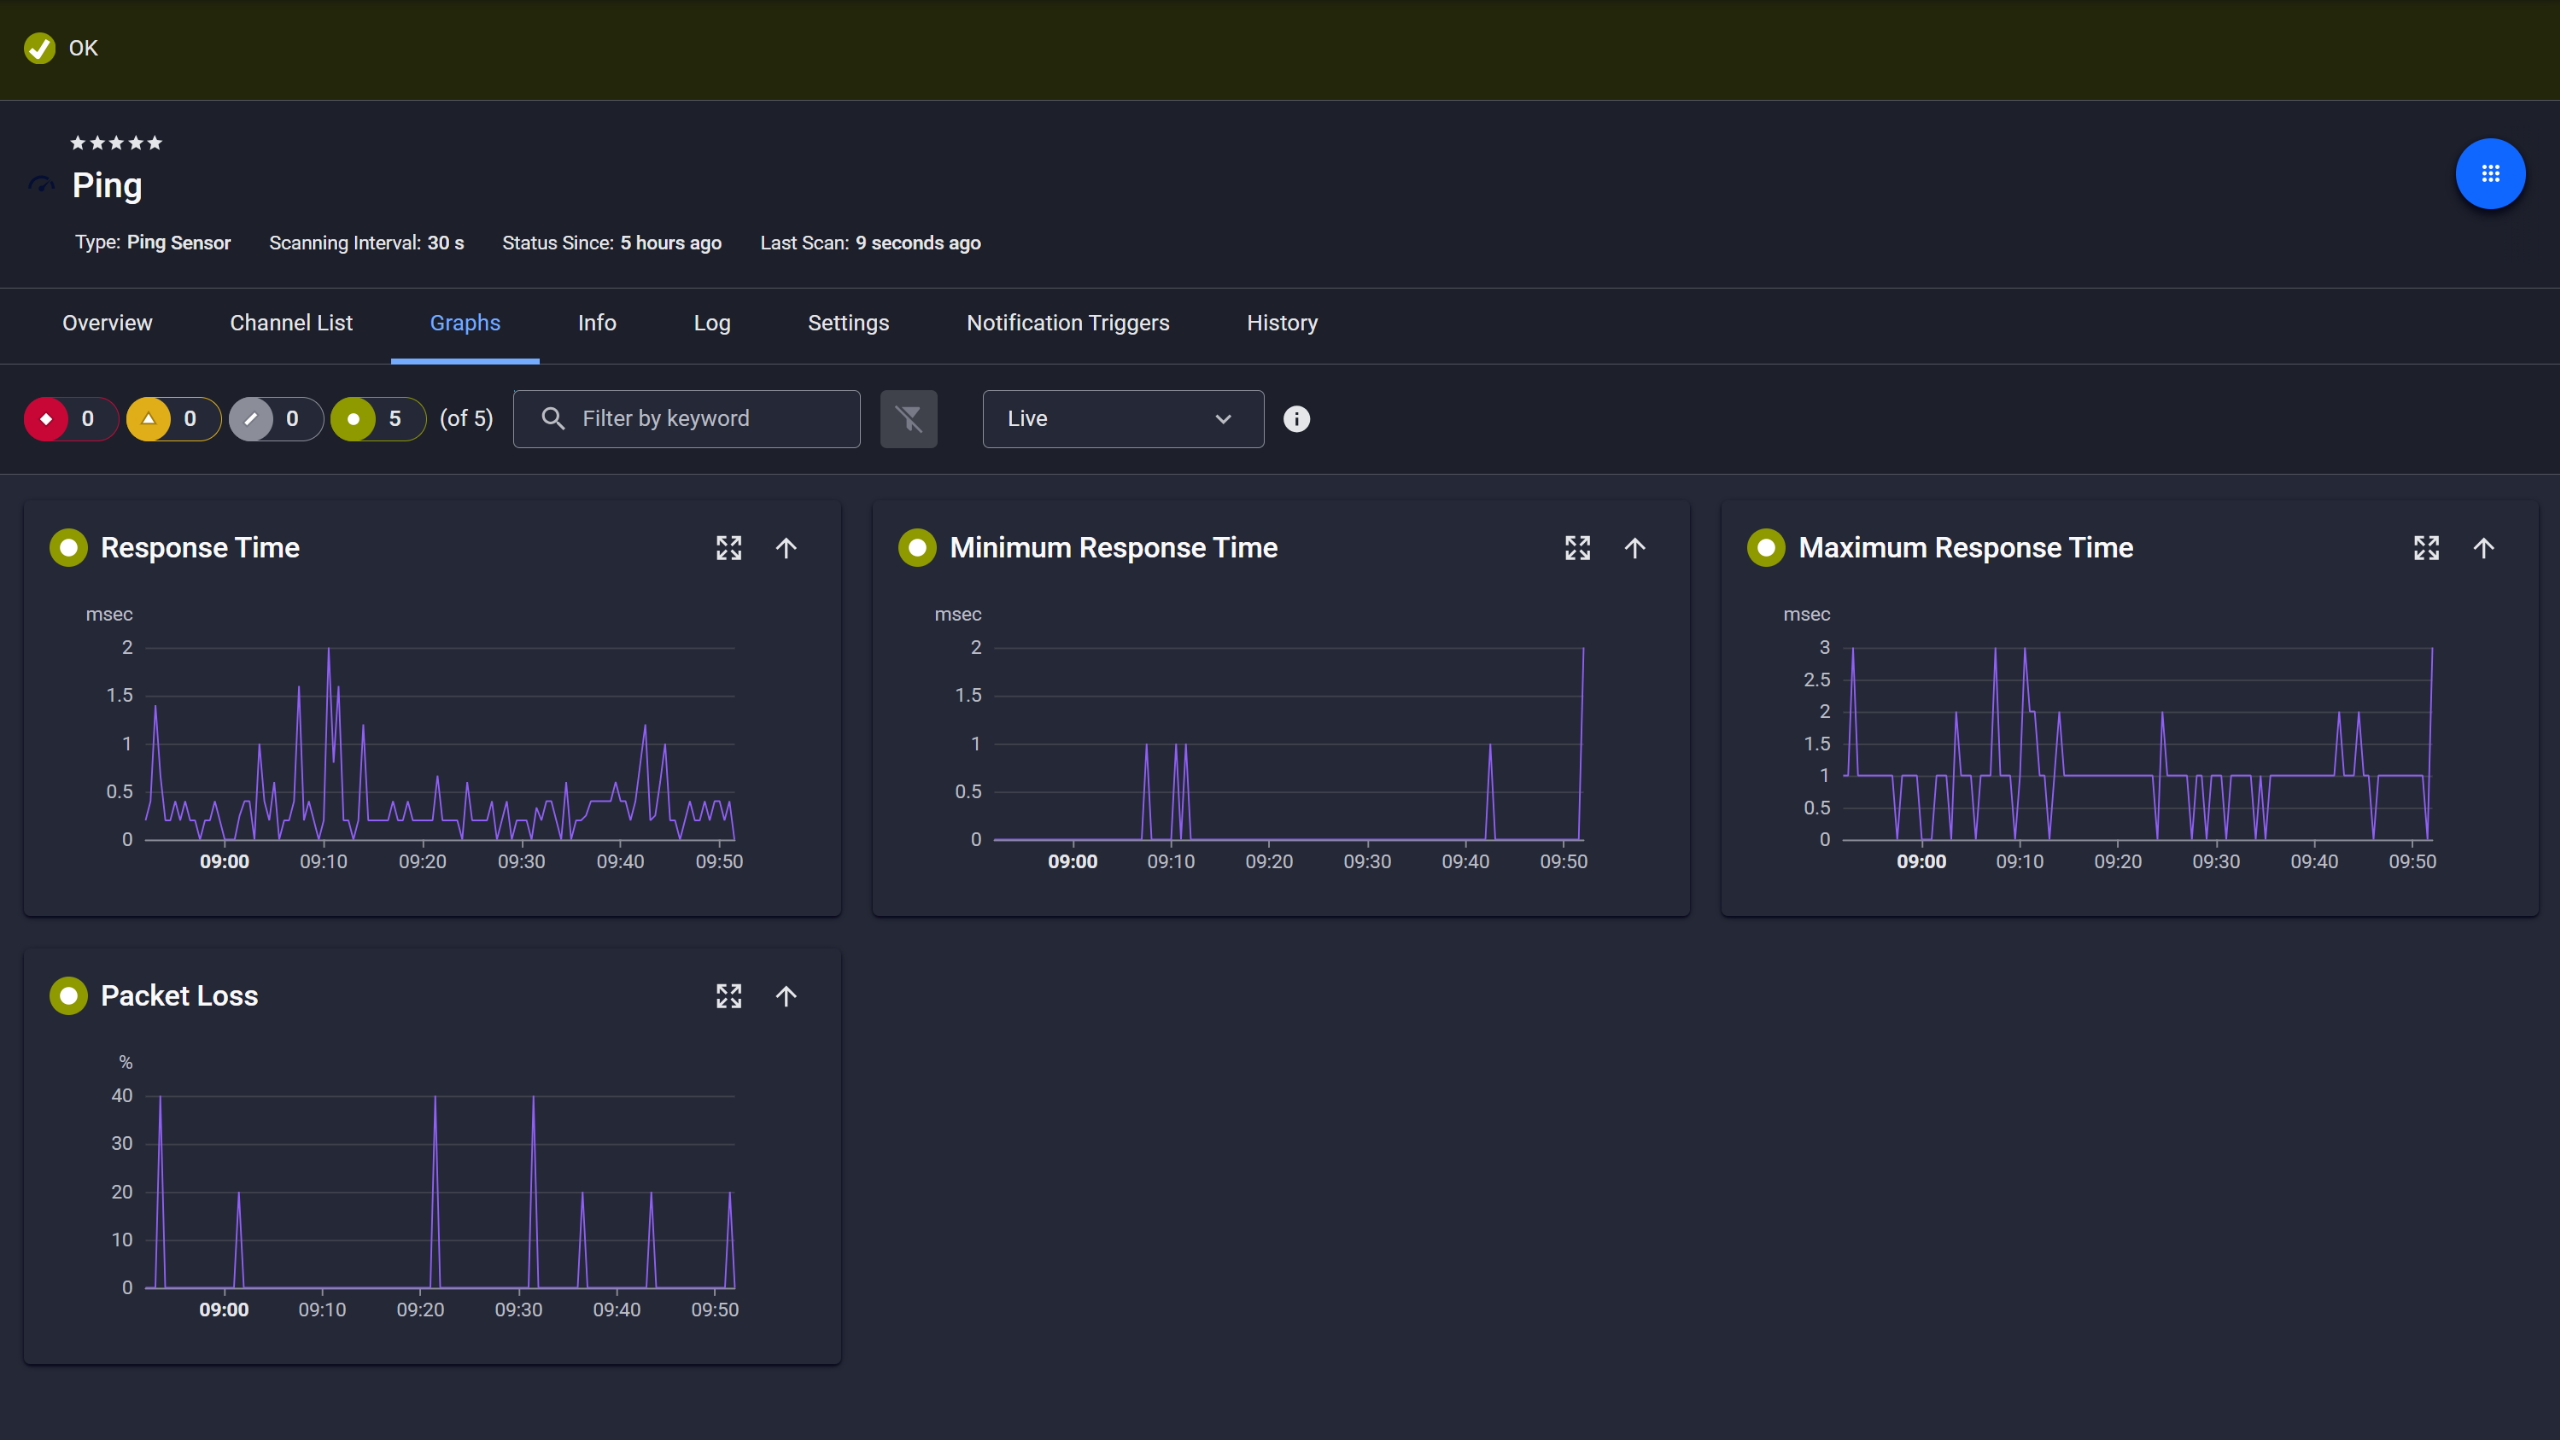
Ping response and packet loss

PRTG web interface showing live performance graphs for a Probe Health sensor

Live graphs, real-time performance data

PRTG reports list showing scheduled monitoring reports with run times and sensor counts

Scheduled reports, always on time

Keep API Performance Within Acceptable Limits

A Salesforce API starts responding 3 seconds slower than normal but doesn't fail completely. Users complain about "the system being slow" and you have no performance data to work with. PRTG tracks API response times, latency, and endpoint health with configurable thresholds. Those metrics show early signs of service-side performance issues when application performance degrades even if services stay technically up.

  • Monitor REST API response times and alert when latency exceeds your thresholds
  • Track authentication endpoints to catch login delays or certificate expiration
  • Test from multiple predefined geographic locations using Cloud HTTP v2 sensors to measure global performance
  • Set custom thresholds for what "slow" actually means in your environment
  • Get actionable insights to escalate with your SaaS providers or troubleshoot internal dependencies

See Why IT Professionals Trust PRTG

Start monitoring your infrastructure in minutes. No professional services, no complex configuration, no risk.

Free download
PRODUCT OVERVIEW

Full Visibility Into Your SaaS Delivery Chain

Your cloud-based applications depend on network paths, DNS, authentication services, and sometimes on-prem integrations that are available 24/7. When your users can't reach your cloud-based application, the question is always the same: is it the SaaS provider, your firewall, your internet connection, or an expired certificate? PRTG's infrastructure monitoring covers the critical parts of your SaaS delivery chain: cloud endpoints, network connectivity, DNS resolution, login and token endpoints, and on-premises dependencies. You isolate the root cause fast instead of guessing. 

  • Monitor end-to-end availability from your network to the SaaS endpoint
  • Track dependencies like DNS, authentication servers, VPN gateways, and proxy services
  • Correlate SaaS issues with infrastructure metrics in one unified dashboard
  • See the whole picture when troubleshooting, not just what the vendor's status page says
  • Prove SLA compliance or document provider-side outages with historical uptime data
PRTG tickets list showing system notifications, report completions, and update alerts

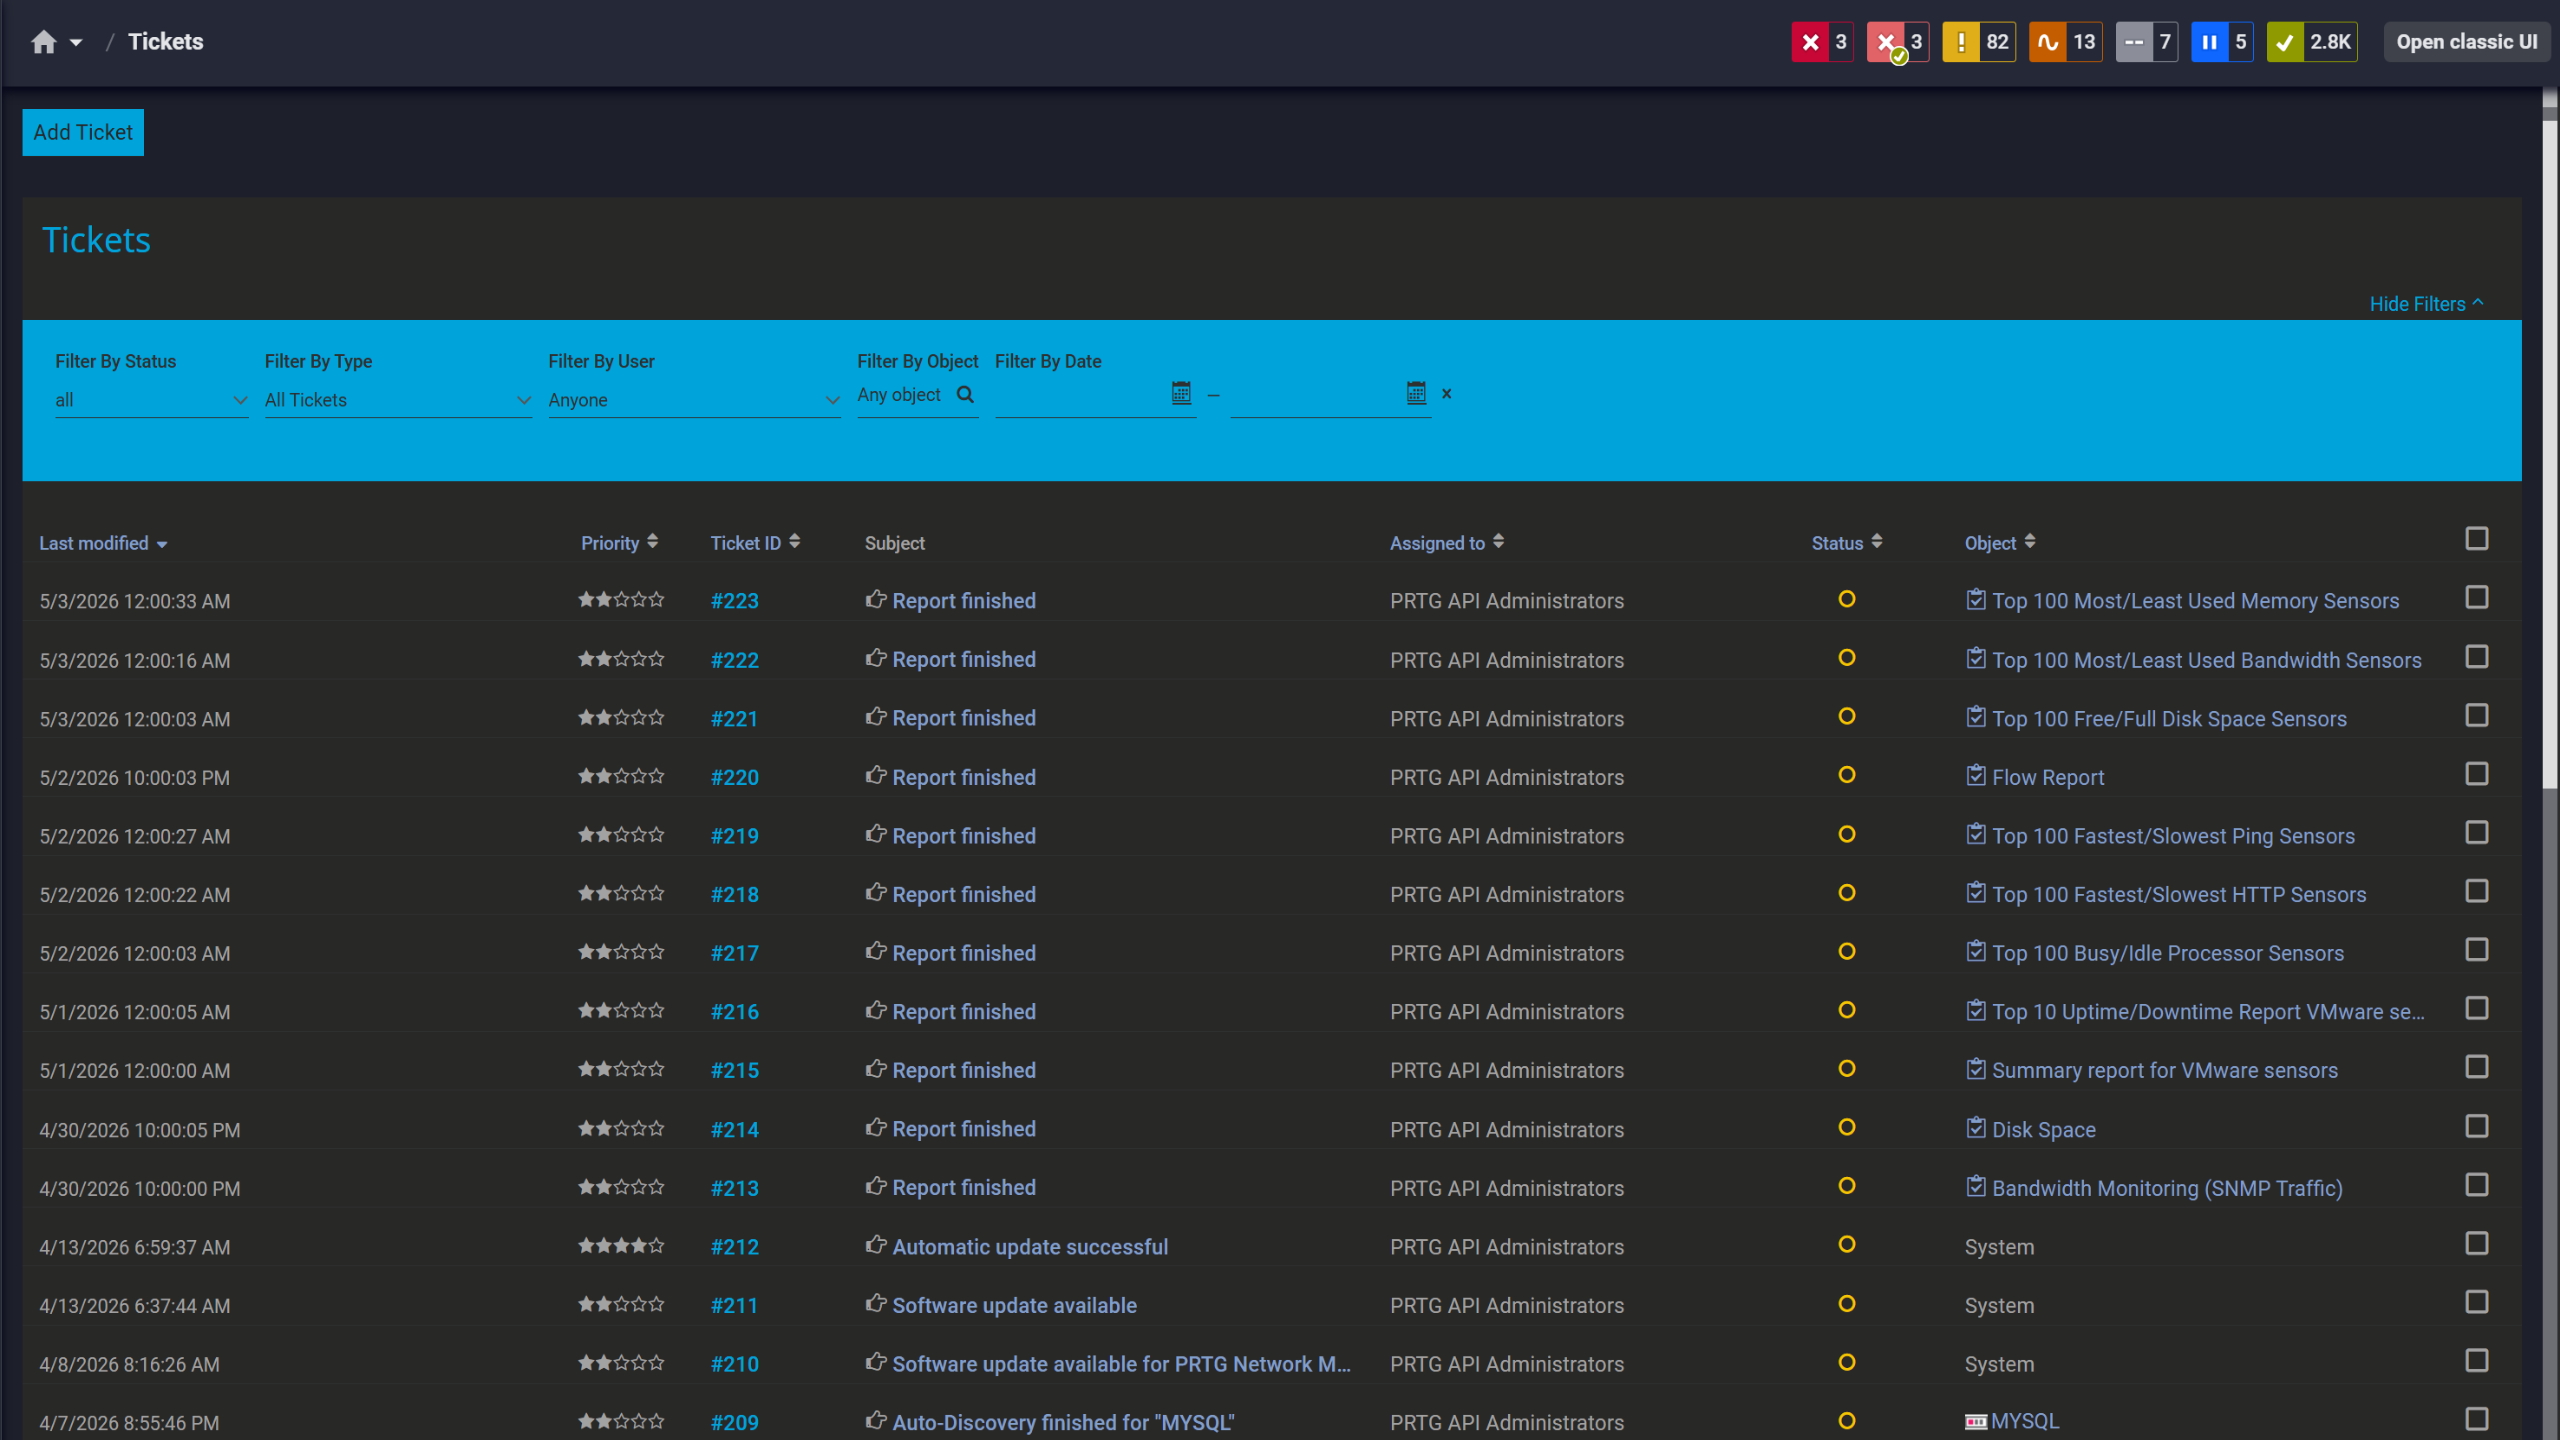
Tickets keep your team aligned

PRTG sunburst chart visualizing the full network hierarchy with color-coded sensor status

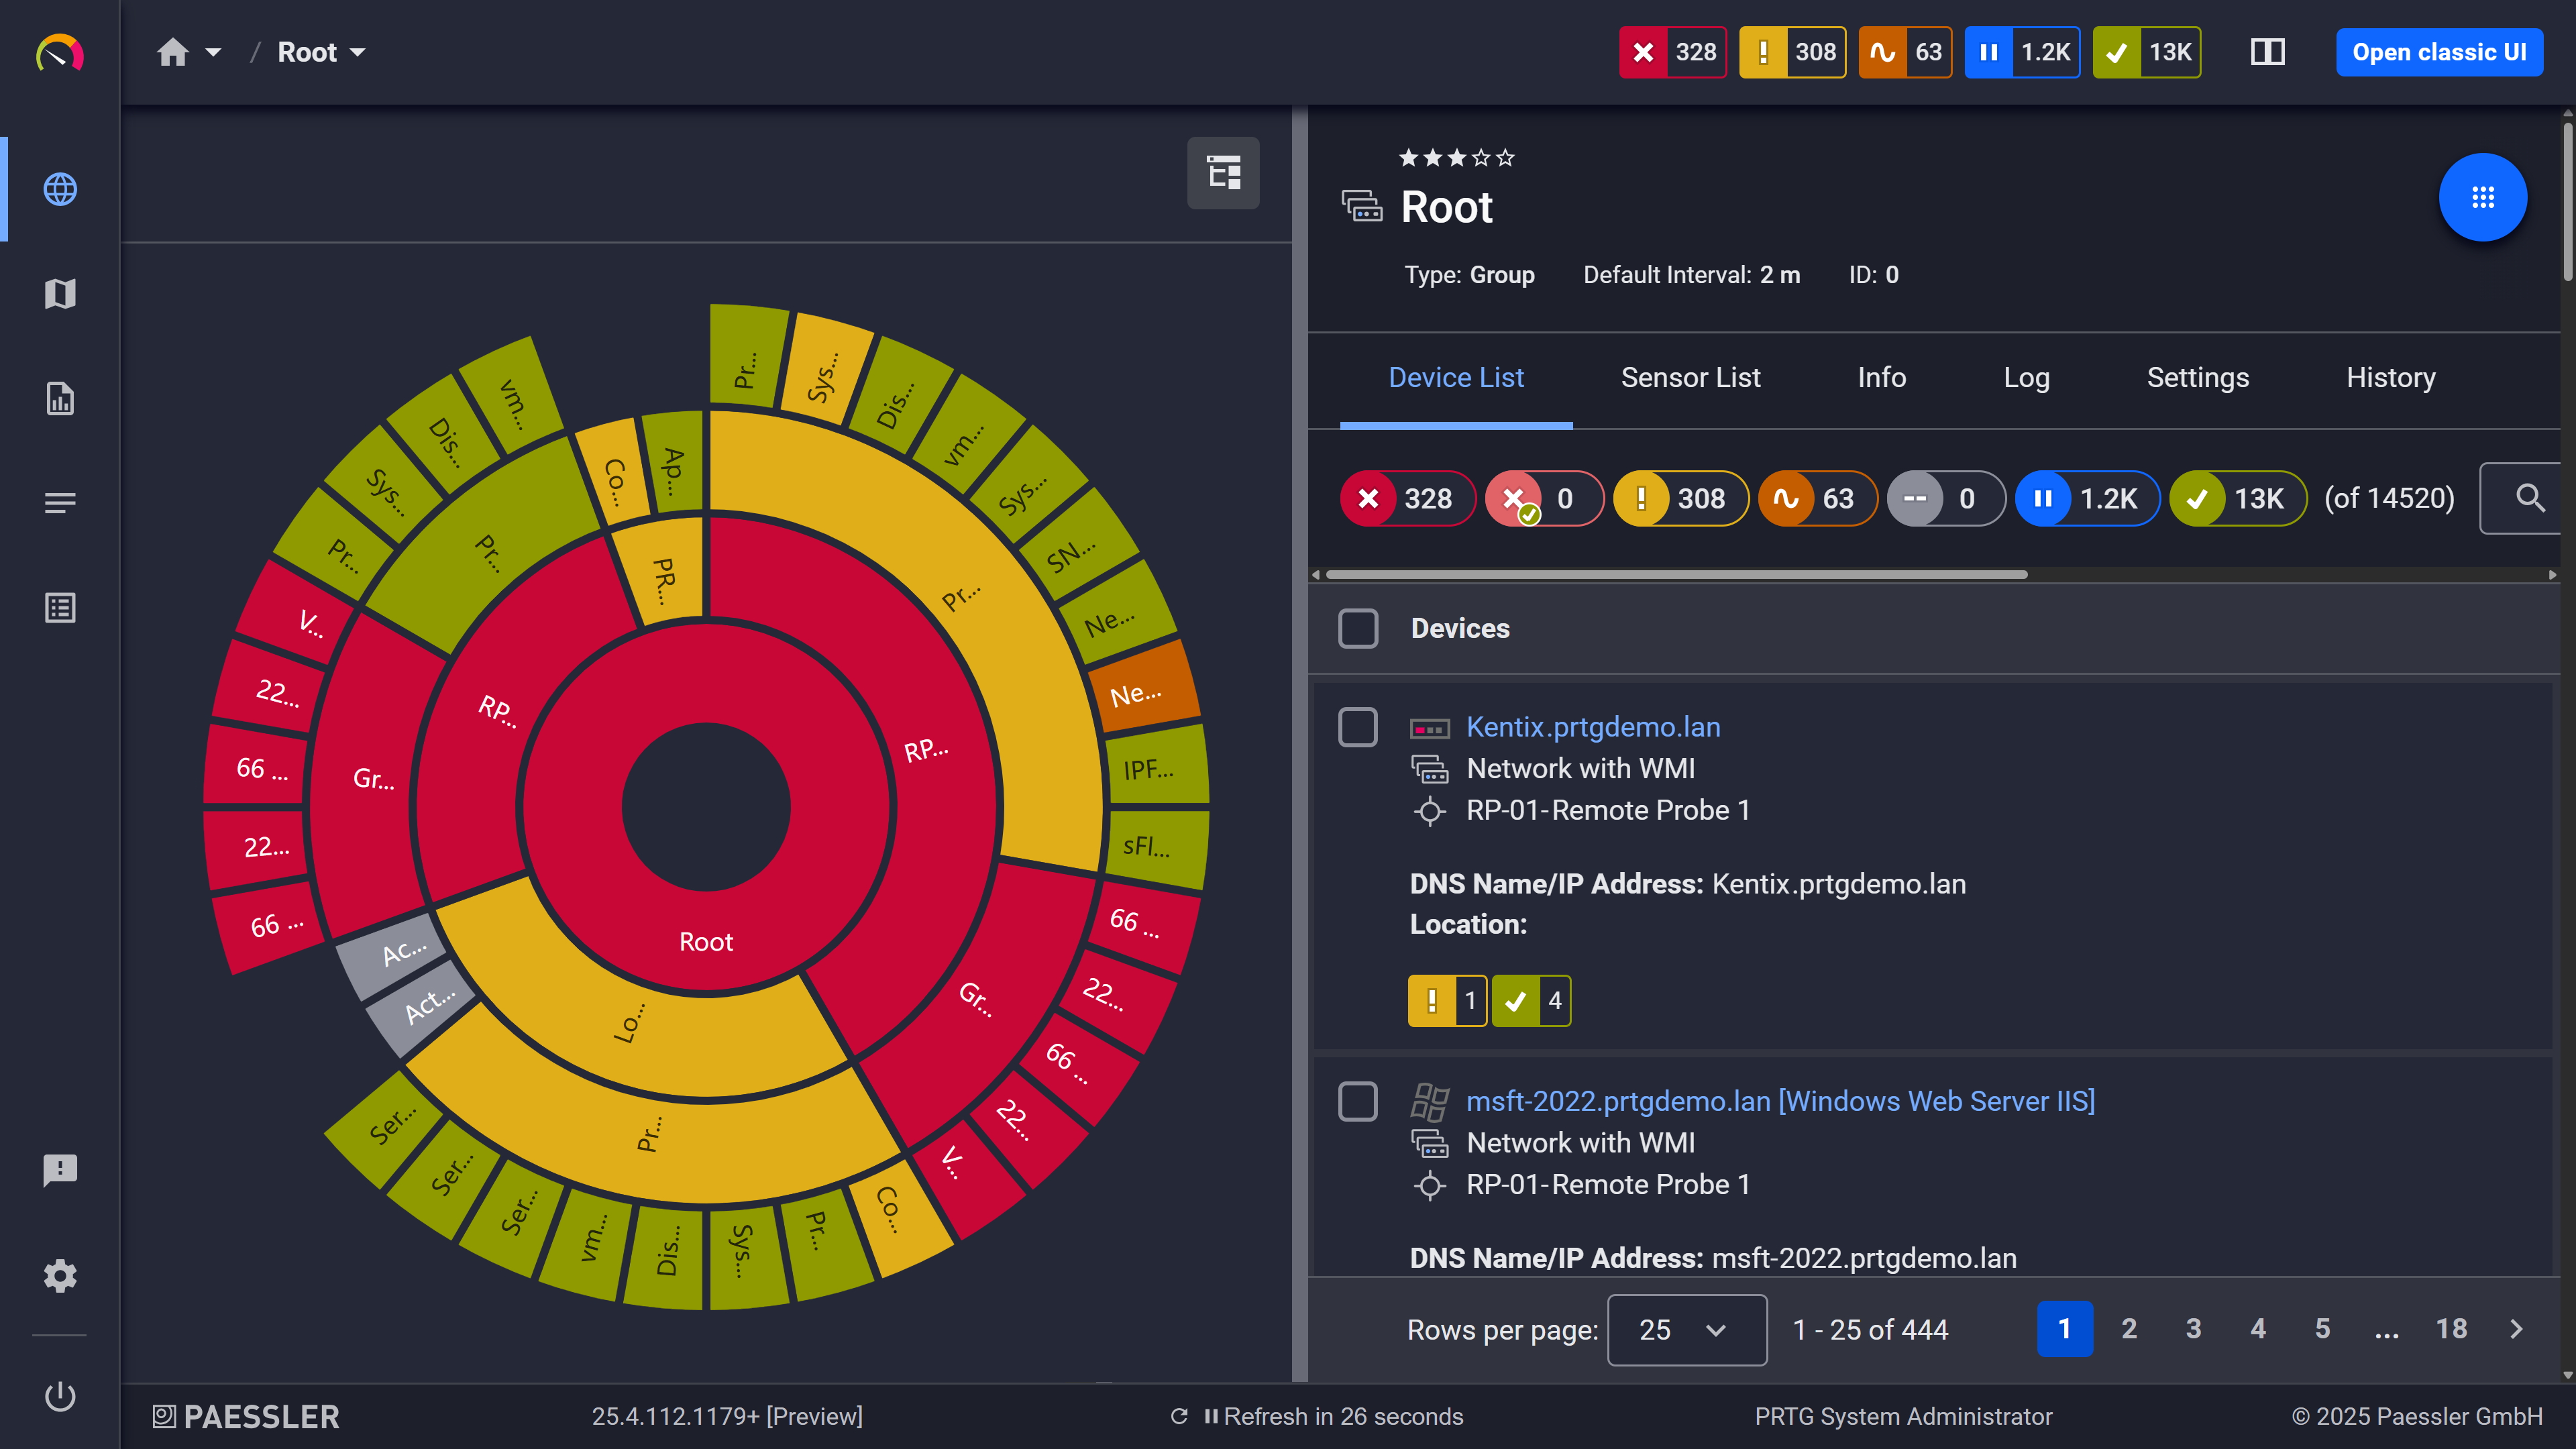
Your entire network, visualized instantly

PRTG web interface showing device tree and full device list with sensor status badges

Full device list, instant overview

One Dashboard for SaaS and Infrastructure Monitoring

You've got the SaaS provider's status page, a separate network monitoring tool, server monitoring somewhere else, and maybe a cloud cost dashboard. When performance tanks you're switching between four SaaS monitoring tools trying to piece together what went wrong. PRTG brings SaaS monitoring into the same monitoring system as your servers, network, and infrastructure. One dashboard. One alerting workflow. One place to troubleshoot.

  • Unified visibility for SaaS apps, on-premises systems, network, and hybrid infrastructure
  • Single alerting workflow instead of juggling notifications from multiple tools
  • Customizable dashboards combining SaaS metrics with infrastructure health
  • Faster root cause analysis when all layers are visible at once
  • Less tool sprawl means lower costs and easier team onboarding

How PRTG Monitors SaaS Applications 

PRTG gives you multiple ways to monitor SaaS environments for availability and performance, from native Microsoft 365 sensors to flexible API monitoring for any cloud application. Here's how it works.

Microsoft 365 Native Monitoring 

PRTG connects to Microsoft 365 via the Microsoft Graph API to pull service health, mailbox status, and workload-level metrics. The Microsoft 365 Service Status sensor monitors the overall health status of a Microsoft 365 subscription. For per-service detail, use the Service Status Advanced sensor to go one level deeper. You need one sensor per service workload. With the Microsoft 365 Mailbox sensor you monitor a folder within a Microsoft 365 mailbox, reporting mailbox folder metrics via Microsoft Graph. Worth noting: these sensors need Graph API authentication but nothing gets installed on Microsoft's infrastructure.

HTTP/HTTPS Endpoint Monitoring 

The HTTP sensor checks availability and response times for any web-based SaaS application or service endpoint. Content checks and form authentication go through the HTTP Advanced sensor, not the standard HTTP sensor. Also the Cloud HTTP v2 sensor tests endpoint availability from multiple locations across four continents via the PRTG Cloud, which matters when you need to confirm whether disruptions are regional or provider-wide. The HTTP sensor handles GET and POST. Check the Cloud HTTP v2 sensor settings for what request methods it supports.

REST API Monitoring 

The REST Custom and REST Custom v2 sensors can handle application performance monitoring for any SaaS application that provide a REST API. You define the endpoint, authentication method (none, basic authentication, or bearer token), and which JSON or XML fields to track. PRTG parses the response, pulls values via JSONPath or XPath, and graphs them as channels you can set thresholds on. This way you can cover a broad range of use cases: Salesforce status APIs, Google Workspace health endpoints, Zendesk ticket counts, or any custom SaaS app your organization depends on. The configuration requires knowing the API structure, but once it's set up the automation runs continuously and DevOps teams get monitoring data across the stack without manual checks.

Authentication Monitoring 

SaaS applications fail when authentication breaks. Expired certificates, SSO provider outages, API token issues: all of these cause disruptions that look like app problems until you dig deeper. PRTG monitors SSL certificate validity and expiration dates on your SaaS endpoints alerting you weeks before a cert expires. You can also test login endpoints directly with the HTTP sensor to validate that authentication services respond correctly. For API key or OAuth-based integrations PRTG tracks response codes to catch 401/403 errors before they turn into end-user reported problems.

Synthetic Endpoint Testing

PRTG tests endpoints at configurable intervals (60 seconds is a common setting; shorter intervals like 30 seconds are also available). This simulates user access from your monitoring location (or multiple global locations via Cloud HTTP v2) and measures what real access looks like: response time, uptime, and basic functionality. PRTG doesn't track actual user activity, client-side JavaScript performance, or individual user behavior. What it gives you is consistent baseline performance data from defined checkpoints so performance issues surface before users report them.

free downLoad

SaaS Monitoring: Manual vs. PRTG

Task

Without PRTG

Without PRTG

With PRTG

With PRTG

Checking Microsoft 365 service health

Without PRTG
not included

Manually visit admin portal and status page multiple times a day

With PRTG
included

Automated monitoring with instant alerts when service health changes; historical uptime tracking

Monitoring API response times

Without PRTG
not included

Manually test with curl/Postman, log results in a spreadsheet, no alerting

With PRTG
included

Continuous API monitoring with response time graphs, threshold alerts, and historical trend data

Tracking SaaS uptime across multiple services

Without PRTG
not included

Rely on vendor status pages (often delayed), no unified view, no proof of downtime

With PRTG
included

Real-time uptime monitoring from your network's perspective; unified dashboard; exportable SLA reports

Troubleshooting "the cloud app is slow"

Without PRTG
not included

Guess which layer is the problem; escalate blindly to the vendor

With PRTG
included

Correlate SaaS performance data with network, DNS, and infrastructure metrics; isolate root cause with data

Getting alerted before users complain

Without PRTG
not included

Users report issues first; reactive firefighting

With PRTG
included

Proactive threshold-based alerts via email, SMS, push, or ticketing integration

free downLoad

“With PRTG, we can comprehensively monitor our email services in the cloud, and ensure that – as the team in charge – we are immediately informed in the event of a malfunction and can quickly take actions to fix it. It wasn’t until we started using PRTG that we realized how error-ridden our Microsoft cloud service can be.”

Monitoring expert
Oettinger Davidoff

“Part of our infrastructure runs with Azure. This information is then sent to PRTG via Powershell. Paessler is a great solution for us. We get alerts sent directly to our phones and if something goes wrong somewhere, we can immediately deal with it. It’s our lifeline. This is why Paessler gives us a sense of security no matter what the time of day.”

Gert-Jan Hiddink, DevOps Engineer
CowManager

“As more and more companies start to integrate new systems, they aren’t going to use legacy networks. Instead, clients are implementing more cloud-based solutions with newer programming languages. Being able to closely monitor cloud-based solutions and customize sensors based on clients’ needs is extremely helpful in making sure the process runs and continues to function as smoothly as possible.”

Edgard Concha, Director of Information Systems
Resolvit

Paessler PRTG Network Monitor licenses & pricing

Choose the PRTG Network Monitor subscription that's best for you.

License NameLicense descriptionPriceLicense DetailsGet startedPricing Details
PRTG 500$200per month paid annuallyBuy nowBuy now

Enough to monitor multiple aspects of 50 devices

PRTG 1000$358per month paid annuallyBuy nowBuy now

Enough to monitor multiple aspects of 100 devices

PRTG 2500$742per month paid annuallyBuy nowBuy now

Enough to monitor multiple aspects of 250 devices

PRTG 5000$1,300per month paid annuallyBuy nowBuy now

Enough to monitor multiple aspects of 500 devices

PRTG 10000$1,642per month paid annuallyBuy nowBuy now

Enough to monitor multiple aspects of 1000 devices

Over 100,000 Customers Worldwide Love Paessler  

customer success stories

SaaS Monitoring: Frequently Asked Questions

Can PRTG monitor SaaS applications beyond Microsoft 365?

Yes. Any SaaS application with an HTTP/HTTPS endpoint or REST API works. The HTTP sensor covers web-based services, the REST Custom sensor handles API endpoints like Salesforce, Google Workspace, Slack, or ServiceNow, and the Cloud HTTP v2 sensor tests availability from multiple global locations. Native sensors exist for Microsoft 365, but monitoring SaaS applications across nearly any cloud-based platform just takes the right sensor and authentication method. These are also the most common use cases our customers start with.

Does PRTG provide real user monitoring for SaaS applications?

No. PRTG uses synthetic monitoring: it actively tests SaaS endpoints at regular intervals from defined locations to measure availability and response times. It doesn't track actual user sessions, client-side JavaScript, or individual user behavior. Solid for proactive visibility into SaaS performance from your network's perspective. Not a replacement for real user monitoring tools if that's what you need.

How does PRTG monitor REST API performance?

The REST Custom and REST Custom v2 sensors query REST API endpoints and parse JSON or XML responses. You configure the API URL, authentication method, and define which response fields to extract using JSONPath or XPath. PRTG graphs those values as channels and fires alerts when they cross thresholds. Works for status APIs, performance metrics, resource counts, anything your SaaS provider exposes via REST.

Can PRTG alert me before a SaaS service goes completely down?

Yes, if you set up threshold-based alerts on the right performance metrics. Set PRTG to alert when API response times exceed 2 seconds and you catch degradation before complete failure. You can also monitor secondary indicators like certificate expiration, authentication endpoint response codes, or Microsoft 365 service health feeds. PRTG won't predict outages, but it catches early warning signs if your thresholds are configured to look for them.

Does PRTG require agents on SaaS platforms?

No. PRTG monitors SaaS apps remotely via HTTP, HTTPS, and REST API calls. Nothing gets installed on the provider's side. For Microsoft 365 you need Graph API permissions. For other SaaS apps, you typically need credentials that match the supported authentication methods: none, basic authentication, or an OAuth2 bearer token.

Can I monitor SaaS application dependencies with PRTG?

Yes. PRTG covers the full dependency chain: DNS resolution, network connectivity to the SaaS endpoint, SSL certificate validity, authentication server availability, and on-premises integration points like VPN gateways or proxy servers. Group sensors logically by dependency and when a user reports an app is down you can immediately see whether it's the provider, your network, DNS, or an expired certificate. The scalability of PRTG's sensor architecture means you can optimize and expand monitoring as your SaaS environments grow without restructuring what you've already built. PRTG is licensed by sensor count. You choose a license tier that fits your monitoring scope. If you need more sensors, you upgrade to the next tier.

Paessler PRTG

Paessler PRTG

Network Monitoring Software – Version 26.1.116.1532 (February 9th, 2026)

Hosting icon

Hosting

Download for Windows and cloud-based version PRTG Hosted Monitor available

Languages icon

Languages

English, German, Spanish, French, Portuguese, Dutch, Russian, Japanese, and Simplified Chinese

test

Monitor everything

Network devices, bandwidth, servers, applications, virtual environments, remote systems, IoT, and more

test

Pricing

Choose the PRTG Network Monitor subscription that's best for you

Discover more monitoring insights and stories

Content illustration

Powerful stories from the monitoring world

  • What Is SaaS? – IT Explained
  • Global launch of Paessler PRTG Hosted Monitor
  • The ultimate guide to monitoring your cloud IT and hybrid IT ...
Support illustration

Resources to master your monitoring challenges

  • PRTG Manual: Common SaaS Sensor - Paessler
  • Common SaaS Check sensor added after update - Paessler Helpdesk
  • What are the URLs/IPs used in the Common SaaS Check?
Solution illustration

Solutions for all your monitoring needs

  • SaaS Monitoring
  • Monitoring Cloud
  • Cloud Monitoring
PRTG Logo

Start Monitoring with PRTG and see how it can make your network more reliable and your job easier.

Free download
PRODUCT OVERVIEW

Products

  • Paessler PRTG
    Paessler PRTGMonitor your whole IT infrastructure
    • PRTG Network Monitor
    • PRTG Enterprise Monitor
    • PRTG Hosted Monitor
    • PRTG UVexplorer
    • PRTG extensions
      Extensions for Paessler PRTGExtend your monitoring to a new level
  • Icon Features
    FeaturesExplore all monitoring features

Monitoring with PRTG

  • Network monitoring
  • Bandwidth monitoring
  • SNMP monitoring
  • Network mapping
  • Wi-Fi monitoring
  • Server monitoring
  • Network traffic analyzer
  • NetFlow monitoring
  • Syslog server

Useful Links

  • PRTG Manual
  • Knowledge Base
  • Customer Success Stories
  • About Paessler
  • Subscribe to newsletter
  • PRTG Support
  • PRTG Consulting
  • PRTG Feedback & Roadmap

Contact

Paessler GmbH
Thurn-und-Taxis-Str. 14, 
90411 Nuremberg 
Germany

[email protected]

+49 911 93775-0

  • Contact us
©2026 Paessler GmbHTerms & ConditionsPrivacy PolicyImprintReport VulnerabilityDownload & InstallSitemap
-Citrix Monitoring -Citrix Monitoring -Citrix Monitoring