Custom alerts and data visualization let you quickly identify and prevent website availability and page speed issues.
Monitor the availability of your website 24/7 with Paessler PRTG using, for example, the included HTTP v2 or HTTP Advanced sensor.
Global companies can monitor availability from a variety of locations all over the world with the preconfigured Cloud HTTP v2 and Cloud Ping v2 sensors that also come with PRTG out of the box.
Optimize system performance by monitoring website load time and how it changes over an extended period of time.
It’s easy with the included HTTP Full Web Page sensor, which also allows you to identify individual elements that are responsible for slow load times so you can take action before downtimes occur.
Ensure all website processes are running smoothly from end to end, including your online store, homepage, shopping cart, status page, and more – for an enhanced customer experience.
Just use the preconfigured HTTP Transaction sensor for transaction monitoring and for keeping an eye on a whole series of URLs used during a complete shopping process, for example.
Diagnose network issues by continuously tracking website speed and availability from different locations all over the world. Show load times, website processes, SSL certificate expiry, bandwidth bottlenecks, and other key metrics in real time. Visualize monitoring data in clear graphs and dashboards to identify problems more easily. Gain the overview you need to troubleshoot web performance issues and prevent outages.
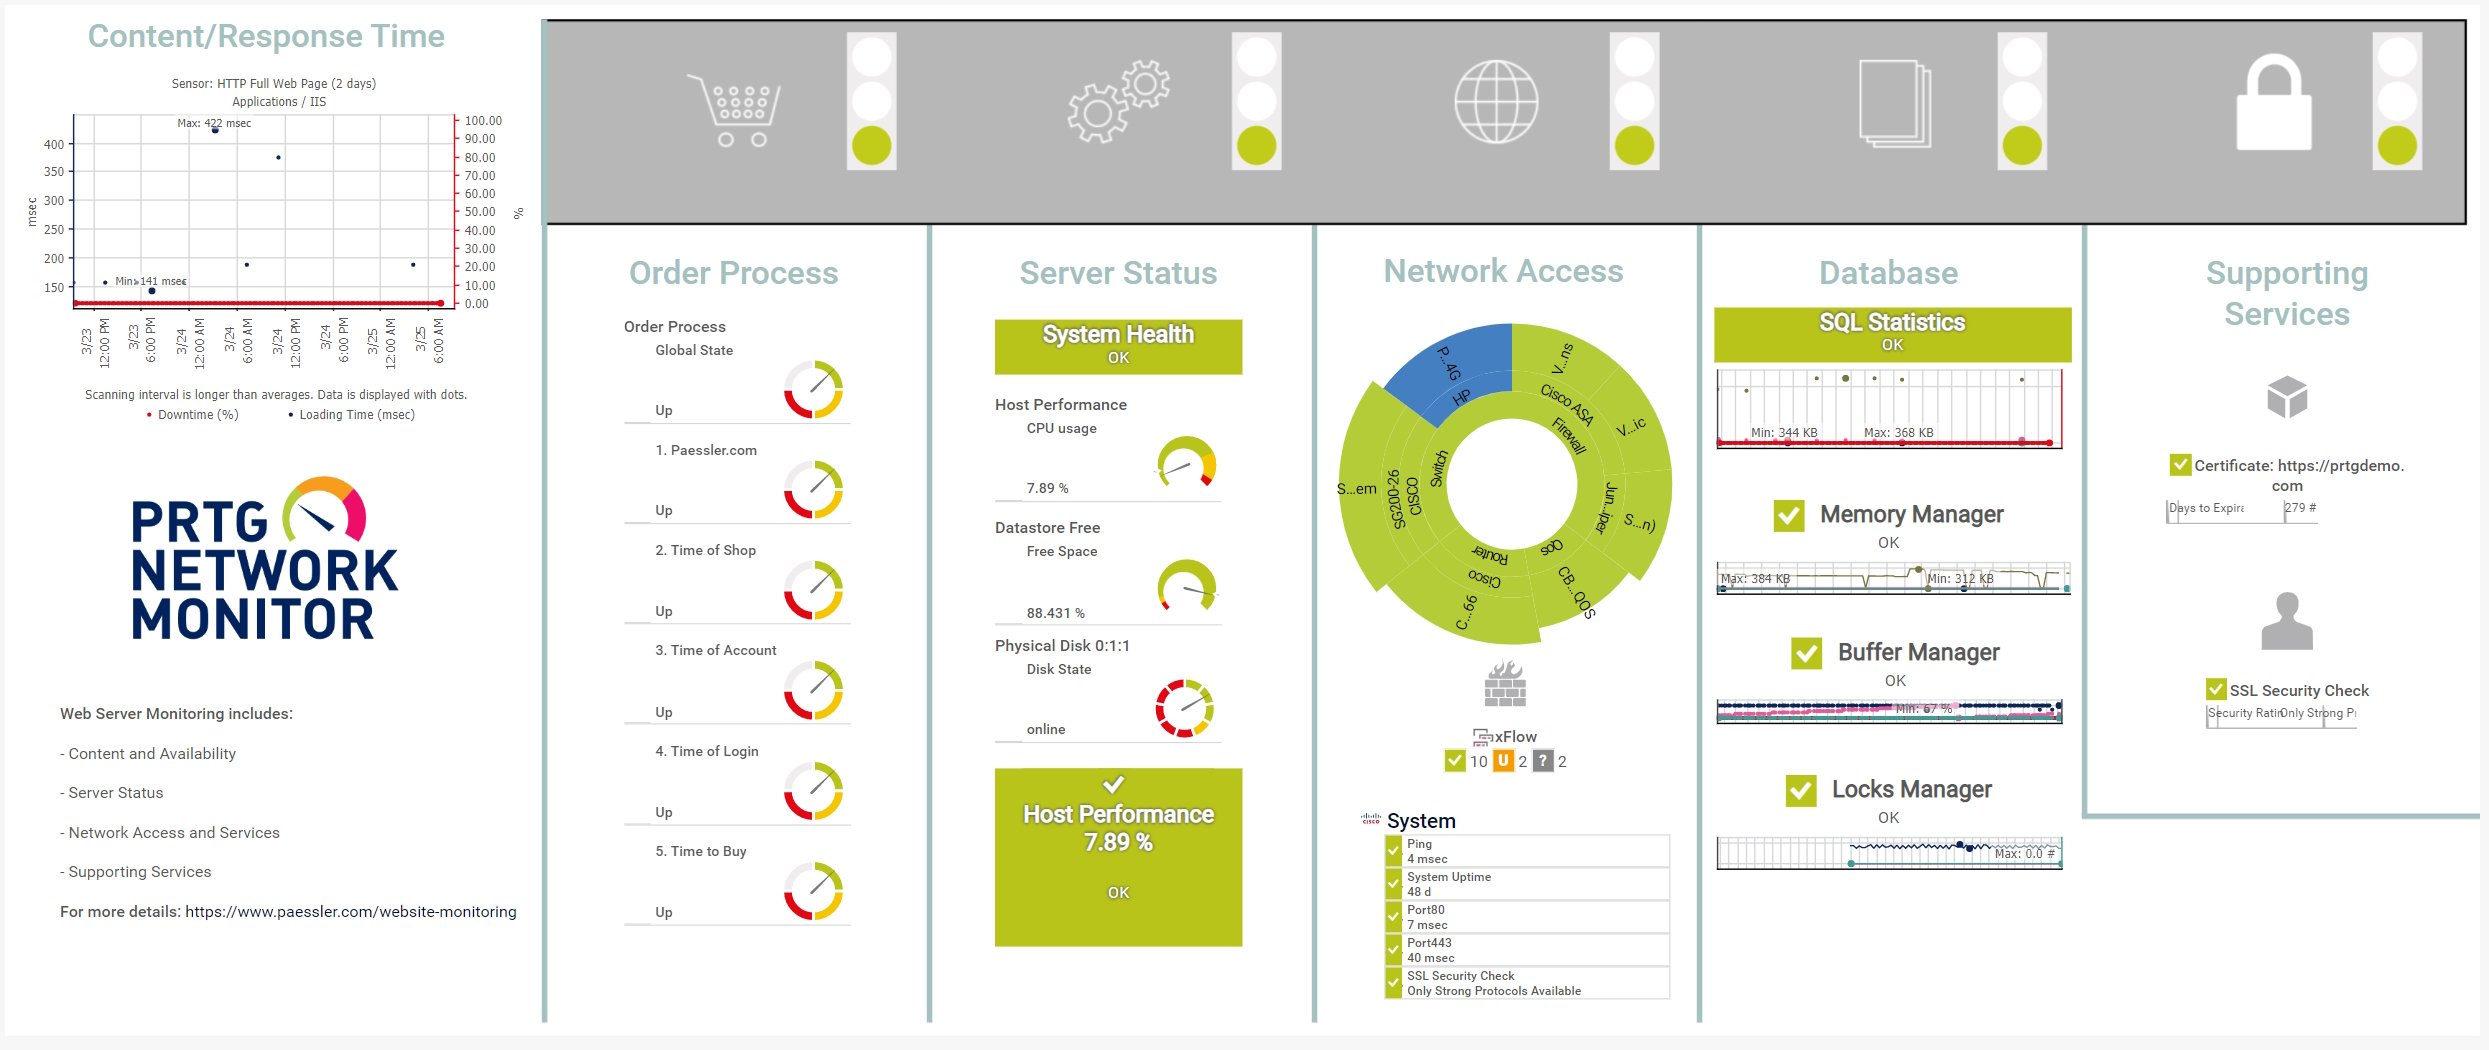
Map for web server monitoring in PRTG

Device tree view of the complete monitoring setup

Custom PRTG dashboard for keeping an eye on the entire IT infrastructure

Live traffic data graph in PRTG
“All-around winning
network monitor”
“The real beauty of PRTG is the endless possibilities it offers”
“PRTG Network Monitor
is very hard to beat”
PRTG comes with more than 250 native sensor types for monitoring your entire on-premises, cloud, and hybrid cloud environment out of the box. Check out some examples below!
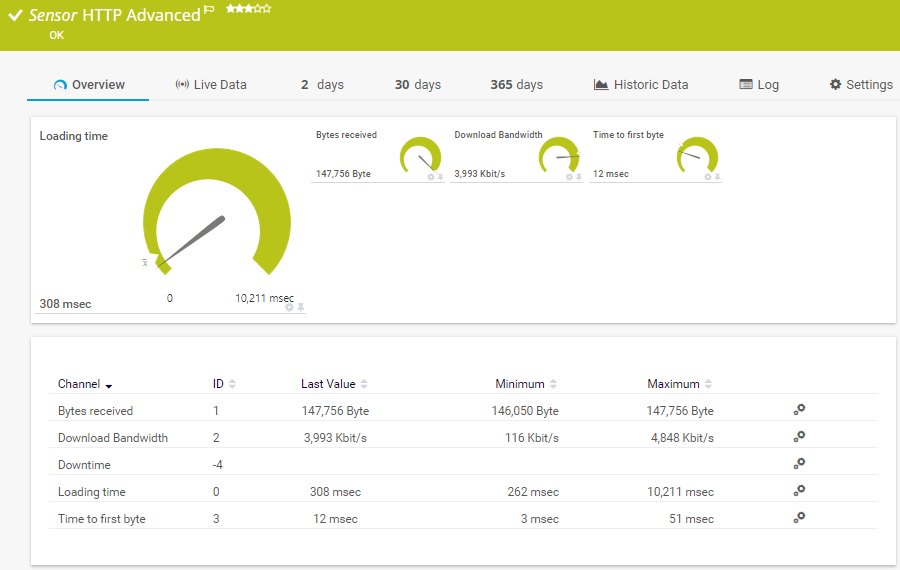
The HTTP Advanced sensor monitors the source code of a web page using HTTP. It supports authentication, content checks, and other advanced parameters. It can show the following:
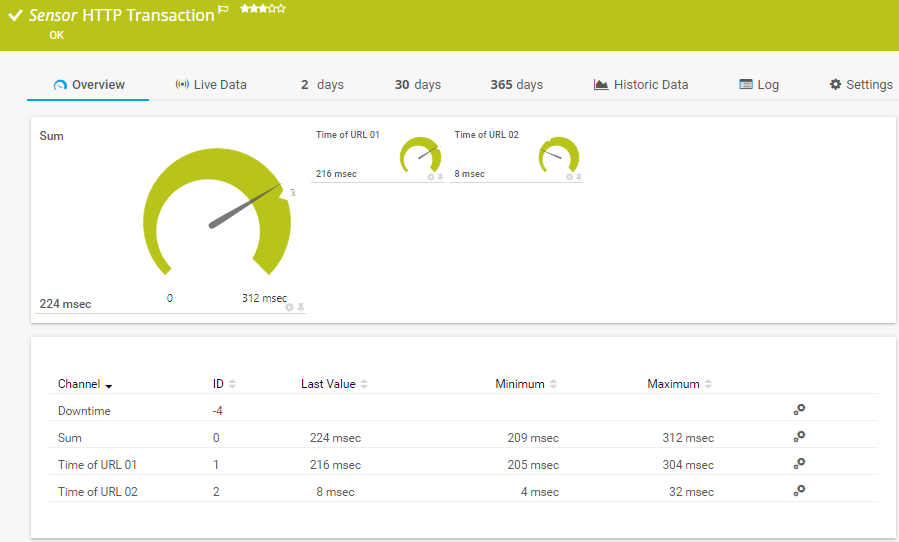
The HTTP Transaction sensor monitors an interactive website, such as a web shop, by performing a transaction using a set of HTTP URLs. The sensor monitors whether logins or shopping carts work properly. It can show the following:
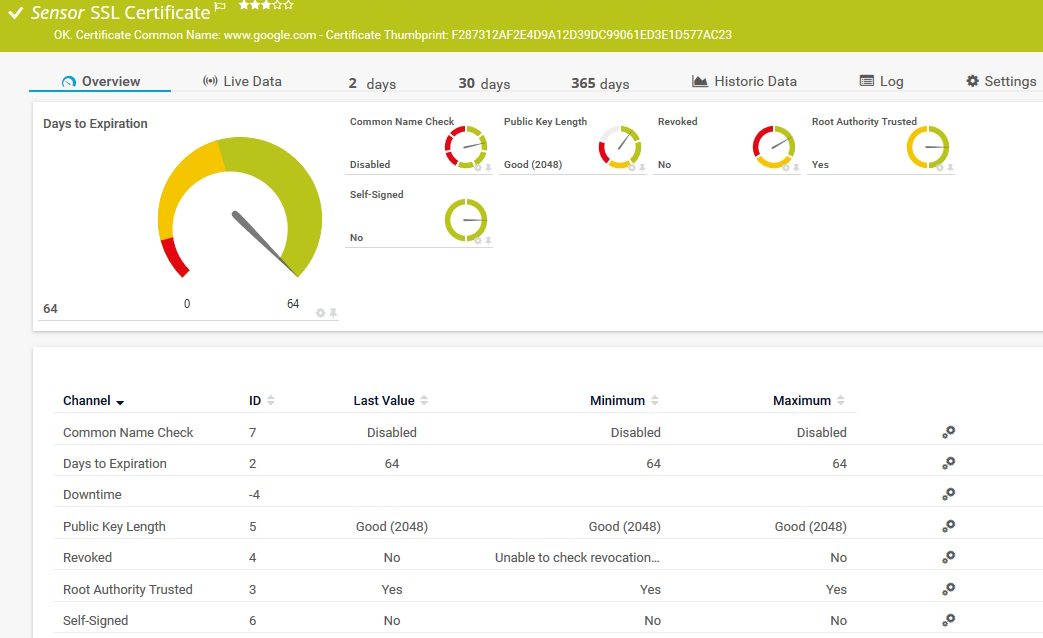
The SSL Certificate sensor monitors the certificate of a Secure Sockets Layer (SSL)/Transport Layer Security (TLS) secured connection. It can show the following:
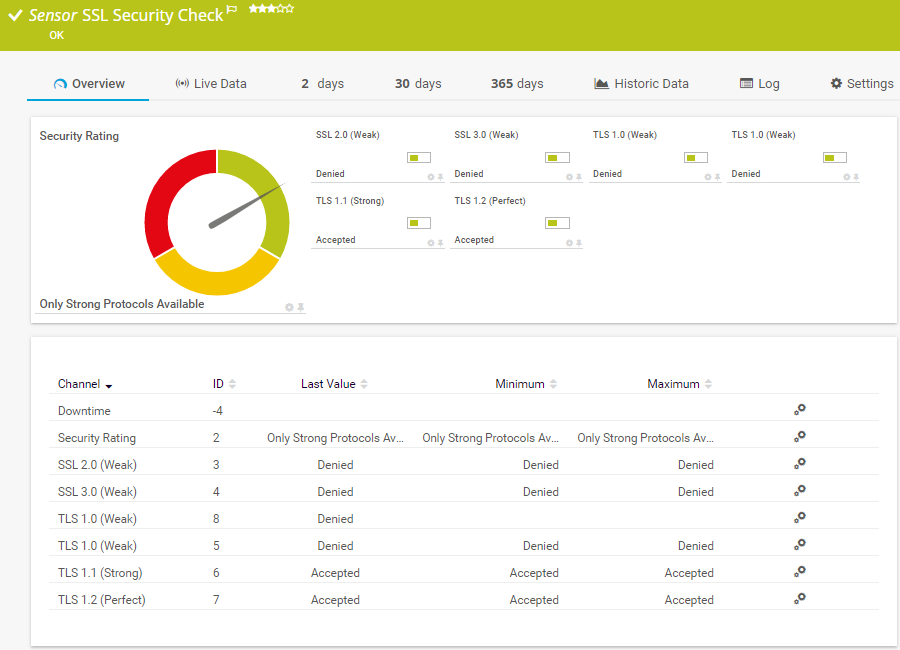
The SSL Security Check sensor monitors Secure Sockets Layer (SSL)/Transport Layer Security (TLS) connectivity to the port of a device. It tries to connect to the specified TCP/IP port number of a device with different SSL/TLS versions and shows if the device supports a particular protocol. It can show the following:
See the PRTG Manual for a list of all available sensor types.

Custom alerts and data visualization let you quickly identify and prevent website availability and page speed issues.
PRTG is set up in a matter of minutes and can be used on a wide variety of mobile devices.


“Great interface, intuitive, full REST support. custom scripts, rest sensors add extra value. We have been using PRTG for 10 years now in multiple environments and use cases. it has by far the best interface and very easy to setup without prior experience.”
Partnering with innovative IT vendors, Paessler unleashes synergies to create
new and additional benefits for joined customers.
baramundi and PRTG create a secure, reliable and powerful IT infrastructure where you have everything under control - from the traffic in your firewall to the configuration of your clients.
Combining PRTG’s broad monitoring feature set with IP Fabric’s automated network assurance creates a new level of network visibility and reliability.
Combine PRTG’s monitoring of everything with SQmediator’s deep insights into your communications infrastructure to ensure and improve your company’s communications plant and troubleshooting abilities.
Real-time notifications mean faster troubleshooting so that you can act before more serious issues occur.
Network Monitoring Software – Version 26.1.116.1532 (February 9th, 2026)
Download for Windows and cloud-based version PRTG Hosted Monitor available
English, German, Spanish, French, Portuguese, Dutch, Russian, Japanese, and Simplified Chinese
Network devices, bandwidth, servers, applications, virtual environments, remote systems, IoT, and more
Choose the PRTG Network Monitor subscription that's best for you


Web monitoring is the process of observing and testing the performance, availability, and functionality of a website or web application. It involves continuously checking various metrics such as uptime, response time, and user experience to ensure the site operates smoothly and meets performance goals. This proactive approach, usually with web monitoring tools like PRTG, helps identify issues promptly, minimizing downtime and ensuring a positive user experience.
Monitoring your website with online monitoring tools such as PRTG is crucial for several reasons.
To monitor if login attempts to a web page with a specific username and password combination are successful, you can use the HTTP Advanced sensor. If the website of which you want to check login credentials uses POST data to log in to the internal area, you have to find out the needed POST data for the login and provide it with the correct syntax in the settings of the sensor.
Furthermore, you have to find the response of the login form for unsuccessful login attempts. The HTTP Advanced sensor can check this answer for defined keywords and show a warning or down status if keywords are found that indicate a failed login.
This Paessler Knowledge Base article describes how you can set up a basic Business Process sensor for the sample use case “website backend monitoring”.
This Paessler Knowledge Base article describes how you can set up a basic Business Process sensor for the sample use case “website frontend monitoring”.
Yes. PRTG can monitor your entire IT infrastructure including network traffic, applications, bandwidth, cloud services, virtual environments, network security, web services, and much more.
Find some more examples here:
In PRTG, “sensors” are the basic monitoring elements. One sensor usually monitors one measured value in your network, for example the traffic of a switch port, the CPU load of a server, or the free space on a disk drive. On average, you need about 5-10 sensors per device or one sensor per switch port.
Paessler conducted trials in over 600 IT departments worldwide to tune its network monitoring software closer to the needs of sysadmins. The result of the survey: over 95% of the participants would recommend PRTG – or already have.

Paessler PRTG is used by companies of all sizes. Sysadmins love PRTG because it makes their job a whole lot easier.
Bandwidth, servers, virtual environments, websites, VoIP services – PRTG keeps an eye on your entire network.
Everyone has different monitoring needs. That’s why we let you try PRTG for free.