
- English
- Deutsch
- Español
- Français
- Italiano
- Português
Most monitoring tools tell you whether your server responded. That's a start, but it's not the full picture. A complete website availability monitoring setup tracks response times, verifies that page content is actually correct, monitors SSL certificate validity, and checks reachability from locations outside your own network. Paessler PRTG covers all of this with preconfigured sensors, so you don't need separate tools for uptime, performance, and SSL monitoring.
PRTG monitors HTTP/HTTPS endpoints and common web server platforms including IIS, Apache, and nginx. SSL certificates, DNS resolution, TCP ports, and IP addresses are covered by dedicated sensors. Web server resource monitoring is available via WMI and SNMP.

An internal availability check confirms the server responds from your network. External users reach your site through DNS resolution, public routing, and CDN edge nodes, all of which need separate coverage to get the full picture. PRTG's Cloud HTTP v2 and Cloud Ping v2 sensors check from 5 external locations across 4 continents: Singapore, Sydney, Ireland, Northern Virginia, and Northern California. Per-location response data comes in continuously, so you can tell whether an outage is global or confined to one region. The probe needs internet access to the PRTG Cloud API. No external infrastructure to deploy or maintain.
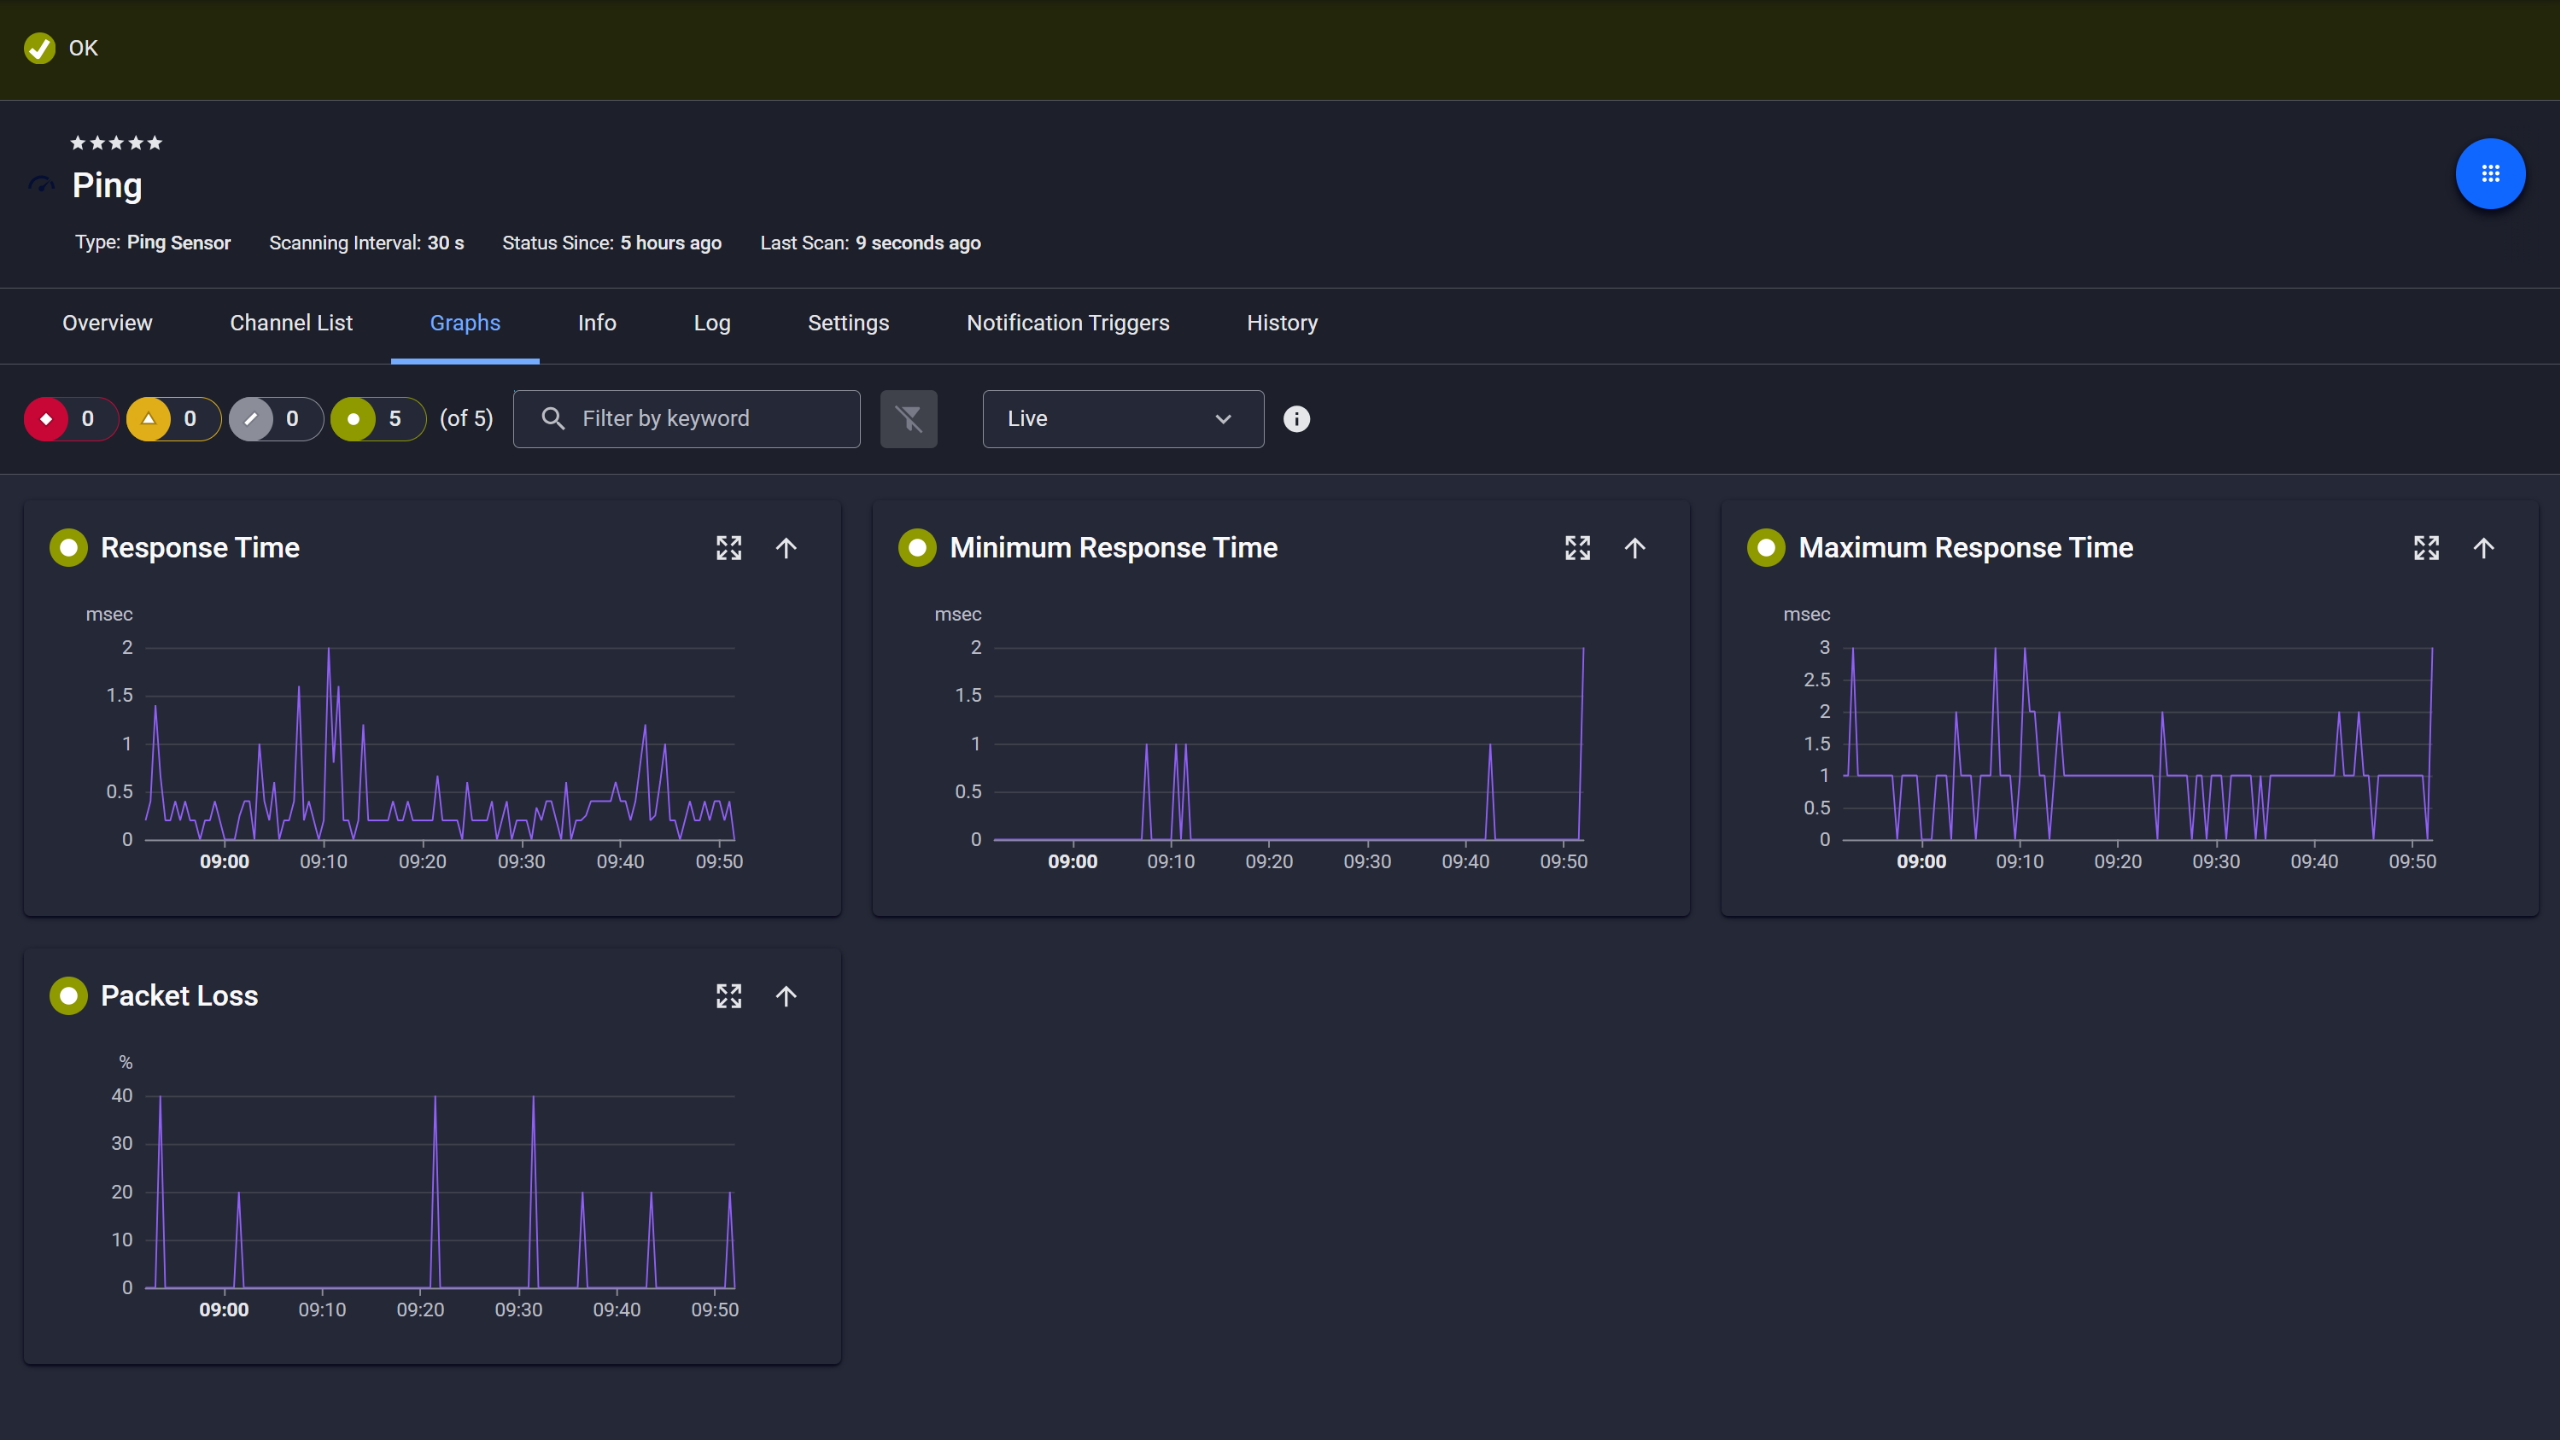
Ping response and packet loss

Live graphs, real-time performance data

Scheduled reports, always on time
The HTTP Advanced sensor doesn't stop at response codes. It fetches the page and checks the actual HTML source against keywords you configure. Define what must be present, define what must not appear, and the sensor alerts when either condition is violated. That covers database errors returning 200 with a blank body, deployments that wipe main content, and any other case where the server responds but the page doesn't deliver what it should. Set it up once, and every check from that point confirms the page returns what it's supposed to.
Start monitoring your infrastructure in minutes. No professional services, no complex configuration, no risk.
SSL certificates across multiple domains each have their own expiry date, and keeping track of all of them manually adds up fast. Add one SSL Certificate sensor per domain or subdomain and PRTG takes it from there. PRTG tracks validity and days to expiration for each certificate. The default thresholds are a warning at 90 days and an error at 30 days, and both are adjustable to fit your renewal process. Alerts go out via email, SMS, or push notification. Routing to Slack or another tool works through webhook configuration.
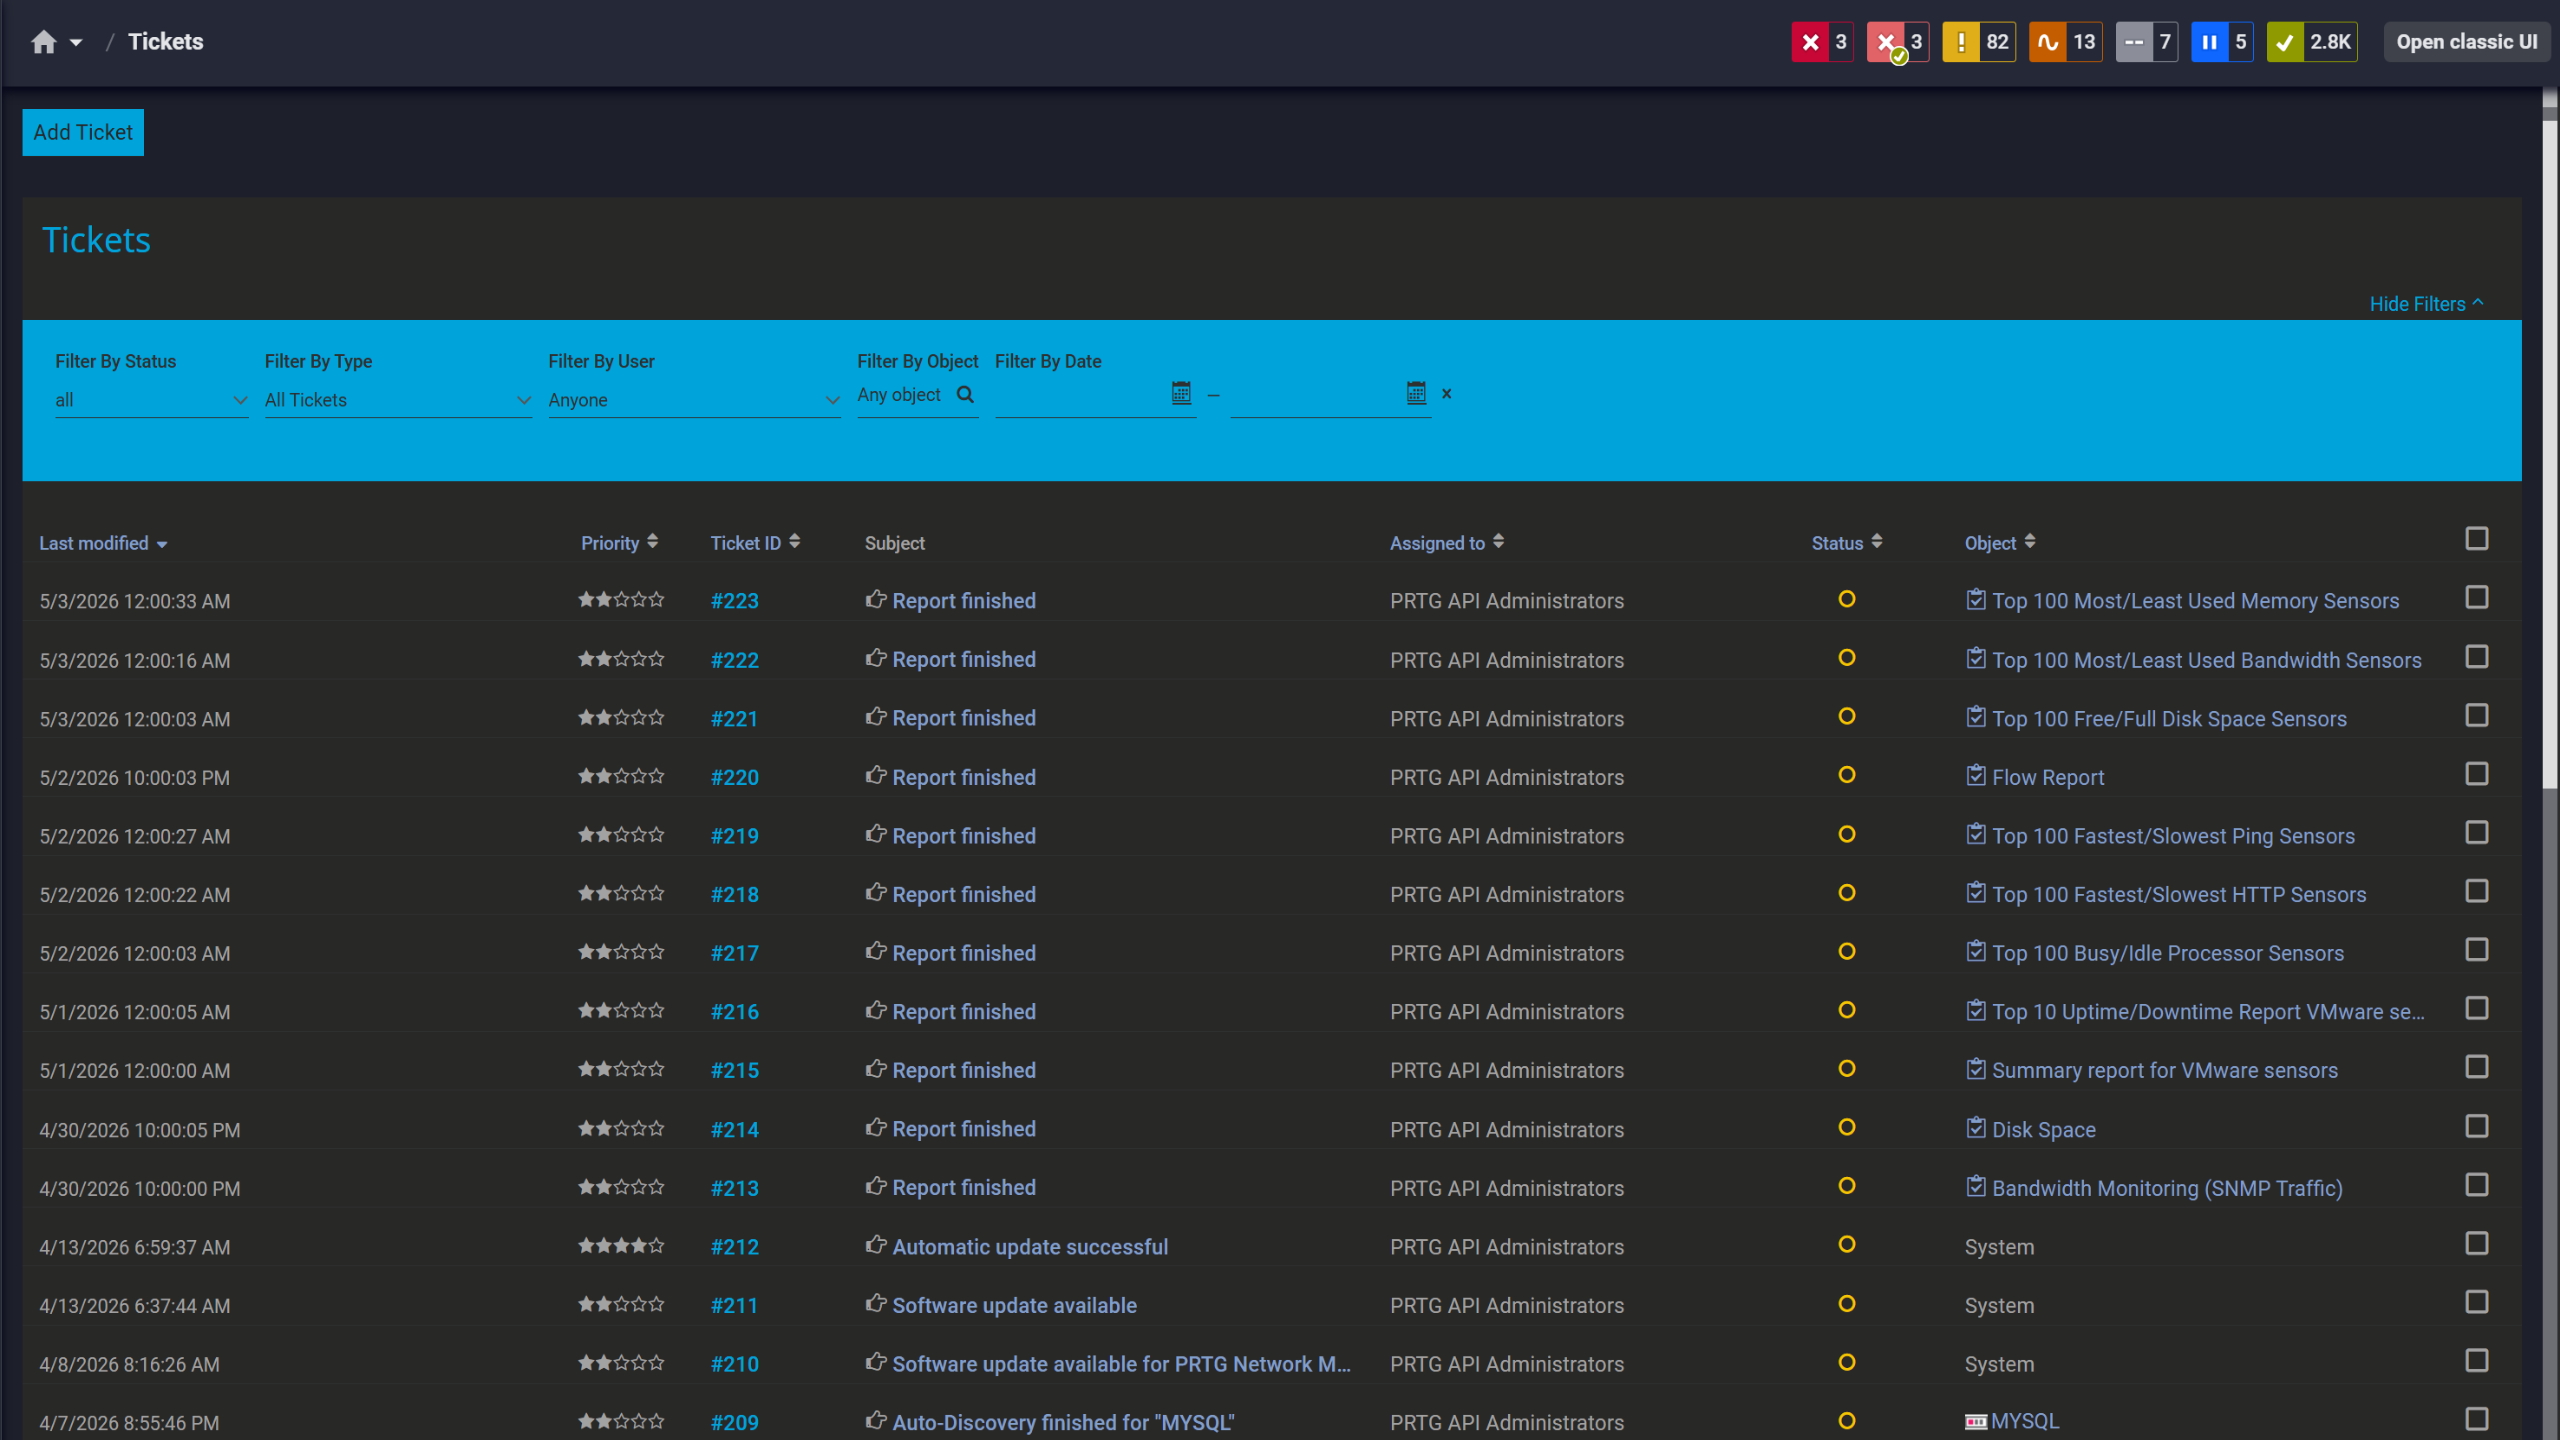
Tickets keep your team aligned

Full device list, instant overview
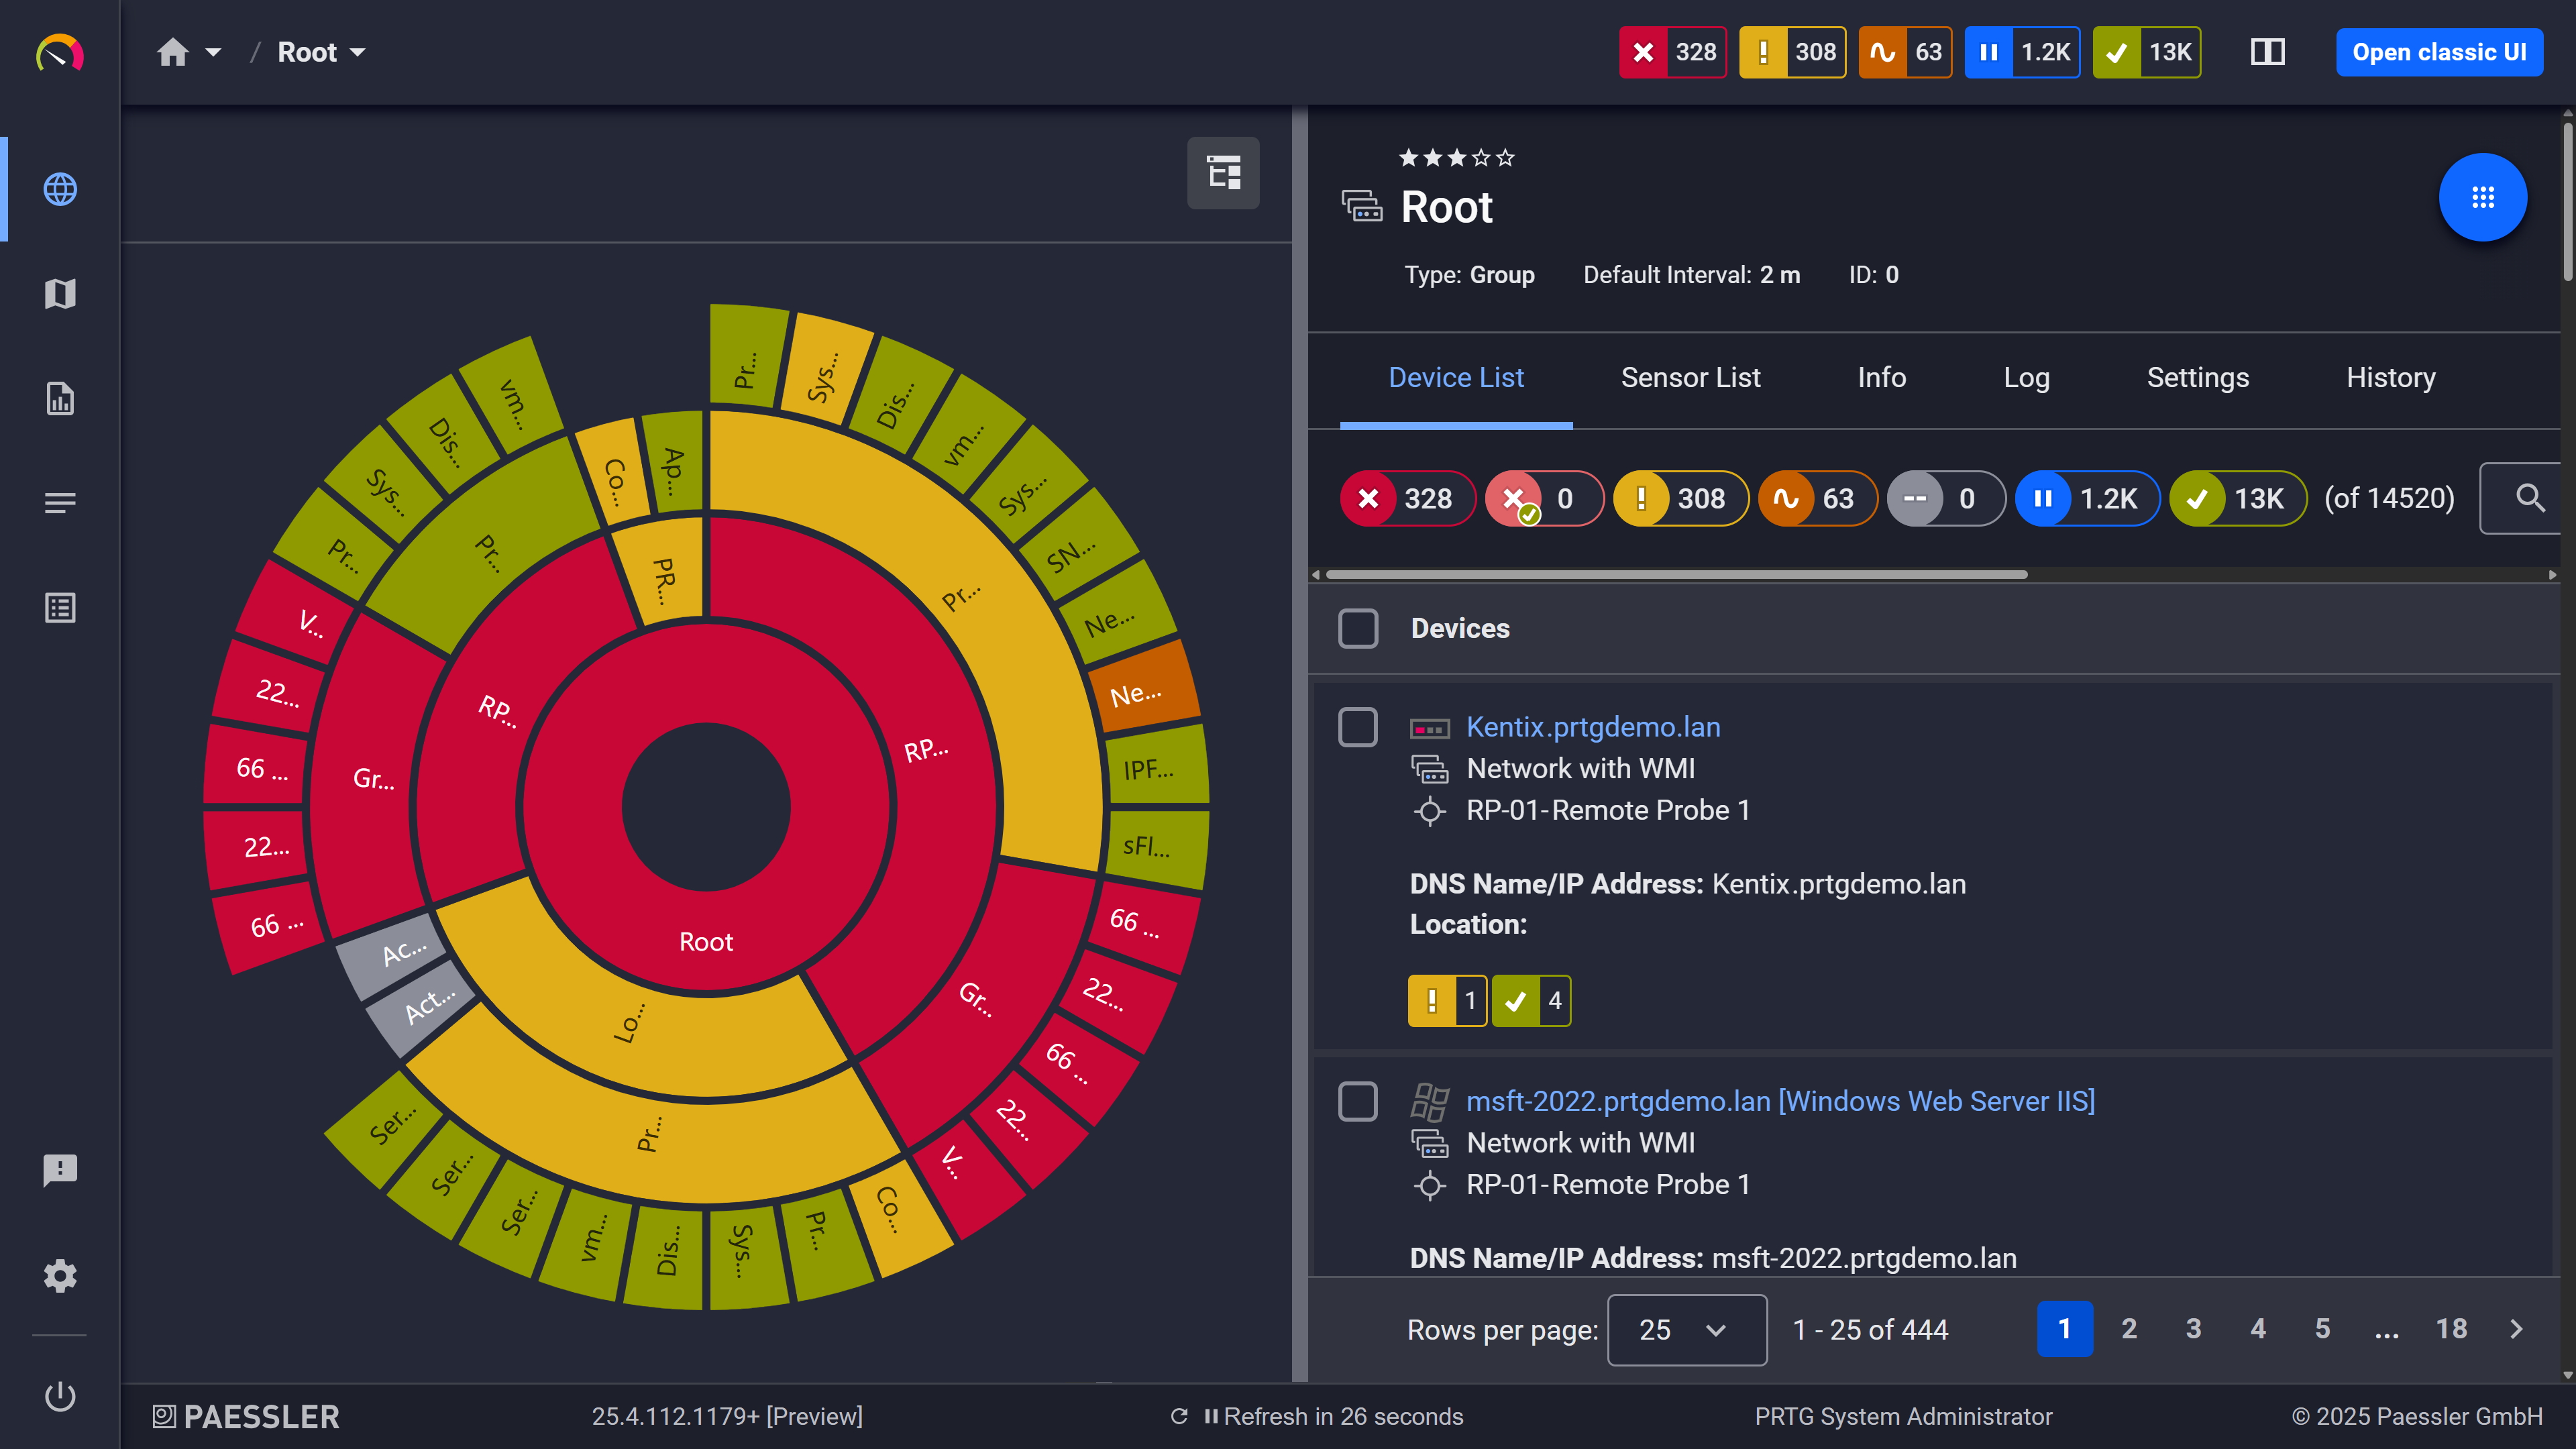
Your entire network, visualized instantly
A site that loads in 400ms this month and 2 seconds next month is technically 'up' the entire time. Setting thresholds on loading time or TTFB means that drift produces an alert as soon as it crosses a defined limit. Historical data is stored and graphed over days, weeks, or months, so when there's a troubleshooting conversation to have, the full performance trend is already there. PRTG's HTTP sensors track Loading Time and Bytes Received as dedicated channels. The HTTP Advanced sensor adds Time To First Byte as a separate channel.
PRTG uses dedicated sensors for each layer of website availability monitoring: HTTP response, content integrity, SSL validity, DNS, TCP, and server health. Each sensor runs independently and reports into the same device object in PRTG's device tree.
Task | Without PRTG Without PRTG | With PRTG With PRTG |
|---|---|---|
Detecting a broken page that returns HTTP 200 | Without PRTG Manual spot-checking or waiting for user reports | With PRTG HTTP Advanced sensor checks page content on every interval and alerts if expected content is missing |
Knowing if the site is unreachable in a specific region | Without PRTG No visibility without setting up your own external test infrastructure | With PRTG Cloud sensors check from 5 external locations across 4 continents |
SSL certificate expiry tracking | Without PRTG Calendar reminders, spreadsheets, or discovered after HTTPS already broke | With PRTG SSL Certificate sensor tracks Days to Expiration and alerts before it becomes an outage |
Response time trend data for troubleshooting | Without PRTG No historical baseline; degradation goes unnoticed until complaints arrive | With PRTG Loading time and TTFB stored per check interval, graphed over time, threshold-alertable |
Connecting HTTP issues to web server health | Without PRTG Two separate tools, manual cross-referencing | With PRTG HTTP and server sensors on the same device, visible in one dashboard view |
Choose the PRTG Network Monitor subscription that's best for you.
| License Name | License description | Price | License Details | Get started | Pricing Details | |
|---|---|---|---|---|---|---|
| PRTG 500 | $200 | per month paid annually | Buy nowBuy now | Enough to monitor multiple aspects of 50 devices | ||
| PRTG 1000 | $358 | per month paid annually | Buy nowBuy now | Enough to monitor multiple aspects of 100 devices | ||
| PRTG 2500 | $742 | per month paid annually | Buy nowBuy now | Enough to monitor multiple aspects of 250 devices | ||
| PRTG 5000 | $1,300 | per month paid annually | Buy nowBuy now | Enough to monitor multiple aspects of 500 devices | ||
| PRTG 10000 | $1,642 | per month paid annually | Buy nowBuy now | Enough to monitor multiple aspects of 1000 devices |

Uptime monitoring checks whether a server or service responds. Website availability monitoring goes further: it tracks whether the page actually works, how fast it loads, whether the SSL certificate is valid, and whether the site is reachable from different geographic locations. Uptime is one metric. Website availability is the full picture.
When you check availability from inside your own network, you're confirming that your server responds to your own infrastructure. External users reach your site through DNS resolution, public routing, and potentially CDN edge nodes, none of which your internal checks cover. External monitoring runs uptime checks from locations outside your network and tells you what users outside your building actually see. PRTG's Cloud sensors do this in real time from 5 locations across 4 continents, with no additional external infrastructure to maintain.
Yes, if it checks more than just the response code. A basic uptime check stops at "did the server respond?" That's where false positives come from. PRTG's HTTP Advanced sensor checks the actual page source for content you define. If the expected content is missing, it alerts regardless of what the response code says. That's how you catch broken deployments and application errors that a response-code-only check would miss entirely.
No. Synthetic monitoring simulates scripted user journeys through a browser; real user monitoring (RUM) collects data from actual browser sessions. PRTG does neither. What it does is active HTTP checking: it requests the URL, measures loading time, checks the response code, and with the HTTP Advanced sensor, verifies page content. If your requirement is full synthetic transaction testing or browser-side RUM, PRTG isn't the right fit for that. For availability, response time, and content integrity checks, it covers what most infrastructure teams actually need.
PRTG can make HTTP/HTTPS requests to any reachable endpoint, including REST APIs. The HTTP v2 and HTTP Advanced sensors work with API endpoints the same way they work with web pages, checking reachability, response codes, and loading times. For JSON or XML responses, the HTTP Data Advanced sensor can parse and extract specific values. Third-party providers and external dependencies can be monitored this way as long as they expose an HTTP endpoint.
Standalone uptime tools tell you whether a URL responds. PRTG is a broader infrastructure monitoring platform that includes website monitoring as part of a larger set of capabilities. The practical difference shows up when something breaks: in PRTG, you can check the HTTP response, the web server's CPU and memory, DNS resolution, and TCP port availability from the same interface. You're not limited to knowing something is down. You have more context for understanding why. Pricing is sensor-based, so you pay for what you monitor. No credit card is required to try it.
PRTG stores historical availability data and includes built-in reporting. You can generate reports on sensor status, uptime, and performance metrics over custom time ranges, which works well for internal visibility and team reporting. For formal SLA documentation with defined SLA parameters, compliance tracking, and dedicated SLA dashboards, the PRTG SLA Reporter is a separate component built specifically for that. It connects to PRTG data and gives you the structure needed for customer-facing or compliance-grade SLA reporting.
Network Monitoring Software – Version 26.3.124.1727 (September 16, 2026)
Download for Windows and cloud-based version PRTG Hosted Monitor available
English, German, Spanish, French, Portuguese, Dutch, Russian, Japanese, and Simplified Chinese
Network devices, bandwidth, servers, applications, virtual environments, remote systems, IoT, and more
Choose the PRTG Network Monitor subscription that's best for you



