• Company
    • About Us
    • Case Studies
    • Press Center
    • Careers
    • Blog
    • Contact us
  • Contact us
  • Login
 
  • English
    • Deutsch
    • Español
    • Français
    • Italiano
    • Português
Paessler
                    - The Monitoring Experts
  • Products
    • Paessler PRTG
      Paessler PRTGMonitor your whole IT infrastructure
      • PRTG Network Monitor
      • PRTG Enterprise Monitor
      • PRTG Hosted Monitor
      • PRTG UVexplorer
      • PRTG extensionsExtensions for Paessler PRTGExtend your monitoring to a new level
    • Icon Features
      FeaturesExplore all monitoring features
      • Maps & dashboards
      • Alerts & notifications
      • Multiple user interfaces
      • Distributed monitoring
      • Customizable reporting
  • Solutions
    • Industries
      IndustriesMonitor various industry sectors
      • Industrial
      • Healthcare
      • Data Center
      • Education
      • Finance
      • Government
    • IT Topics
      IT TopicsMonitor all areas of IT
      • Network Monitoring
      • Bandwidth Monitoring
      • SNMP Monitor
      • Network Mapping
      • WiFi Monitoring
      • Server Monitoring
  • Pricing
  • Resources
    • Getting Started
      Getting StartedModules for self-paced learning
    • How-to Guides
      How-to GuidesGet the most out of PRTG
    • Videos & Webinars
      Videos & WebinarsLearn from Paessler experts
    • IT  Knowledge
      IT KnowledgeExpand your IT knowledge
    • PRTG Manual
      PRTG ManualFull documentation
    • Knowledge Base
      Knowledge BaseShare community knowledge
    • PRTG Sensor Hub
      PRTG Sensor HubGet sensors, scripts & templates
    • Trainings
      PRTG TrainingLearn how to work with PRTG
  • Partners
    • Icon Handshake
      Become a PartnerFor resellers and channel partners
    • Icon MSP
      Become an MSPDeliver monitoring as a managed service
    • icon partner
      Partner PortalLog in to your partner account
    • Deal Registration
      Deal RegistrationRegister your sales opportunities
    • icon search
      Find a PartnerFind partners selling Paessler products
    • icon technology
      Technology AlliancesSee Paessler technology partnerships
    • Partner HubTools for Your Success
  • Company
    • About Us
    • Case Studies
    • Press Center
    • Careers
    • Blog
    • Contact us
  • Contact us
  • Login
  • English
    • Deutsch
    • Español
    • Français
    • Italiano
    • Português
  • Get a quote
  • Free trial

Reliable Network Speed Monitoring

Continuous throughput data across every interface, so slow network complaints come with facts, not guesswork. 

Free download
PRODUCT OVERVIEW

How Does Continuous Network Speed Monitoring Work?  

A one-off internet speed test gives you a snapshot. Download speed, upload speed, latency at that moment. Useful for a sanity check, not much else. It won't tell you which router interface is consistently saturated, or whether jitter has been affecting VoIP quality throughout the day. Continuous network speed monitoring tracks throughput, latency, packet loss, jitter, and bandwidth usage across every interface, automatically, at defined intervals, with every data point stored. Which protocol it uses depends on the device and what needs measuring: SNMP, flow protocols, WMI, ICMP, or HTTP. 

Paessler PRTG covers this across Cisco routers, HPE switches, Windows servers, Linux hosts, Wi-Fi access points, WAN/ADSL links, and NetFlow/jFlow/IPFIX/sFlow-capable devices. All of that lands in one monitoring view, with consistent alerting, historical data, and reporting across every interface and protocol. 

Download PRTG Trial

What you will find on this page

  • Benefits of Network Speed Monitoring
  • How PRTG Monitors Network Speed
  • Manual Speed Checks vs. PRTG
  • FAQs

PRTG is compatible with all major vendors, products, and systems

compatible with all major vendors, products, and systems

What PRTG Gives You for Network Speed Monitoring

Per-Interface Visibility Across Your Entire Network

When someone reports slow network performance, the first question is which device, which port, how much. Without per-interface data you're guessing, and manual checks per device don't scale. PRTG monitors individual switch ports, router interfaces, and server NICs separately. Auto-discovery scans your network and creates sensors for detected devices and interfaces without manual setup, and all traffic data (incoming, outgoing, errors, and discards) is stored per interface at every scanning interval, across multi-vendor environments including Cisco, HPE, and Dell, in the same monitoring view.

  • Per-port throughput tracked as total, incoming, and outgoing traffic separately, which matters when a port is saturated in one direction only
  • Error and discard counters per interface. Catches degraded links before they become user complaints
  • Auto-discovery scans your network and creates sensors for detected devices and interfaces, with no need to configure each one manually
  • Works across switches, routers, and server NICs in a single monitoring view
  • Supports multi-vendor environments: Cisco, HPE, Dell, and others

Continuous Measurement With Instant Alerts

Intermittent degradation is the hardest problem to pin down: peak-hour congestion, a link that saturates during overnight backups, a port that degrades and recovers before anyone notices. And the complaint itself is already delayed. Someone tolerates degraded performance for a while before reporting it, so the event you're trying to reconstruct may be hours old before you even know to look. PRTG stores every data point at configurable scanning intervals, down to 30 seconds for critical links. Threshold-based alerts send notifications via email, SMS, and push (including through PRTG's mobile apps for iOS and Android), and historical graphs let you reconstruct any performance event with exact timestamps, hours or weeks after it happened. 
  • Scanning intervals configurable down to 30 seconds for critical links
  • Separate warning and error thresholds per interface or sensor, not one-size-fits-all
  • Notifications via email, SMS, and push, including mobile apps for iOS and Android
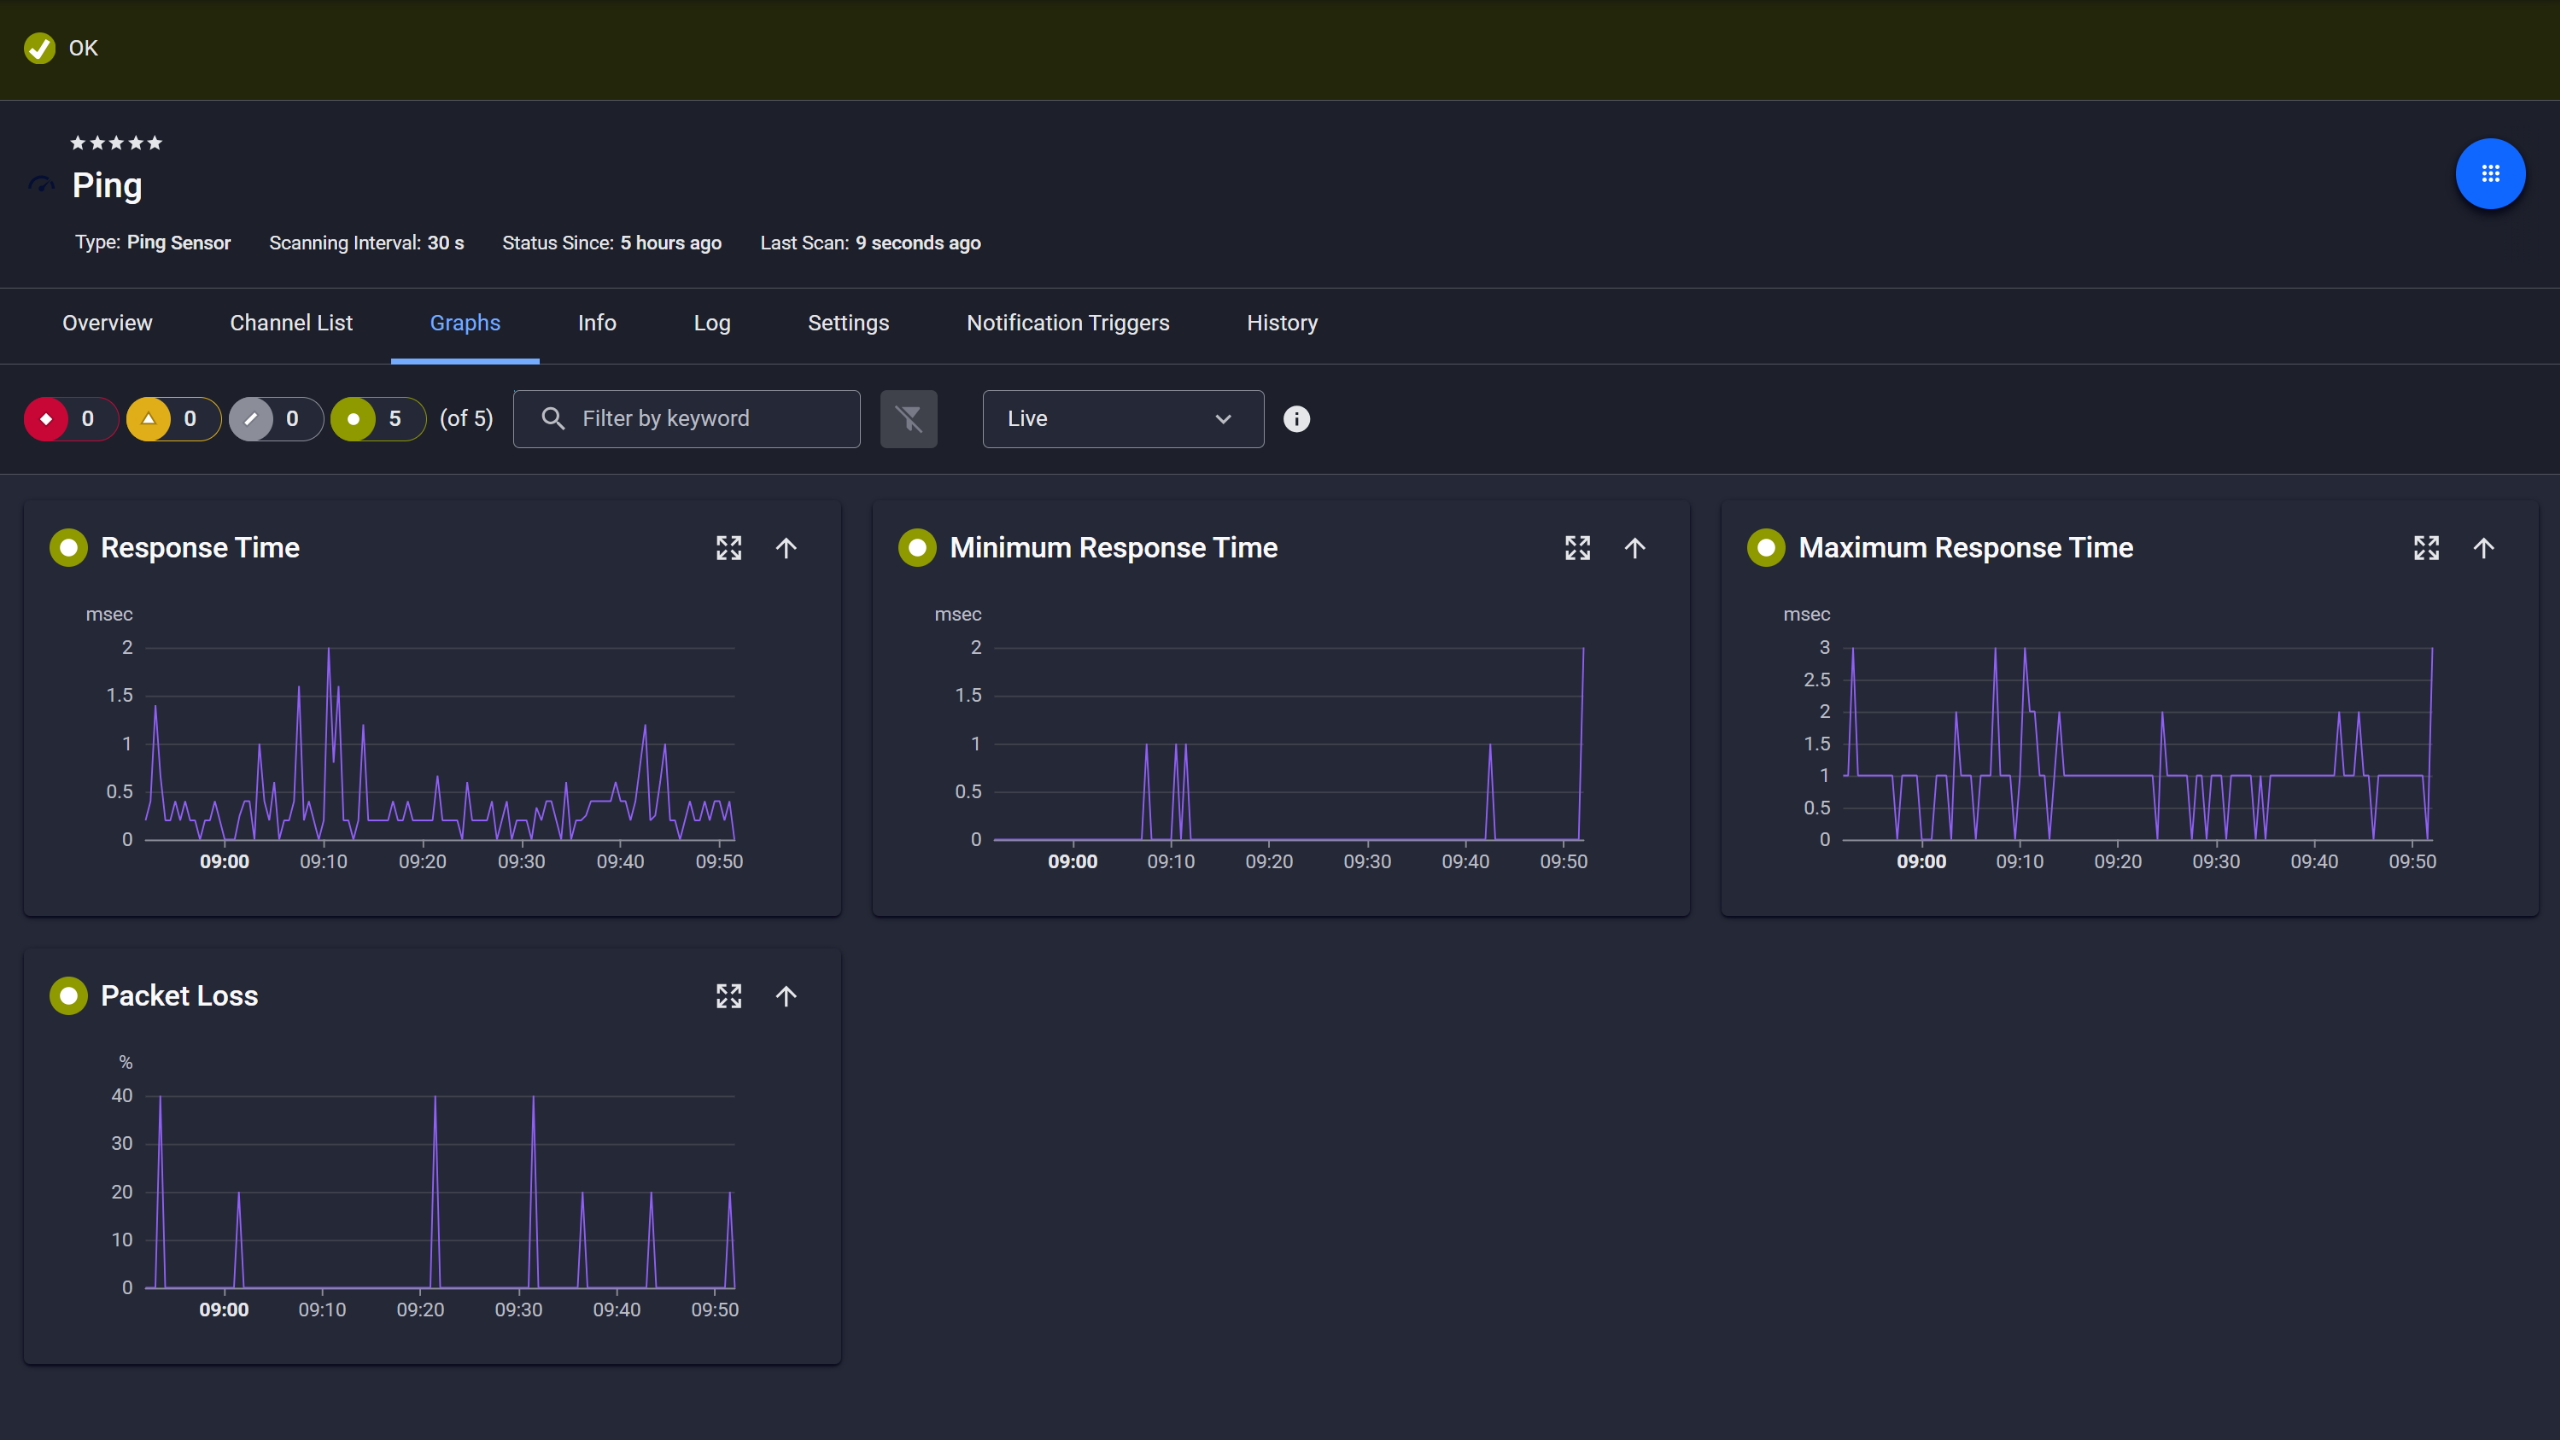
  • Historical graphs showing spike duration, frequency, and magnitude
  • Long-term data retention for trend analysis
PRTG Ping sensor graphs showing response time, min, max, and packet loss over time

Ping response and packet loss

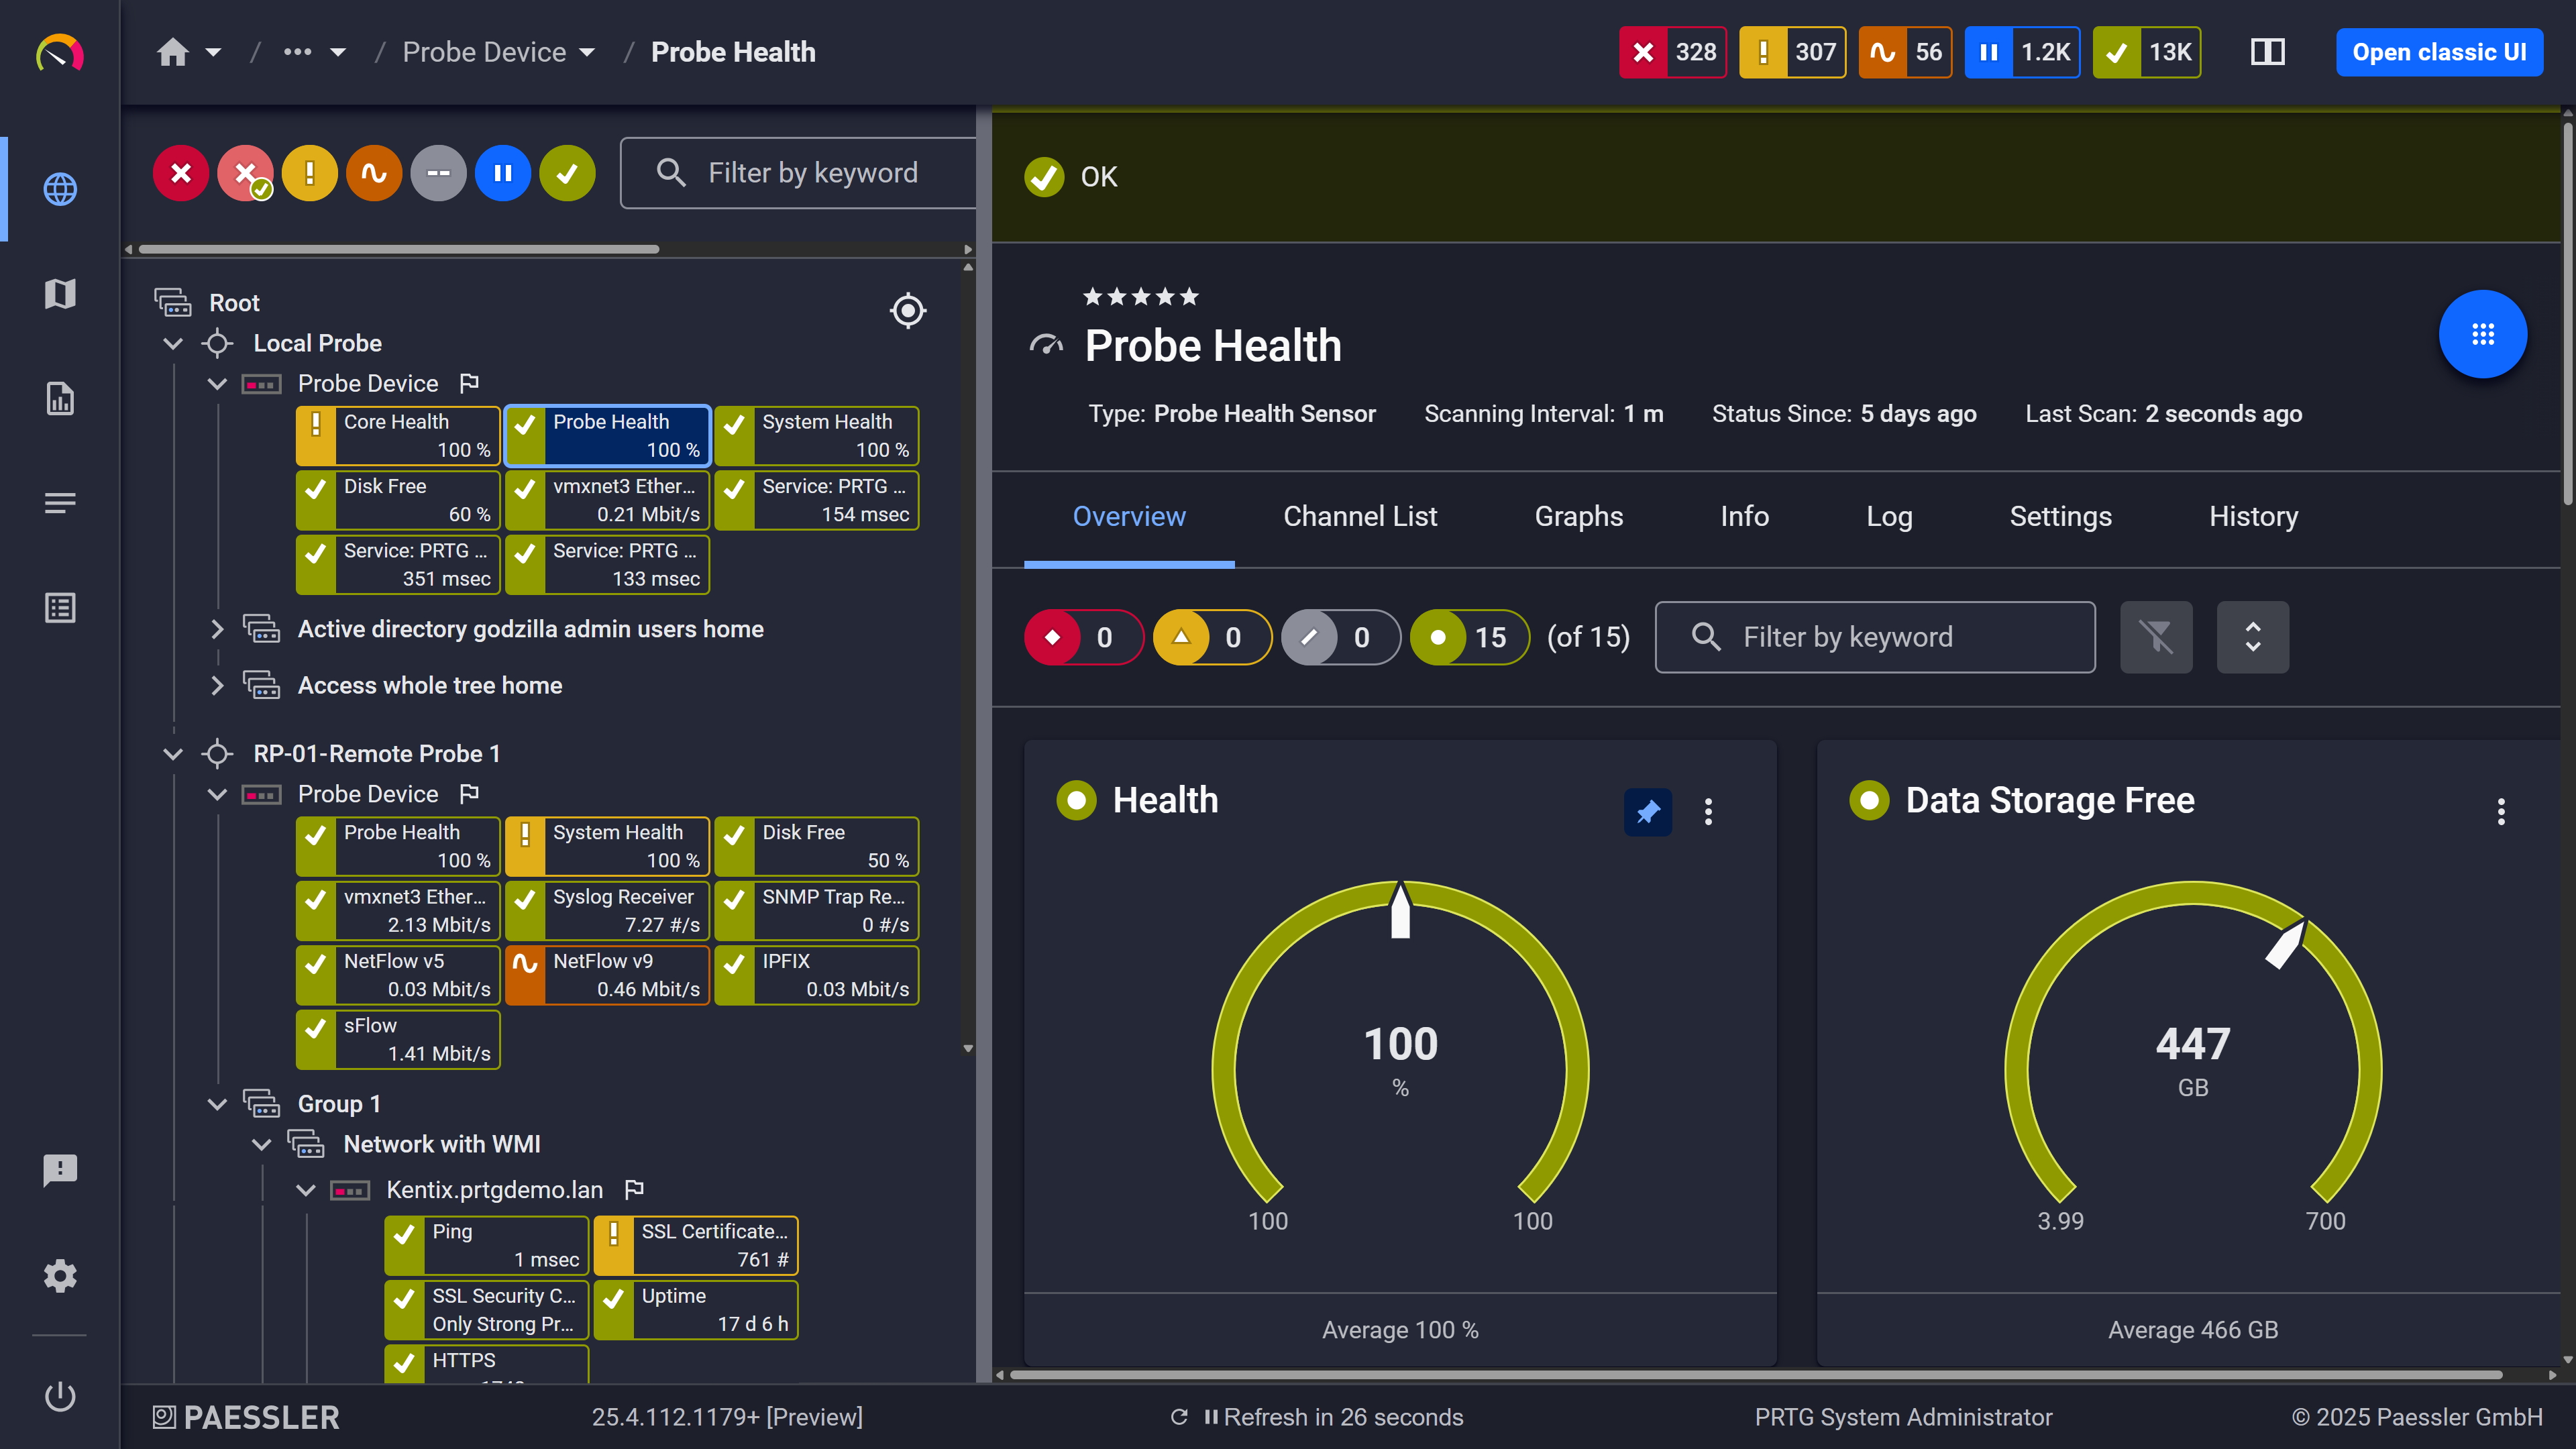
PRTG web interface showing live performance graphs for a Probe Health sensor

Live graphs, real-time performance data
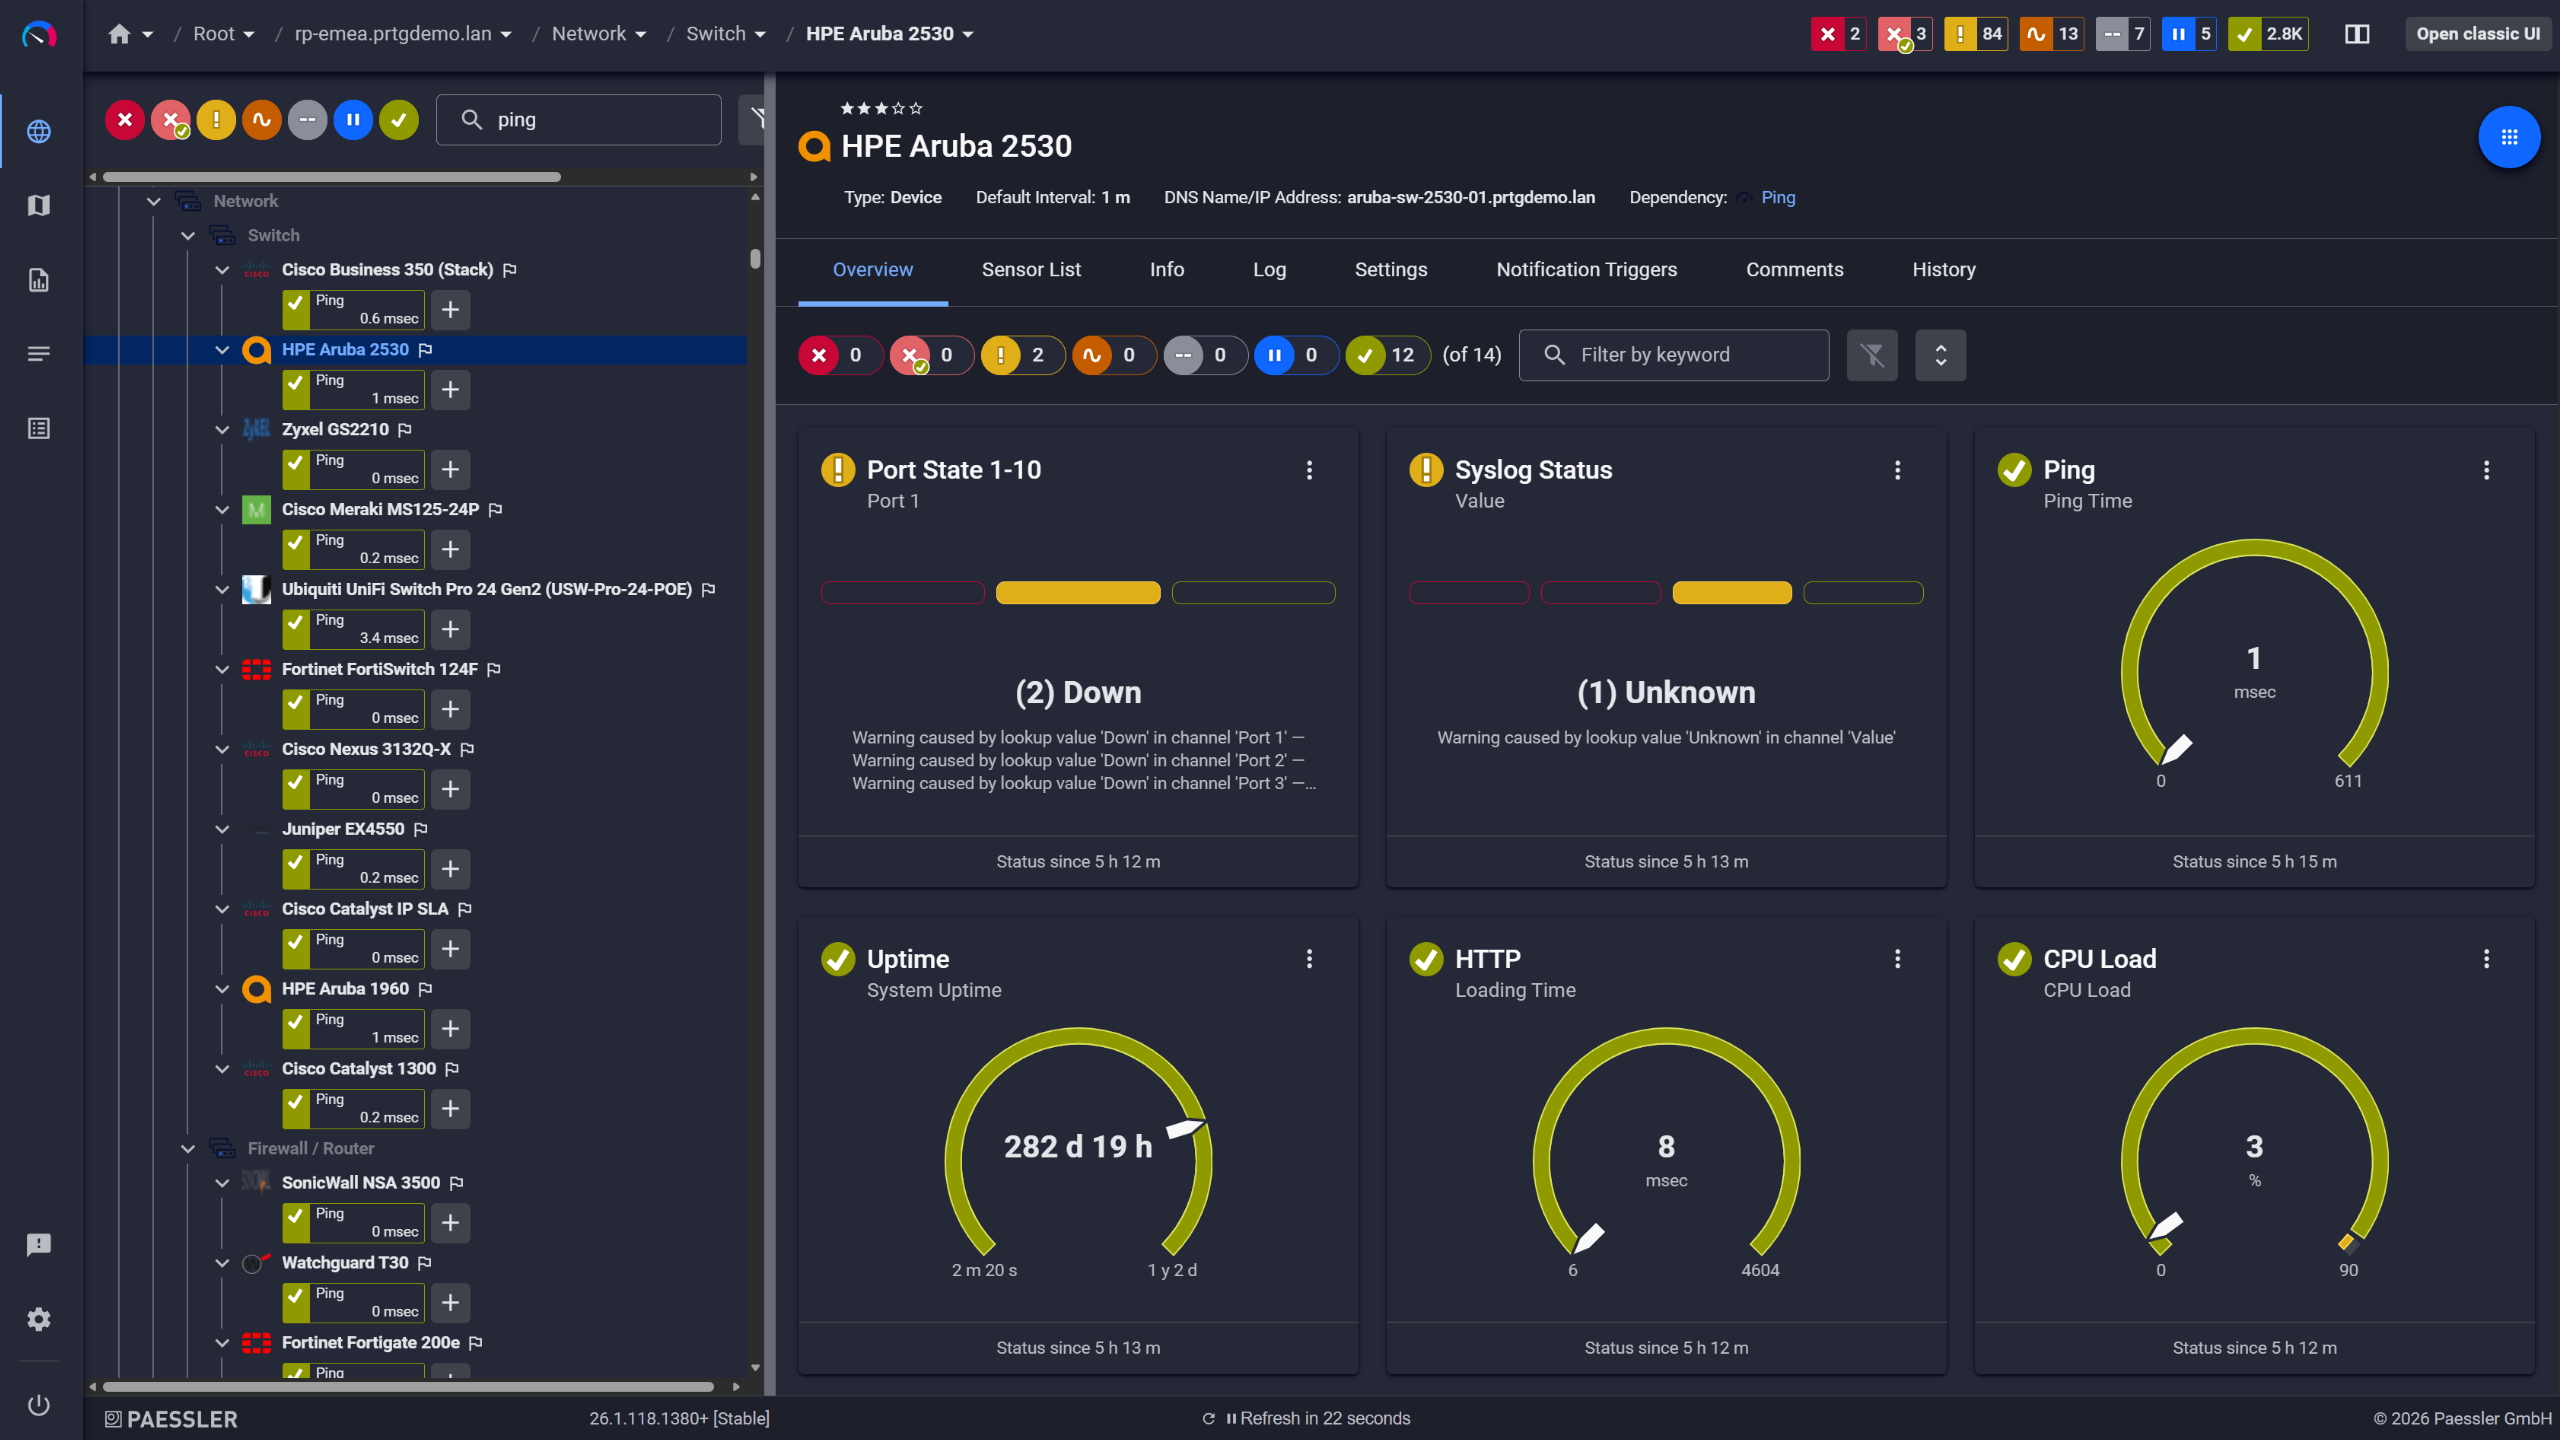
PRTG device overview for an HPE Aruba 2530 switch with port state, ping, and CPU sensors

Network switches monitored across vendors

Know Whether It's Your ISP or Your Own Infrastructure

Slow internet connection? Before calling your internet service provider, you need data on both sides of the problem. Without simultaneous visibility into your WAN port and internal uplinks, every ISP conversation is based on assumptions. PRTG monitors WAN and LAN interfaces side by side in the same dashboard, and flow data adds a traffic composition layer surfacing Top Talkers, Top Connections, and Top Protocols on the link. The standard Ping sensor tracks latency and packet loss toward external targets; the Ping Jitter sensor is a separate, dedicated sensor for jitter on latency-sensitive traffic like VoIP. When you need to escalate, the data is already there.

  • WAN and LAN interfaces visible in the same dashboard
  • Flow data reveals Top Talkers, Top Connections, and Top Protocols on the link
  • Standard Ping sensor: continuous round-trip time and packet loss measurement to any IP address
  • Ping Jitter sensor: dedicated jitter measurement, a separate sensor distinct from the standard Ping sensor, not a channel of it
  • Historical data gives you evidence, not anecdote, for ISP discussions

See Why IT Professionals Trust PRTG

Start monitoring your infrastructure in minutes. No professional services, no complex configuration, no risk.

Free download
PRODUCT OVERVIEW

Turn Performance Data Into Evidence

Every conversation about upgrading a link or pushing back on an ISP comes down to documentation. Without stored metrics, you're making a case based on memory and user complaints, and neither holds up well in those discussions. PRTG retains historical throughput data and generates reports across any time range, interface group, or site, schedulable for automatic delivery. Whether you need a WAN utilization graph for a management discussion or raw numbers for capacity planning, the data is already collected and ready to export.

  • Historical throughput reports by interface, device group, or site
  • Configurable report scheduling with automatic delivery on a set cadence
  • Data export for use in presentations or external analysis
  • Covers WAN links, internal uplinks, and server NICs in one report
  • Long-term trend data for network optimization and capacity planning
PRTG reports list showing scheduled monitoring reports with run times and sensor counts

Scheduled reports, always on time

PRTG web interface showing device tree and full device list with sensor status badges

Full device list, instant overview

PRTG web interface showing Probe Health sensor with health and storage gauge widgets

Probe health at a glance

How PRTG Monitors Network Speed 

PRTG uses different methods depending on the device and what needs to be measured. No single protocol gives the full picture, so the approach varies by layer.

SNMP Traffic Monitoring

Per-interface polling on switches and routers via SNMP v1, v2c, or v3. The SNMP Traffic sensor measures total, incoming, and outgoing traffic; unicast, non-unicast, broadcast, and multicast packets; errors and discards per port. Traffic In, Traffic Out, and Traffic Total channels are included by default, with additional channels selectable per interface. 

Worth noting: An SNMP Traffic v2 sensor also exists as a beta variant with extended capabilities. Its operating methods and settings are still subject to change.

Windows NIC Monitoring

The Windows Network Card sensor handles NIC-level monitoring on Windows servers and workstations. It uses WMI or Windows performance counters, whichever is configured in PRTG's Windows Compatibility Options for the parent device. This collects traffic totals, packet counts by type, and error rates per network interface card.

Flow Protocol Monitoring

Flow monitoring works differently from SNMP polling. The source device pushes flow records to PRTG rather than PRTG scanning for them. This means the router or switch needs to be configured to export flow data to PRTG's IP and port. That's device-side configuration, not something PRTG sets up automatically. 

PRTG supports NetFlow, jFlow, sFlow, and IPFIX. Basic sensor variants come with predefined channel definitions; custom variants let you filter for specific network traffic. Toplist functionality surfaces Top Talkers, Top Connections, and Top Protocols per flow sensor.

Ping and HTTP

Three distinct sensors for measuring external connection quality and internet speed:  

  • Standard Ping sensor: Continuous round-trip time and packet loss measurement to any IP address, internal or external.
  • Ping Jitter sensor: Sends a series of ICMP echo requests to calculate statistical jitter. This is a dedicated sensor, separate from the standard Ping sensor. Not a channel of it.
  • HTTP Advanced sensor: Measures bytes received, download speed in kbps, loading time, and time-to-first-byte against web endpoints. Runs at configurable intervals to build a picture of available throughput. Gives a strong indication of transmission speed, not a guaranteed absolute measurement.

Packet Sniffing

A fallback method for devices without SNMP or flow export support. PRTG's Packet Sniffer sensor analyzes traffic passing through a network interface and can break it down by protocol and IP address, useful in environments with legacy hardware that doesn't support flow protocols. Note that packet sniffing requires the monitoring probe to have visibility into the traffic on the target interface (e.g., via a switch mirror/SPAN port).

free downLoad

Manual Network Speed Checks vs. Monitoring with PRTG

FEATURE

Without PRTG

Without PRTG

With PRTG

With PRTG

Interface speed data

Without PRTG
not included

Run a tool per device, when you remember

With PRTG
included

Per-interface, stored automatically at every scanning interval

Catching intermittent issues

Without PRTG
not included

Luck, or a user complaint

With PRTG
included

Threshold-based alert triggers the moment utilization spikes

WAN vs. internal isolation

Without PRTG
not included

Compare separate tools manually

With PRTG
included

Same dashboard, simultaneous data across all interfaces

ISP and management reporting

Without PRTG
not included

Reconstruct from memory

With PRTG
included

Historical report generated from stored sensor data

Traffic breakdown by protocol or IP

Without PRTG
not included

Separate flow analyzer required

With PRTG
included

Built-in via NetFlow/jFlow/sFlow/IPFIX sensors, though device-side export configuration is required

Open-source alternatives

Without PRTG
not included

Steep configuration overhead and ongoing maintenance 

With PRTG
included

SNMP-based monitoring in PRTG is up and running in minutes; flow monitoring requires device-side export setup either way 

free downLoad

“PRTG helps us to keep control of our IT by making issues visible immediately – and everywhere. We always have an eye on the performance and availability of our IT and can react in time if any failures occur. On a long-term perspective, the monitoring data helps us with capacity planning so that we can deliver the required resources for our own systems as well as for our customers, without wasting money on unwarranted redundancies.”

Stein Erik Høybakk, Senior Network Engineer
TAFJORD

“All our production and business processes depend on SAP. But, of course, IT and production systems also play a crucial role in securing these processes. By incorporating SAP, production, and IT into one centralized monitoring system, we can quickly detect critical drops in performance and identify the causes of these issues. In fact, thanks to PRTG and itesys, this couldn’t be any easier.”

Andreas Schmidt, Senior Systems Engineer
Truma

“Any downtime could be detrimental to our customers. We also strive to provide the best possible service to our customers. PRTG allows us to see the health and performance of the network. Using these measurements we can make decisions on how to repair a piece of equipment before it fails and causes a service interruption.”

James Ott Jr., Communications System Technician and IT Administrator
Federal Radio

Paessler PRTG Network Monitor licenses & pricing

Choose the PRTG Network Monitor subscription that's best for you.

License NameLicense descriptionPriceLicense DetailsGet startedPricing Details
PRTG 500$200per month paid annuallyBuy nowBuy now

Enough to monitor multiple aspects of 50 devices

PRTG 1000$358per month paid annuallyBuy nowBuy now

Enough to monitor multiple aspects of 100 devices

PRTG 2500$742per month paid annuallyBuy nowBuy now

Enough to monitor multiple aspects of 250 devices

PRTG 5000$1,300per month paid annuallyBuy nowBuy now

Enough to monitor multiple aspects of 500 devices

PRTG 10000$1,642per month paid annuallyBuy nowBuy now

Enough to monitor multiple aspects of 1000 devices

Over 100,000 Customers Worldwide Love Paessler  

customer success stories

 Network Speed Monitoring: Frequently Asked Questions


What's the difference between a network speed test and network speed monitoring?

A speed test gives you a number at one point in time. Network speed monitoring runs continuously, stores every measurement, and tracks changes across time. So when bandwidth usage spiked earlier this week, or a specific interface keeps hitting its limit during business hours, you have an actual record to look at rather than asking people what they noticed.

What metrics does continuous network speed monitoring actually track?

The core ones are throughput per interface, tracked as incoming and outgoing separately, plus latency, packet loss, jitter, errors, and discards. If the device exports flow data, you also get traffic composition: Top Talkers, Top Connections, and Top Protocols on the link via NetFlow, jFlow, sFlow, or IPFIX. Together those give you a complete picture of what's happening on the network, not just raw speed numbers.

Can I use network speed monitoring to troubleshoot whether a problem is with my ISP?

Yes, and it's one of the cleaner use cases. With simultaneous data on your WAN interface and your internal uplinks, you can see whether degradation started on your side or theirs. Latency and packet loss toward external IP addresses, combined with internal traffic data, gives you something concrete before you make that call. ISPs respond differently when you arrive with timestamps.

How often should network speed be checked for meaningful data?

Depends on what you're trying to catch. For critical WAN links where intermittent issues matter, 30-second scanning intervals give you granular data. For less critical infrastructure, longer intervals are fine. Shorter intervals mean faster detection and more precise timestamps, but also more load on the monitoring system. There's a practical balance to find, and it's usually not the same answer for every link on your network.

Does network speed monitoring work for Wi-Fi connections, or only wired?

PRTG can monitor Wi-Fi access points via SNMP, tracking traffic throughput, error rates, and connected client counts per access point. It doesn't do RF-layer analysis: signal strength heatmaps, channel utilization, that kind of thing. For traffic-level visibility on wireless infrastructure though, SNMP monitoring works the same way as on wired switches.

Does PRTG run on Windows only, or does it support Linux and other platforms?

The PRTG Network Monitor server itself requires a Windows host. Linux systems are monitored as targets via SNMP, SSH, and other methods, but Linux isn't a supported host platform for the PRTG core server. If a local Windows server isn't an option, PRTG Hosted Monitor is the cloud-based alternative. Paessler manages the server infrastructure, and you get the same monitoring functionality without the local setup.

What's the difference between bandwidth and throughput in network monitoring?

Bandwidth is the ceiling, and the maximum capacity of a link. Throughput is what's actually crossing it at a given moment. Monitoring throughput in Mbps tells you how much of that capacity is in use and whether you're consistently approaching the limit. The gap between the two is typically where capacity planning decisions start.

Paessler PRTG

Paessler PRTG

Network Monitoring Software – Version 26.1.116.1532 (February 9th, 2026)

Hosting icon

Hosting

Download for Windows and cloud-based version PRTG Hosted Monitor available

Languages icon

Languages

English, German, Spanish, French, Portuguese, Dutch, Russian, Japanese, and Simplified Chinese

test

Monitor everything

Network devices, bandwidth, servers, applications, virtual environments, remote systems, IoT, and more

test

Pricing

Choose the PRTG Network Monitor subscription that's best for you

Discover more monitoring insights and stories

Content illustration

Powerful stories from the monitoring world

  • Video: Making the lives of sysadmins easier
  • Video: Quick overview of PRTG
  • Sending Notifications Via Microsoft Teams
Support illustration

Resources to master your monitoring challenges

  • Monitoring upload and download speed
  • how to see Port Speed on switches?
  • PRTG Manual: Available Sensor Types - Paessler
Solution illustration

Solutions for all your monitoring needs

  • Network Speed Monitoring
  • Bandwidth Monitoring
  • Network Throughput Monitoring
PRTG Logo

Start Monitoring with PRTG and see how it can make your network more reliable and your job easier.

Free download
PRODUCT OVERVIEW

Products

  • Paessler PRTG
    Paessler PRTGMonitor your whole IT infrastructure
    • PRTG Network Monitor
    • PRTG Enterprise Monitor
    • PRTG Hosted Monitor
    • PRTG UVexplorer
    • PRTG extensions
      Extensions for Paessler PRTGExtend your monitoring to a new level
  • Icon Features
    FeaturesExplore all monitoring features

Monitoring with PRTG

  • Network monitoring
  • Bandwidth monitoring
  • SNMP monitoring
  • Network mapping
  • Wi-Fi monitoring
  • Server monitoring
  • Network traffic analyzer
  • NetFlow monitoring
  • Syslog server

Useful Links

  • PRTG Manual
  • Knowledge Base
  • Customer Success Stories
  • About Paessler
  • Subscribe to newsletter
  • PRTG Support
  • PRTG Consulting
  • PRTG Feedback & Roadmap

Contact

Paessler GmbH
Thurn-und-Taxis-Str. 14, 
90411 Nuremberg 
Germany

[email protected]

+49 911 93775-0

  • Contact us
©2026 Paessler GmbHTerms & ConditionsPrivacy PolicyImprintReport VulnerabilityDownload & InstallSitemap
PRTG Support PRTG Support PRTG Support