Custom alerts and data visualization let you quickly identify and prevent issues with content delivery networks.
Efficient content delivery is crucial for maintaining high performance and the best possible online experience for your end users across your network. Paessler PRTG's CDN monitoring tools are your 24/7 partners in ensuring that your Content Delivery Network operates flawlessly every day of the year.
Identify slow and failing components faster than you can say “content delivery.” PRTG keeps an eye on load balance and checks regional traffic for stability, uptime, speed, and bandwidth consumption.
Find out how data traffic is structured in your CDN to develop appropriate solutions for content, referencing, and expansion. Stay on top of data flow and user interactions, and spot inefficiencies or disruptions that could impact user experience.
Set up customized monitoring that adapts to the unique needs of your network with PRTG's many configuration options.
Adjust thresholds and notification triggers easily and make sure you're the first to know when there are performance issues or potential threats to your CDN's integrity – such as anomalies in the CDN log or unusual fluctuations in traffic.
Say goodbye to juggling multiple tools and dealing with compatibility headaches. PRTG’s comprehensive monitoring solution brings everything under one roof, making it easier to manage.
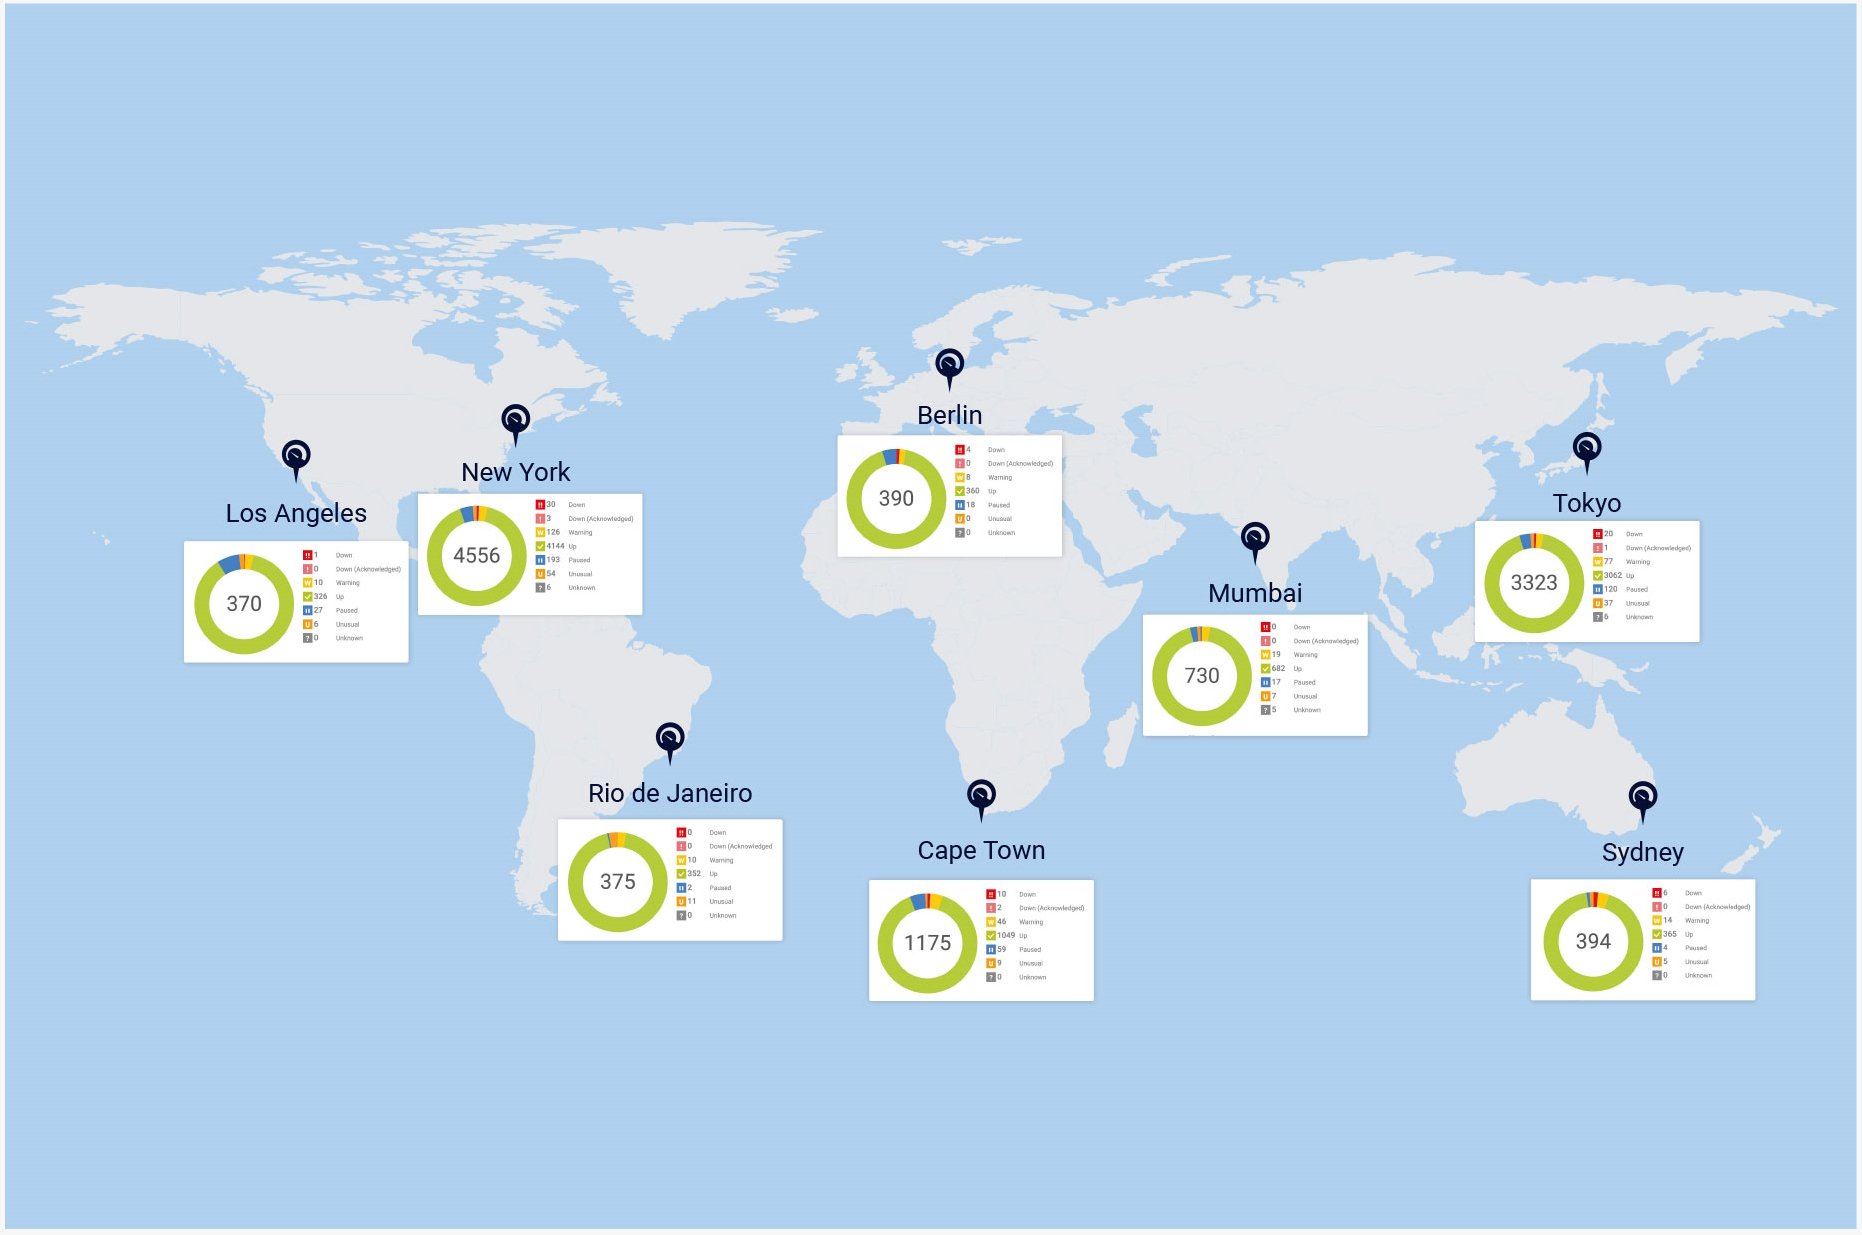
Optimize, for example, search engine referencing by monitoring CDN hits according to node, country, and region, and ensure an acceptable website performance and up-to-date content in all locations.
Diagnose network issues by continuously tracking and debugging your Content Delivery Network. Show data transfer, response time, content errors, CDN server health, web application availability, and other key metrics in real time. Visualize monitoring data in clear graphs and dashboards to identify problems more easily. Gain the visibility you need to troubleshoot issues like bandwidth bottlenecks, CDN-related network attacks, low performance, or even full outages.
Distributed PRTG monitoring

Device tree view of the complete monitoring setup

Custom PRTG dashboard for keeping an eye on the entire IT infrastructure

Live traffic data graph in PRTG
“All-around winning
network monitor”
“The real beauty of PRTG is the endless possibilities it offers”
“PRTG Network Monitor
is very hard to beat”
Keep a pulse on your CDN’s operational status. Monitor the intricacies of your CDN infrastructure, from replica servers to caching behaviors and content delivery protocols, and ensure smooth and efficient content distribution to your global audience.
Gain valuable insights into CDN performance with detailed metrics on cache hit ratios, origin fetch rates, and CDN throughput. Use this data to refine content caching strategies and improve data delivery efficiency, reduce latency, and enhance user experience.
Customize your CDN monitoring approach to focus on critical metrics such as edge server responsiveness, data transfer rates, and geographic load distribution. This targeted monitoring helps fine-tune your CDN configuration for an optimal performance across complex network conditions.
PRTG comes with more than 250 native sensor types for monitoring your entire on-premises, cloud, and hybrid cloud environment out of the box. Check out some examples below!
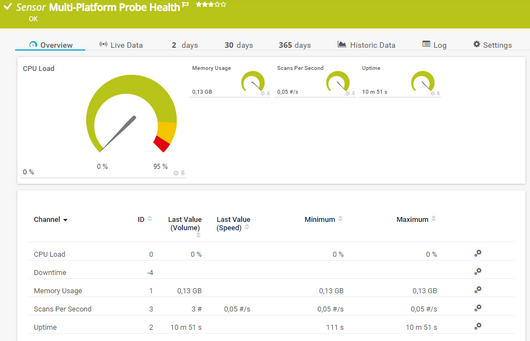
The Probe Health sensor monitors the status of the probe system. It can show the following and more:
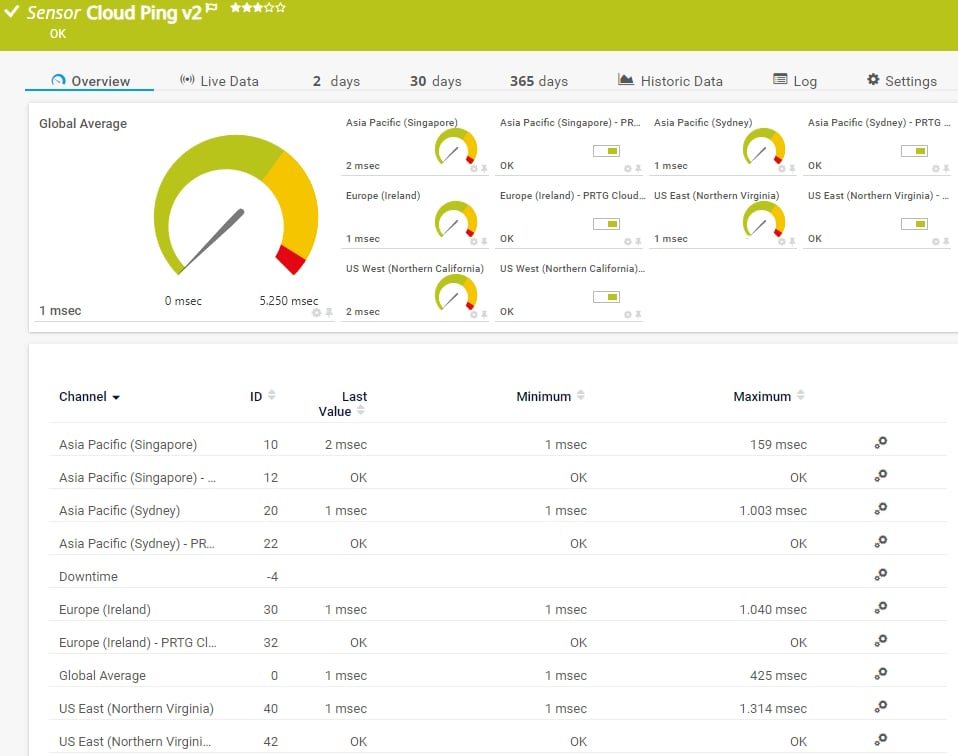
The Cloud Ping v2 sensor monitors the Transmission Control Protocol (TCP) ping times to its parent device from different locations worldwide (Asia Pacific: Singapore, Asia Pacific: Sydney, Europe: Ireland, US East: Northern Virginia, US West: Northern California) via the PRTG Cloud. It can show the following:
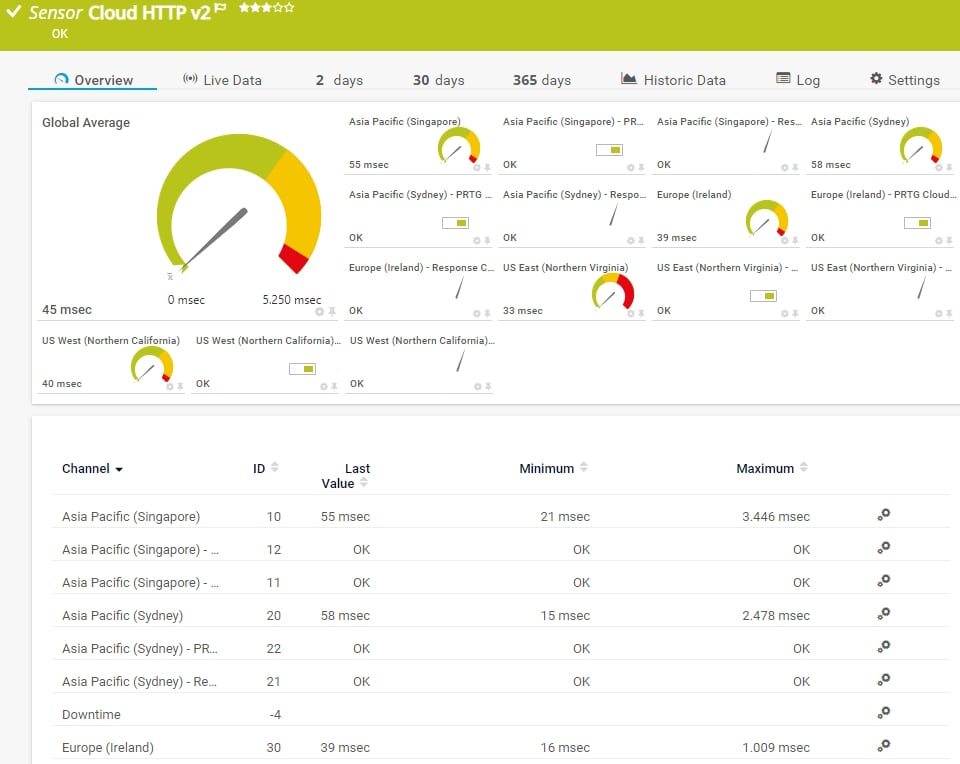
The Cloud HTTP v2 sensor monitors the loading time of a web server via HTTP from different locations worldwide (Asia Pacific: Singapore, Asia Pacific: Sydney, Europe: Ireland, US East: Northern Virginia, US West: Northern California) via the PRTG Cloud. It can show the following:
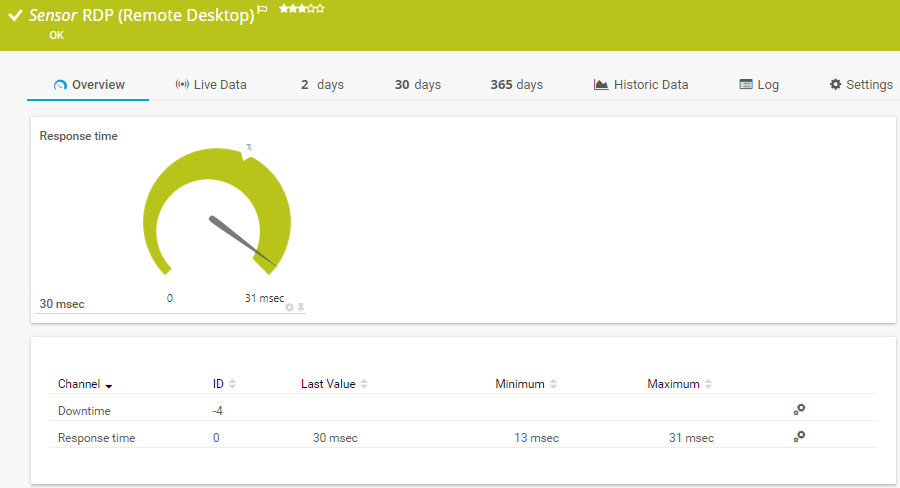
The RDP (Remote Desktop) sensor monitors remote desktop services such as Remote Desktop Protocol (RDP) or Terminal Services Client. It can show the following:
See the PRTG Manual for a list of all available sensor types.

Real-time notifications mean faster troubleshooting so that you can act before more serious issues occur.
Set up PRTG in minutes and use it on almost any mobile device.

Partnering with innovative IT vendors, Paessler unleashes synergies to create
new and additional benefits for joined customers.
Paessler and Plixer provide a complete solution adding flow and metadata analysis to a powerful network monitoring tool.
IT that works constitutes a business-critical basis for a company's success. Availability and security must be defined for the respective purpose and closely monitored – by OT and IT alike.
Siemon and Paessler bring together intelligent building technology and advanced monitoring and make your vision of intelligent buildings and data centers become reality.
Custom alerts and data visualization let you quickly identify and prevent issues with content delivery networks.
Network Monitoring Software – Version 26.1.116.1532 (February 9th, 2026)
Download for Windows and cloud-based version PRTG Hosted Monitor available
English, German, Spanish, French, Portuguese, Dutch, Russian, Japanese, and Simplified Chinese
Network devices, bandwidth, servers, applications, virtual environments, remote systems, IoT, and more
Choose the PRTG Network Monitor subscription that's best for you

A Content Delivery Network (CDN) is a system of distributed servers that deliver web content to users based on their geographic location. It improves website performance metrics by caching content close to the user's location, reducing latency and load times. CDNs also enhance security by protecting against DDoS attacks and handling high traffic loads. They ensure high availability and reliability of content delivery.
PRTG can monitor almost everything you can think of in your CDN, for example:
Absolutely! PRTG provides a unified monitoring solution capable of overseeing multiple CDNs. This enables seamless performance tracking across various service providers and network nodes.
PRTG collects extensive data on your CDN's operations, from bandwidth usage to error rates, helping you fine-tune your setups for optimal performance. Use this data to adjust caching strategies, balance loads more effectively, and enhance overall delivery speed.
Opt for Paessler PRTG and ensure not just operational prowess but also a delightful experience for your users. Advance with a monitoring tool that grows with you and provides deep insights into every aspect of your content delivery network.
In PRTG, “sensors” are the basic monitoring elements. One sensor usually monitors one measured value in your network, for example the traffic of a switch port, the CPU load of a server, or the free space on a disk drive. On average, you need about 5-10 sensors per device or one sensor per switch port.
Paessler conducted trials in over 600 IT departments worldwide to tune its network monitoring software closer to the needs of sysadmins. The result of the survey: over 95% of the participants would recommend PRTG – or already have.

Paessler PRTG is used by companies of all sizes. Sysadmins love PRTG because it makes their job a whole lot easier.
Bandwidth, servers, virtual environments, websites, VoIP services – PRTG keeps an eye on your entire network.
Everyone has different monitoring needs. That’s why we let you try PRTG for free.