Custom alerts and data visualization let you quickly identify and prevent issues with the availability and performance of RESTful API connections.
PRTG’s REST API monitoring includes the following key API metrics:
PRTG comes with preconfigured REST Custom sensors that you can add with a few clicks:
Diagnose network issues by continuously tracking the availability and performance of REST API integrations. Show API response times, latency, response codes, error rates, uptime, API call validation, and other key metrics in real time. Visualize REST API monitoring data in clear graphs and dashboards to identify problems more easily. Gain the overview you need to troubleshoot outages, bottlenecks, authentication problems, and other API performance issues to optimize your network.

Device tree view of the complete monitoring setup

Custom PRTG dashboard for keeping an eye on the entire IT infrastructure

Live traffic data graph in PRTG
“All-around winning
network monitor”
“The real beauty of PRTG is the endless possibilities it offers”
“PRTG Network Monitor
is very hard to beat”
Connect your web services and cloud applications, the Internet of Things, and other endpoints via REST API to PRTG and track all the values you need to ensure a reliable and stable IT infrastructure.
Install PRTG with a few clicks, enter an IP address range, and let the automatic network discovery do the first setup for you. You can then tailor your REST API monitoring to suit and add the REST sensors you need, which will automatically read content from the XML and JSON files you provide.
Desktop, smartphone, or tablet – with PRTG, you can view everything at a glance. Check your REST values directly in the respective sensor, or create custom dashboards and maps that display data the way you want to. Our traffic light color coding immediately informs you if something’s amiss.
Define custom warning and error thresholds and PRTG will alert you via email, SMS, push notification, and more as soon as there’s unplanned downtime or any other network issue. You can even let PRTG take automatic action, for example, restarting a service or web application.
PRTG is a comprehensive tool for monitoring your entire network. You get a centralized software that monitors all your hardware, applications, network traffic, and much more. Say goodbye to stand-alone solutions which are cumbersome, prone to error, and often cost way more.
PRTG comes with more than 250 native sensor types for monitoring your entire on-premises, cloud, and hybrid cloud environment out of the box. Check out some examples below!
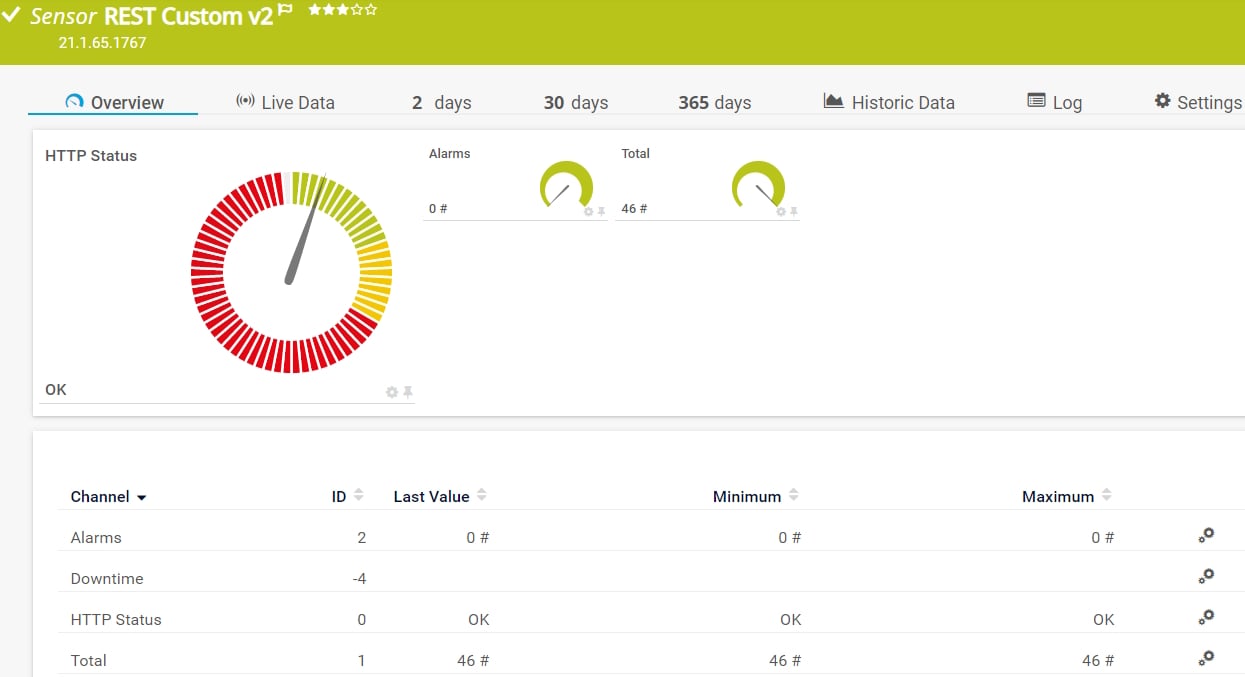
The REST Custom v2 sensor queries a REST API endpoint and maps the JSON or XML result to sensor values. It can show the following:
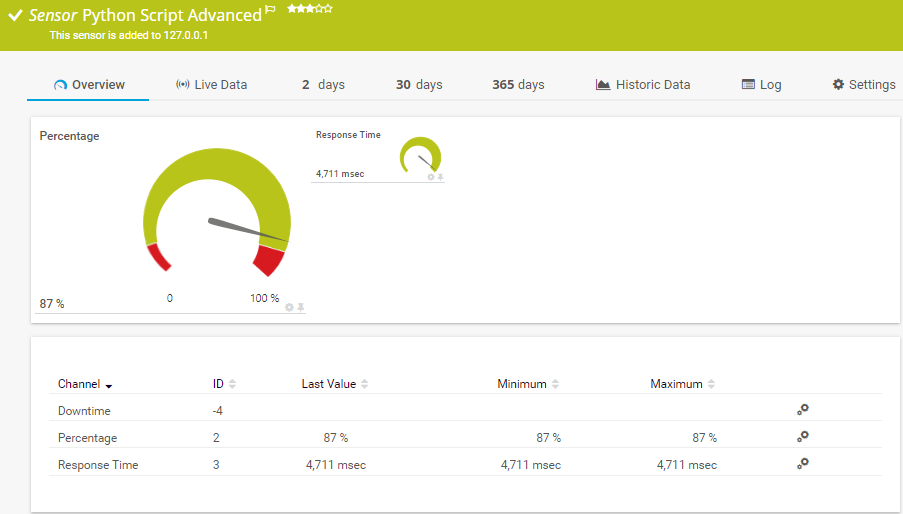
The Python Script Advanced sensor executes a Python script on the probe system. This option is available as part of the PRTG API. It can show the following:
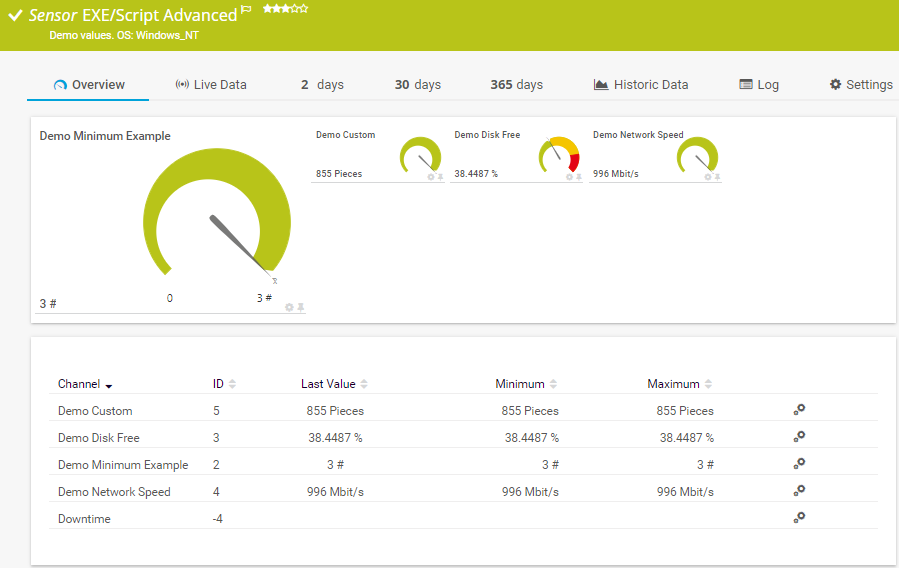
The EXE/Script Advanced sensor runs an executable file (.exe) or a script (batch file, VBScript, PowerShell) on the probe system. This option is available as part of the PRTG API. It can show the following:
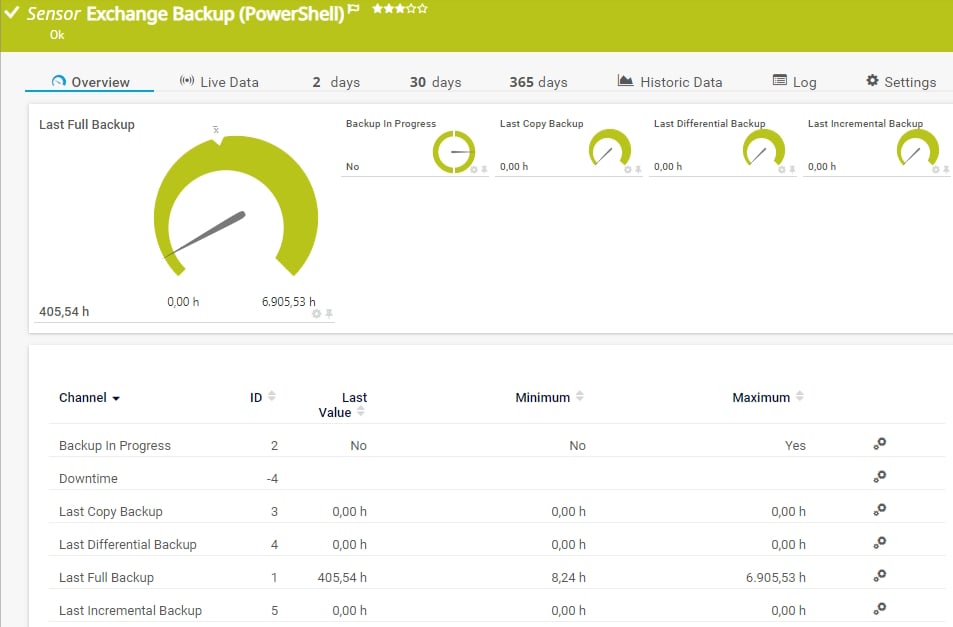
The Event Log (Windows API) sensor monitors event log entries via the Windows API. It can show the following:
See the PRTG Manual for a list of all available sensor types.

Real-time notifications mean faster troubleshooting so that you can act before more serious issues occur.
PRTG is set up in a matter of minutes and can be used on a wide variety of mobile devices.

Partnering with innovative IT vendors, Paessler unleashes synergies to create
new and additional benefits for joined customers.
baramundi and PRTG create a secure, reliable and powerful IT infrastructure where you have everything under control - from the traffic in your firewall to the configuration of your clients.
Combining PRTG’s broad monitoring feature set with IP Fabric’s automated network assurance creates a new level of network visibility and reliability.
With ScriptRunner Paessler integrates a powerful event automation platform into PRTG Network Monitor.
Custom alerts and data visualization let you quickly identify and prevent issues with the availability and performance of RESTful API connections.
Network Monitoring Software – Version 26.1.116.1532 (February 9th, 2026)
Download for Windows and cloud-based version PRTG Hosted Monitor available
English, German, Spanish, French, Portuguese, Dutch, Russian, Japanese, and Simplified Chinese
Network devices, bandwidth, servers, applications, virtual environments, remote systems, IoT, and more
Choose the PRTG Network Monitor subscription that's best for you

API
API stands for “application programming interface.” It is an interface that can be used to access the information of a program, operating system, or framework, and then exchange this information in a standardized manner. Communication takes place via the defined interface.
REST
REST stands for “representational state transfer.” It is a programming paradigm that is mostly used online. REST is an alternative to SOAP (Simple Object Access Protocol). Its architecture is significantly more modern and generates lighter loads. Another advantage of REST: a large part of the infrastructure, including web servers, HTML-compatible clients, and XML parsers, is already available on the Internet.
REST and HTTP
To communicate with RESTful APIs, an HTTP or HTTPS request is sent to a target, for example a web address. This communication occurs by way of GET and POST. GET has read-access to resources. With POST, data can be sent along with the request.
RESTful API
Many web environments, websites, and web services use RESTful APIs. These programming interfaces are based on REST. HTTP requests placed via a REST or RESTful API return XML and JSON files, which can then be selected to monitor desired values, for example.
REST and RESTful
REST stands for the architectural style or programming paradigm. Web services or websites are “RESTful” when they use or implement REST.
REST API monitoring refers to the process of tracking and analyzing the performance, functionality, availability, and reliability of REST APIs (Representational State Transfer Application Programming Interfaces). It involves assessing the APIs to ensure they are working correctly, meeting performance expectations, and providing a seamless experience for users or applications that rely on them.
Use cases of REST API monitoring include:
There are several benefits of REST API monitoring, including:
Effective REST API monitoring requires regular validation checks of endpoints and authentication. PRTG simplifies REST API monitoring by automating these processes, tracking response times, and verifying data integrity. Set appropriate thresholds for alerts, monitor both availability and performance metrics, and implement scheduled testing intervals that balance thoroughness with resource usage. This comprehensive approach ensures problems are detected before they impact users or dependent systems.
In PRTG, “sensors” are the basic monitoring elements. One sensor usually monitors one measured value in your network, for example the traffic of a switch port, the CPU load of a server, or the free space on a disk drive. On average, you need about 5-10 sensors per device or one sensor per switch port.
Paessler conducted trials in over 600 IT departments worldwide to tune its network monitoring software closer to the needs of sysadmins. The result of the survey: over 95% of the participants would recommend PRTG – or already have.

Paessler PRTG is used by companies of all sizes. Sysadmins love PRTG because it makes their job a whole lot easier.
Bandwidth, servers, virtual environments, websites, VoIP services – PRTG keeps an eye on your entire network.
Everyone has different monitoring needs. That’s why we let you try PRTG for free.