Monitor network traffic directly from your routers: SNMP, WMI, packet sniffing, NetFlow, sFlow, jFlow, IPFIX
Our users give top ratings for monitoring with Paessler PRTG


Bandwidth monitoring with PRTG: an all-in-one solution
PRTG makes bandwidth monitoring easy
Custom alerts and data visualization make it easy to monitor, identify, and prevent bandwidth issues.
Why choose PRTG for bandwidth monitoring?
Troubleshoot "bandwidth hogs" faster
Paessler PRTG helps you troubleshoot bandwidth issues faster with a comprehensive network bandwidth monitor. You can choose from around 20 preconfigured sensors for bandwidth monitoring that are set up with just a few clicks. This way, you can more quickly find out which devices or applications are hogging your bandwidth.
Measure all traffic in your network
Most bandwidth analysis solutions only check traffic on a single device. The bandwidth monitoring software PRTG measures all network traffic by monitoring data directly on your routers using protocols like SNMP, WMI, flow (NetFlow, jFlow, sFlow, IPFIX), or packet sniffing. Monitor all ingoing and outgoing traffic and see which applications or servers are using the most bandwidth.
Monitor over a longer period
PRTG lets you keep an eye on your bandwidth over a longer period of time and recognizes when utilization spikes. This helps you plan for more bandwidth at key times, like when your website is in high demand, when users draw heavily upon applications, or when an update is pending.
Diagnose capacity & plan more efficiently
When your bandwidth is slowly reaching its limit, PRTG bandwidth monitor notifies you even before maximum capacity has been reached. This lets you plan for new resources in a timely manner, ensures a high QoS and helps prevent performance issues.
Reduce costs & improve satisfaction
By removing bandwidth hogs, you'll increase the efficiency of your network. These savings quickly compensate for the cost of PRTG. You'll also boost the reliability of your network and enjoy greater control of your IT infrastructure. This way, you'll improve employee performance and boost customer satisfaction.
What is bandwidth monitoring?
Bandwidth monitoring is a method to measure the actual bandwidth that is available on a local system (LAN or WiFi). Bandwidth monitoring tools display real-time data such as download and upload speed, or latency and thus help prevent network strain and aid in troubleshooting.
Private individuals and professionals alike use bandwidth monitoring with PRTG to check for available bandwidth.
What bandwidth monitoring looks like in PRTG
With PRTG, it is easy to track and check bandwidth usage in your network. The bandwidth tool reads the traffic data directly from your routers and visualizes the results, for example, in so-called toplist graphs. This way, you will quickly and easily be able to check bandwidth usage and the amount of data transferred.
In PRTG, “sensors” are the basic monitoring elements. One sensor usually monitors one measured value in your network, e.g. the traffic of a switch port, the CPU load of a server, the free space of a disk drive. On average you need about 5-10 sensors per device or one sensor per switch port. ![]() How PRTG defines sensors
How PRTG defines sensors
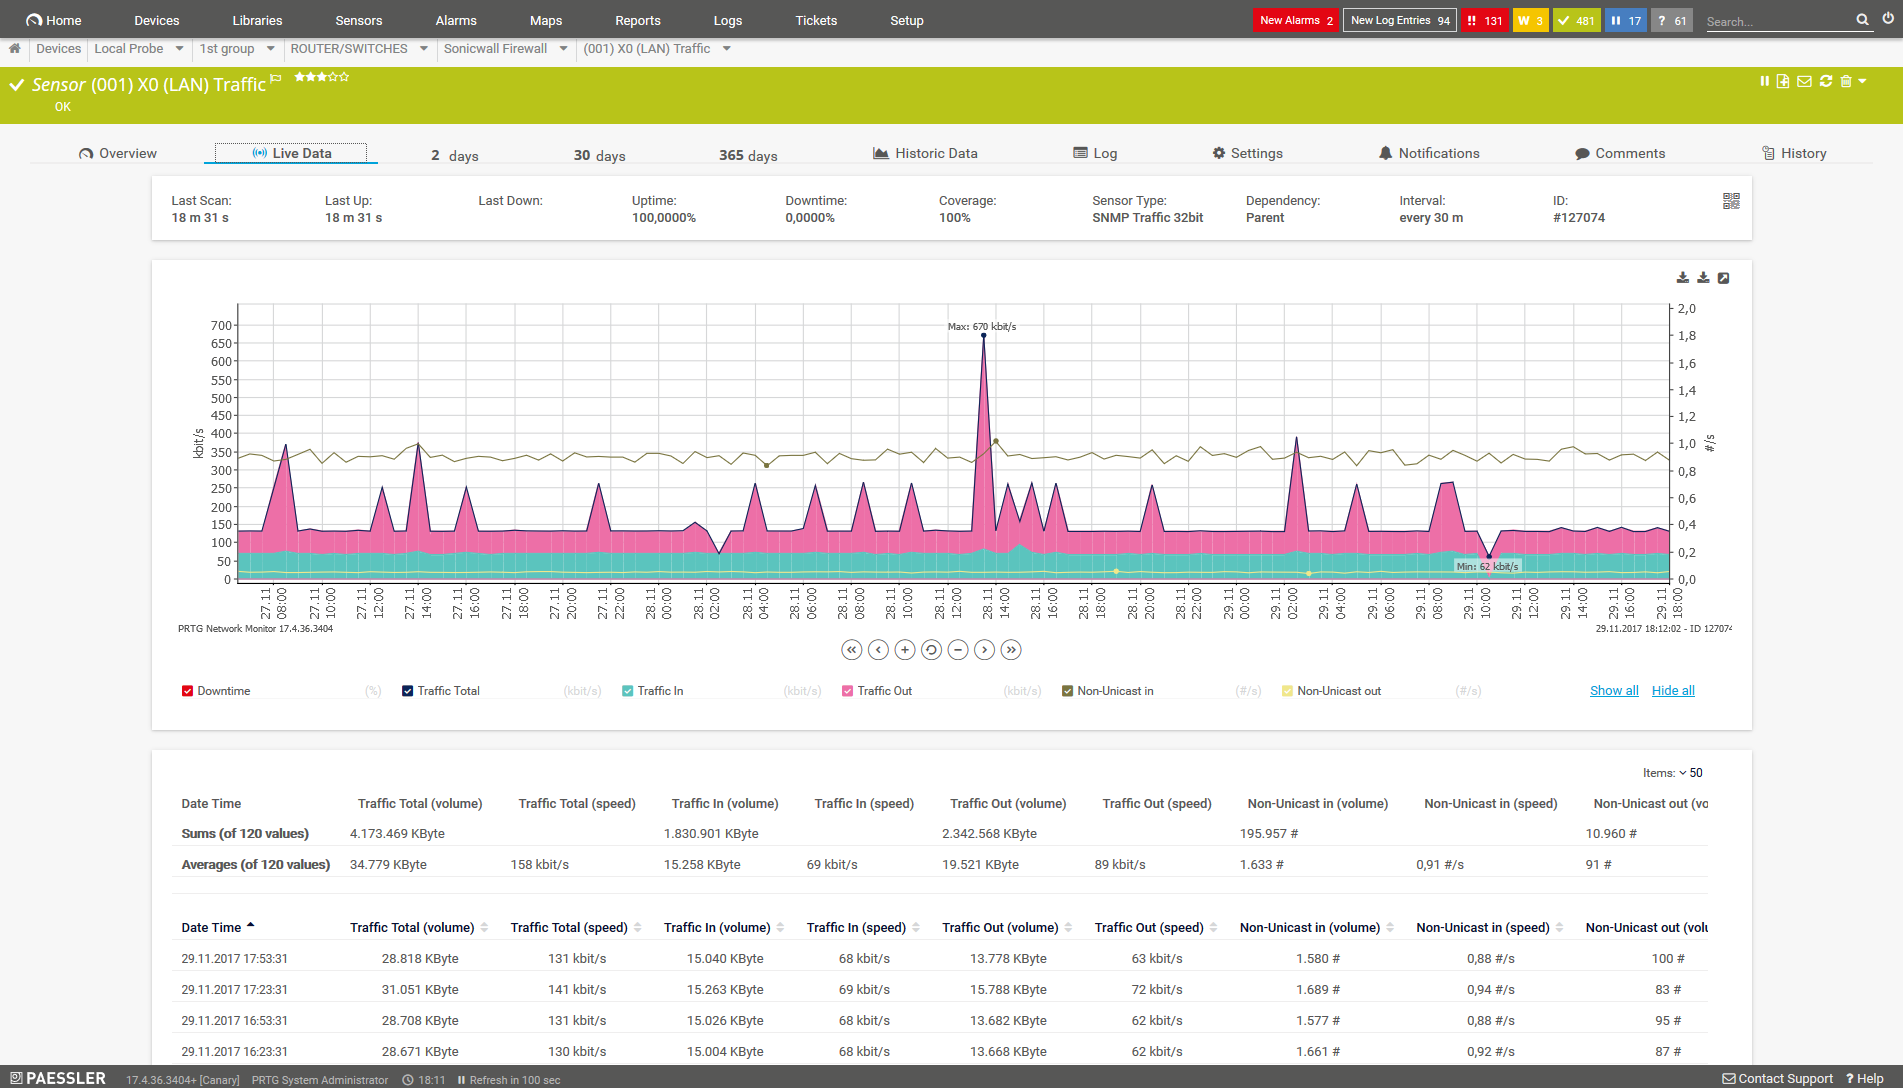
Live traffic graph for an SNMP Traffic sensor
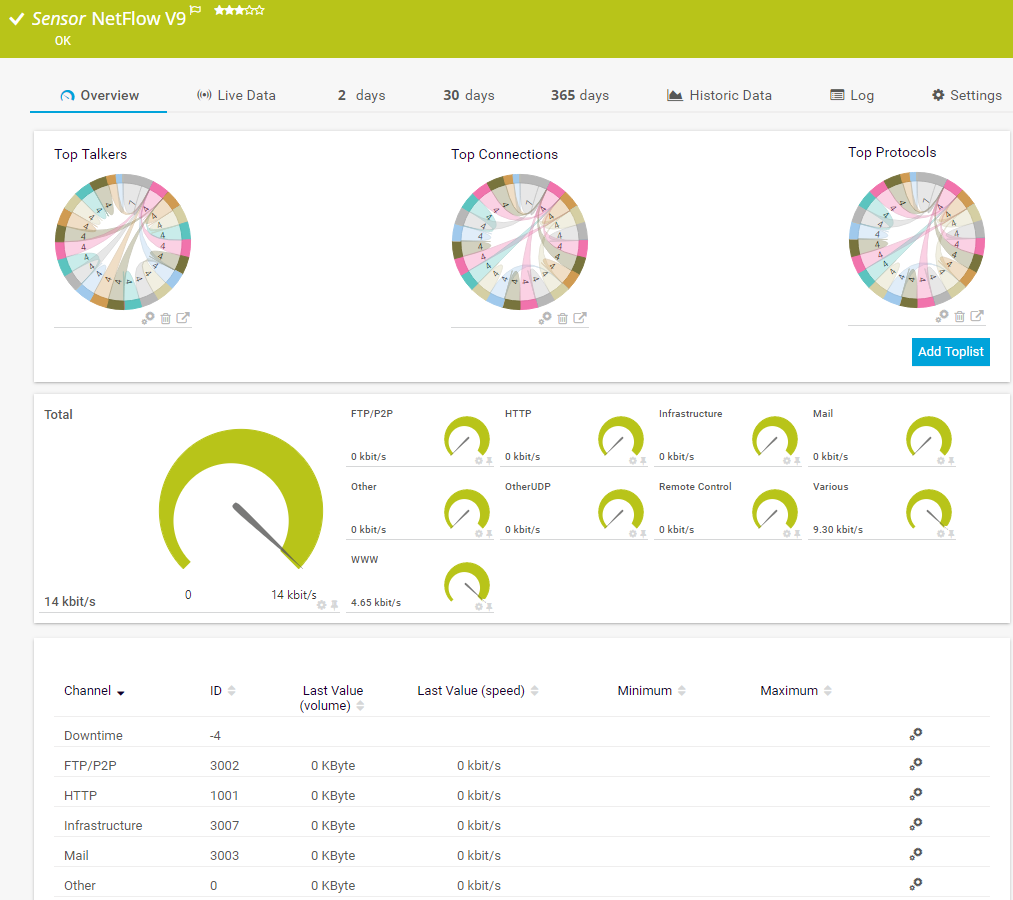
NetFlow v9 sensor

PRTG Sunburst view
“All-around winning “The real beauty of PRTG is the endless possibilities it offers” “PRTG Network MonitorIT experts agree: Paessler PRTG is a great solution for IT infrastructure monitoring

network monitor”

is very hard to beat”
PRTG is compatible with all major vendors & manufacturers
![]()
Start bandwidth monitoring with PRTG and see how it can make your network more reliable and your job easier.
Your bandwidth monitoring at a glance – even on the go
Set up PRTG in minutes and use it on almost any mobile device.


Get a comprehensive overview of your bandwidth usage with PRTG
Monitoring bandwidth usage is key to better network management
Find the source of bottlenecks
PRTG reads the complete traffic data directly from your routers and provides detailed statistics about which services and applications use your bandwidth and where potential bottlenecks could be.
- Monitor users
- Monitor devices
- Monitor services
Monitor bandwidth by any parameter
PRTG displays your bandwidth usage in graphs and toplists and shows net bandwidth consumption based on various parameters using, for example, packet sniffing or flow sensors (NetFlow, sFlow, jFlow, or IPFIX).
- Protocol
- Port number
- IP address (and more)
Configure custom alerts & notifications
Customizable alerts notify you about bandwidth shortages. This ensures that you can react proactively to all bandwidth issues and troubleshoot problems before they become critical.
- SMS alerts
- Push notifications
- Email alerts (and more)
Bandwidth monitoring for professionals
In professional business settings, it has severe consequences if only limited bandwidth is available. Disruptions lead to idleness on the part of employees and customers – and a corresponding loss of sales and revenue. This is why administrators must be able to immediately determine and eliminate bandwidth hogs.
PRTG solves bandwidth issues by helping you to...
- Easily detect & measure heavy bandwidth overloads
- Quickly recognize potential disruptions
- Clearly see which user, service, or device is using the most bandwidth
PRTG makes bandwidth monitoring easy
Custom alerts and data visualization make it easy to monitor, identify, and prevent bandwidth issues.
3 use cases for PRTG bandwidth monitoring
One single network component that overloads can bring your network to its knees. PRTG quickly identifies potential bandwidth bottlenecks and pinpoints the root causes of crashes in likely scenarios.
![]()
Problems with large file transfers
Every company sends large files, which consumes a lot of bandwidth. PRTG helps you avoid the bottlenecks lurking in your network that slow down or disrupt large file transfers and cost you dearly in time and money.
![]()
Slow applications and services
Your coworkers complain that internal programs are running slowly. Your customers complain that your website seems bogged down. PRTG solves this by showing you the cause of overloads and keeping your network at maximum efficiency.
![]()
Backup malfunctions and disruptions
No IT can do without backups. But database synchronizations and backups require a lot of bandwidth – one overload or bottleneck can disrupt everything. PRTG alerts you of bandwidth shortages so you can prevent overloads before they occur.
![]()
“We can all work with greater peace of mind knowing
that our systems are constantly being monitored.”
Markus Puke, Network Administrator, Schüchtermann Klinik, Germany
Start bandwidth monitoring with PRTG and see how it can make your network more reliable and your job easier.
PRTG makes your job easier
Our monitoring software frees you to focus on other tasks by promptly notifying you of potential issues.
![]()
Save effort
PRTG gives you one central monitoring tool for your servers and entire network. Enjoy a quick overview of your whole infrastructure via our dashboard and app.
![]()
Save time
Getting started with PRTG is a breeze. Setting up or switching from another network monitoring tool is easy thanks to the auto-discovery and pre-configured device templates.
![]()
Save money
80% of our customers report substantial cost savings with network monitoring. Your costs of licenses will likely pay for themselves within weeks.
Case study: Austria's rail traffic relies on PRTG
Due to business-critical applications, it is of the utmost importance that the ÖBB Infrastruktur AG data network runs flawlessly at all times. To make this a reality, the management installed PRTG Network Monitor. PRTG is used for monitoring the bandwidth of central routers and switches in the network so administrators can determine the most important key parameters for utilization and availability. In total, monitoring the ÖBB data network consists of several thousand PRTG sensors that query relevant metrics at regular intervals.
The challenge: How to test bandwidth
Would you like to know if your Internet service provider actually provides the bandwidth they've promised? Like many administrators, you probably perform many SLA checks – but how do you test your bandwidth?
Two primary challenges of testing bandwidth
1. Paralyzing your network
To test the maximum throughput, you must use your line to maximum capacity. This means that there will be no more resources for other data during the network test. In other words, you'll paralyze your network.
2. Isolating the test track
For a 100% measurement, you'll essentially need two computers which are directly located on the ends of the line whose bandwidth you want to test. Otherwise, you will simultaneously test all network devices found on the "test track".
 Test connection speed
For these reasons, you cannot measure the bandwidth directly during the entire test, but must test the speed of the connection by generating short load peaks. You can do this, for example, by downloading a small file (a few KB) every few minutes and measuring the time it takes for the download to finish.
The solution: PRTG makes it easier to test bandwidth
![]()
Create three HTTP Advanced sensors that access several files of about 500 KB each from various "fast servers" (for example, the static websites of your Internet service provider).
![]()
Let the sensors run for a few hours with a 5-minute scanning interval. The sensors have a channel that specifies the bandwidth achieved during the file download in Kbps.
![]()
If you have a data line with a specified bandwidth of 4 Mbps, for example, the network test of downloading a 500 KB file should last 1 second: 4 Megabits per second = 0.5 MB per second = 500 KB per second
If your line is used by others during the network test, you will see jitter (unwanted fluctuations) on the curve because your test did not always run with the full amount of available bandwidth. If during the test there was no other traffic on the line, your curve should closely resemble a straight line.
Bandwidth checks with PRTG will allow you to monitor your network closely and detect potential bottlenecks before they can cause real harm.
 Attention!
If you download a 500 KB file every 60 seconds, you'll generate a data volume of
720 MB per day!
Video tutorial: PRTG bandwidth monitoring methods
Watch a quick overview of the bandwidth monitoring methods PRTG offers and discover which method is best suited for your IT infrastructure.
We'll make you a monitoring expert
Gain practical knowledge on how to monitor your infrastructure with Paessler PRTG. Our training sessions are planned and provided by Paessler system engineers and are suitable for different experience levels.

PRTG: The multi-tool for sysadmins
Adapt PRTG individually and dynamically to your needs and rely on a strong API:- HTTP API: Access monitoring data and manipulate monitoring objects via HTTP requests
- Custom sensors: Create your own PRTG sensors for customized monitoring
- Custom notifications: Create your own notifications and send action triggers to external systems
- REST Custom sensor: Monitor almost everything that provides data in XML or JSON format

Practical tip: “Hey Mathias, what would you tell administrators who wish to monitor their bandwidth?”
“Instead of trying to measure bandwidth by way of an extra, simulated load, you should have a look around for actions which do that anyway – and then monitor them. For example, when you perform backups, you often put great strain on the bandwidth and can thus easily recognize shortages or bottlenecks.”
Mathias Hengl, PRTG developer at Paessler
Create innovative solutions with Paessler’s partners
Partnering with innovative vendors, Paessler unleashes synergies to create
new and additional benefits for joined customers.


Discover our preconfigured PRTG bandwidth monitoring sensors
Here are some examples of sensors that can be used for bandwidth monitoring with PRTG:
Packet Sniffer
The Packet Sniffer sensor monitors the headers of data packets that pass a local network using a built-in packet sniffer. The sensor can show the following traffic types:
- Chat (IRC, AIM)
- Citrix
- FTP/P2P
- Mail, WWW
- Remote control (RDP, SSH, Telnet, VNC)
Note: The sensor only analyzes header traffic.
SNMP General
The SNMP Traffic sensor monitors traffic on a device via SNMP.
The SNMP RMON sensor monitors traffic on a device using the RMON standard via SNMP and can show, for example:
- Transmitted kbit/s
- Packets, CRC errors, fragments, jabbers, and collisions per second
NetFlow v9
The NetFlow v9 sensor shows traffic for devices that support NetFlow v9. Traffic types include:
- Chat (IRC, AIM)
- Citrix
- FTP/P2P
- Mail, WWW
- Remote control (RDP, SSH, Telnet, VNC)
NetFlow v5
The NetFlow v5 sensor shows traffic for devices that support NetFlow v5. Traffic types include:
- Chat (IRC, AIM)
- Citrix
- FTP/P2P
- Mail, WWW
- Remote control (RDP, SSH, Telnet, VNC)
SNMP Cisco ASA VPN Traffic
The SNMP Cisco ASA VPN Traffic sensor monitors the traffic of an IPsec VPN connection on a Cisco ASA via SNMP. It shows the incoming and outgoing traffic.
SNMP NetApp Network Interface
The SNMP NetApp Network Interface sensor monitors a network card of a NetApp storage system via SNMP and can show:
- Traffic in and out
- Number of errors per second (in and out)
Windows Network Card
The Windows Network Card sensor monitors network bandwidth usage and traffic on a network interface using WMI or Windows Performance Counters and can show among others:
- Total traffic on the network card
- Number of received and sent packets
- Number of discards, errors, unicast packets, and unknown protocols
And more...
Find more of our preconfigured PRTG bandwidth monitoring sensors, including custom sensors for monitoring bandwidth the way you need, here: List of available sensor types
Still not convinced?
More than 500,000
sysadmins love PRTG
Paessler PRTG is used by companies of all sizes. Sysadmins love PRTG because it makes their job a whole lot easier.
Monitor your entire IT infrastructure
Bandwidth, servers, virtual environments, websites, VoIP services – PRTG keeps an eye on your entire network.
![]()
Start bandwidth monitoring with PRTG and see how it can make your network more reliable and your job easier.
|
PRTG |
Network Monitoring Software - Version 24.2.96.1375 (June 26th, 2024) |
|
Hosting |
Download for Windows and cloud-based version PRTG Hosted Monitor available |
Languages |
English, German, Spanish, French, Portuguese, Dutch, Russian, Japanese, and Simplified Chinese |
Pricing |
Up to 100 sensors for free (Price List) |
Unified Monitoring |
Network devices, bandwidth, servers, applications, virtual environments, remote systems, IoT, and more |
Supported Vendors & Applications |
|