Custom alerts and data visualization let you quickly identify and prevent slow resolution time, outages, and other service delivery issues.
Whether you monitor websites, services, applications, or specific devices in IT infrastructures that play an important role in production and business processes – all of these components should (ideally) be available at all times.
However, planned maintenance windows and unplanned downtimes mean that you can’t usually guarantee 100% availability. This is where the magic "five nines" – or 99.999% target availability – come into play.
With PRTG Enterprise Monitor and our product extension PRTG SLA Reporter, getting SLA monitoring in combination with powerful SLA reporting to keep track of your 99.999% is just a few clicks away.
Service level agreements are as different as the types of services a customer needs from a provider. It’s vital to define measurable service level objectives (SLOs) based on key performance indicators. This way, the parties involved can concretely show, based on numbers, how well (or poorly) service providers are achieving their service goals. Paessler PRTG can measure these common types of SLAs, and more:
Diagnose network issues by continuously tracking the availability of your applications, services, and your entire network. Show response time, uptime and downtime, quality of service, and other key SLA metrics in real time. Visualize monitoring data in clear graphs and dashboards to identify problems more easily. Gain the overview you need to troubleshoot performance issues and report on SLA compliance.

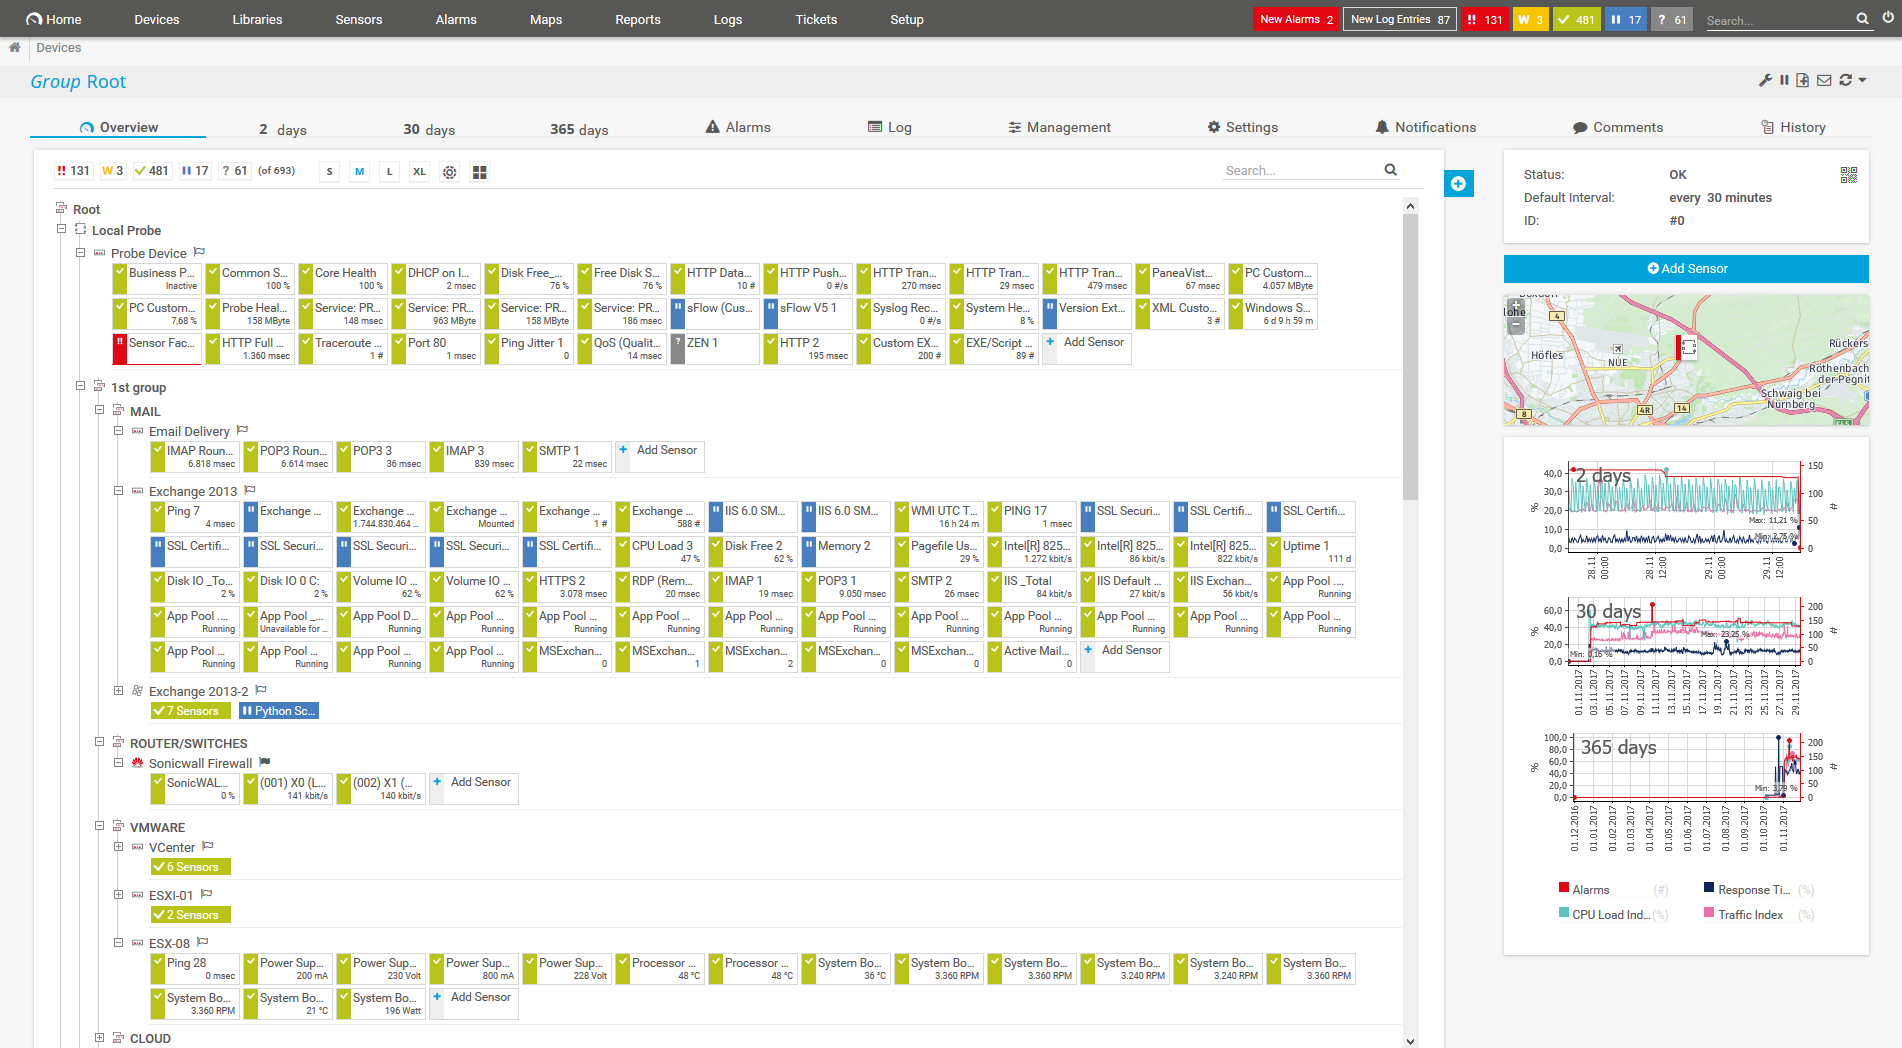
Device tree view of the complete monitoring setup

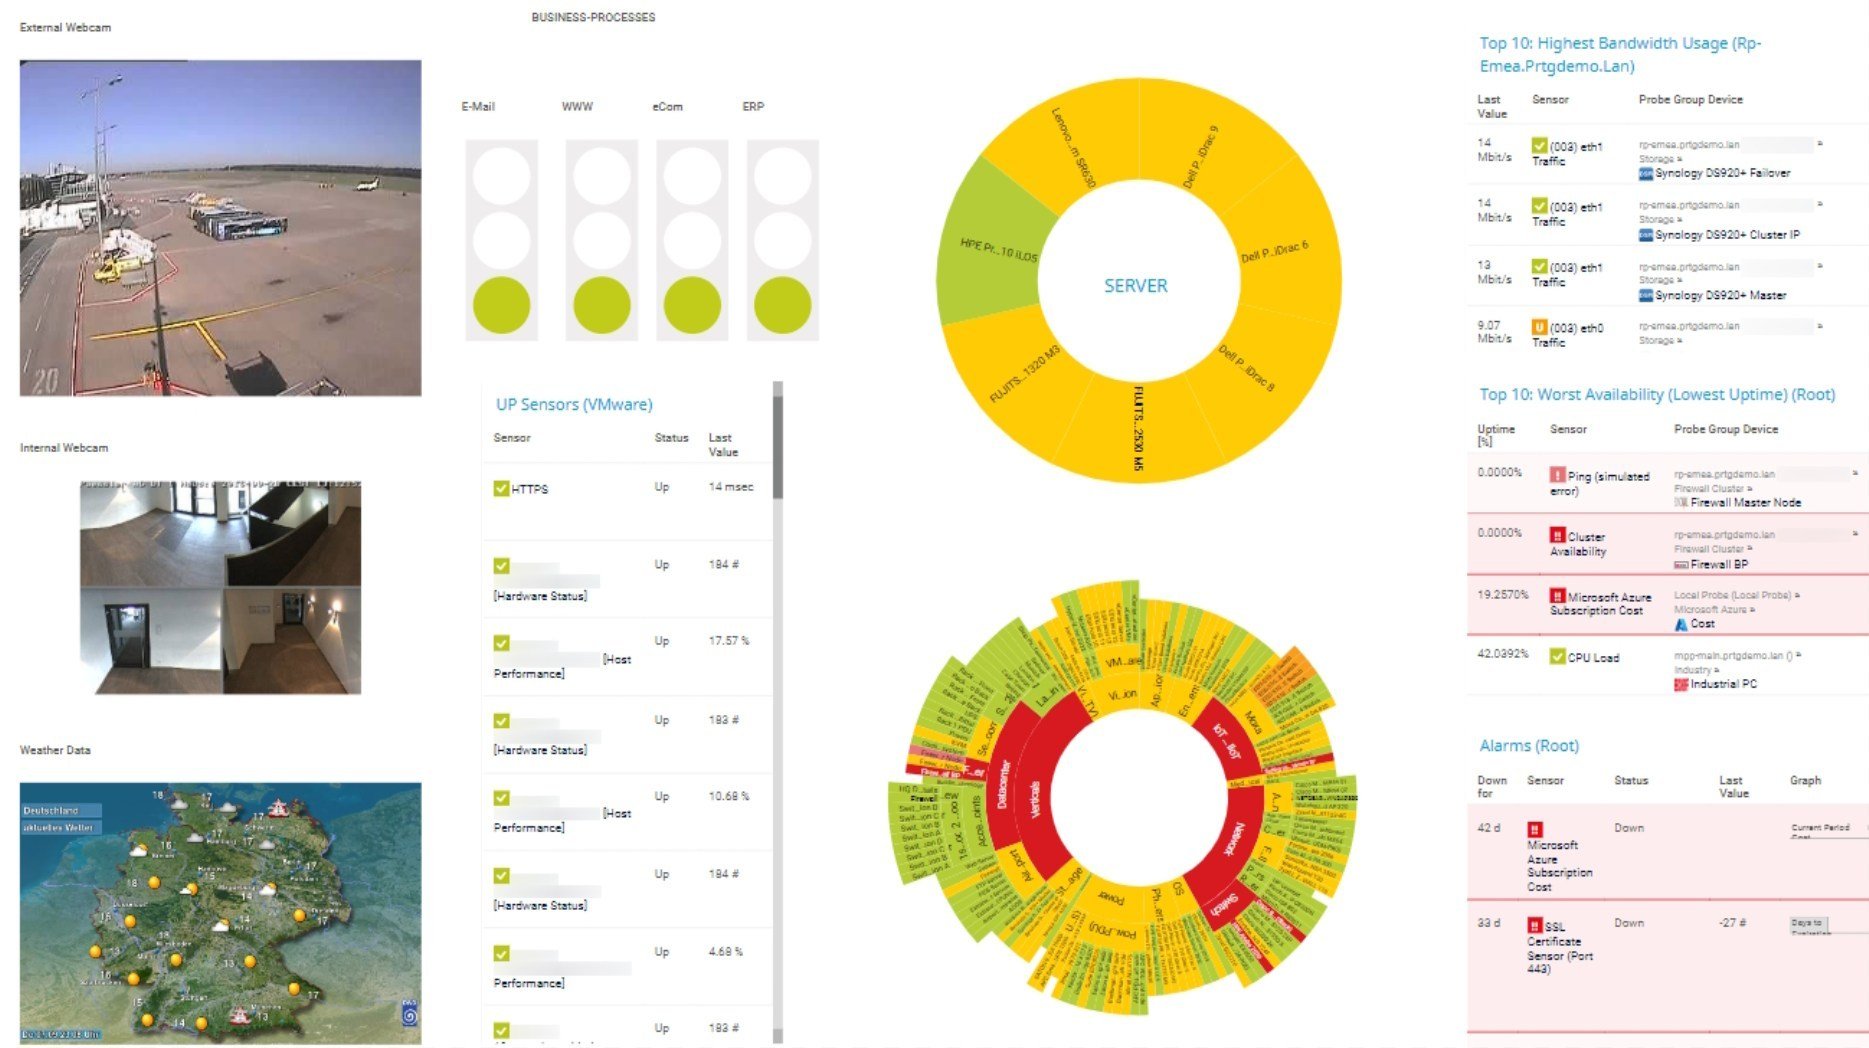
Custom PRTG dashboard for keeping an eye on the entire IT infrastructure

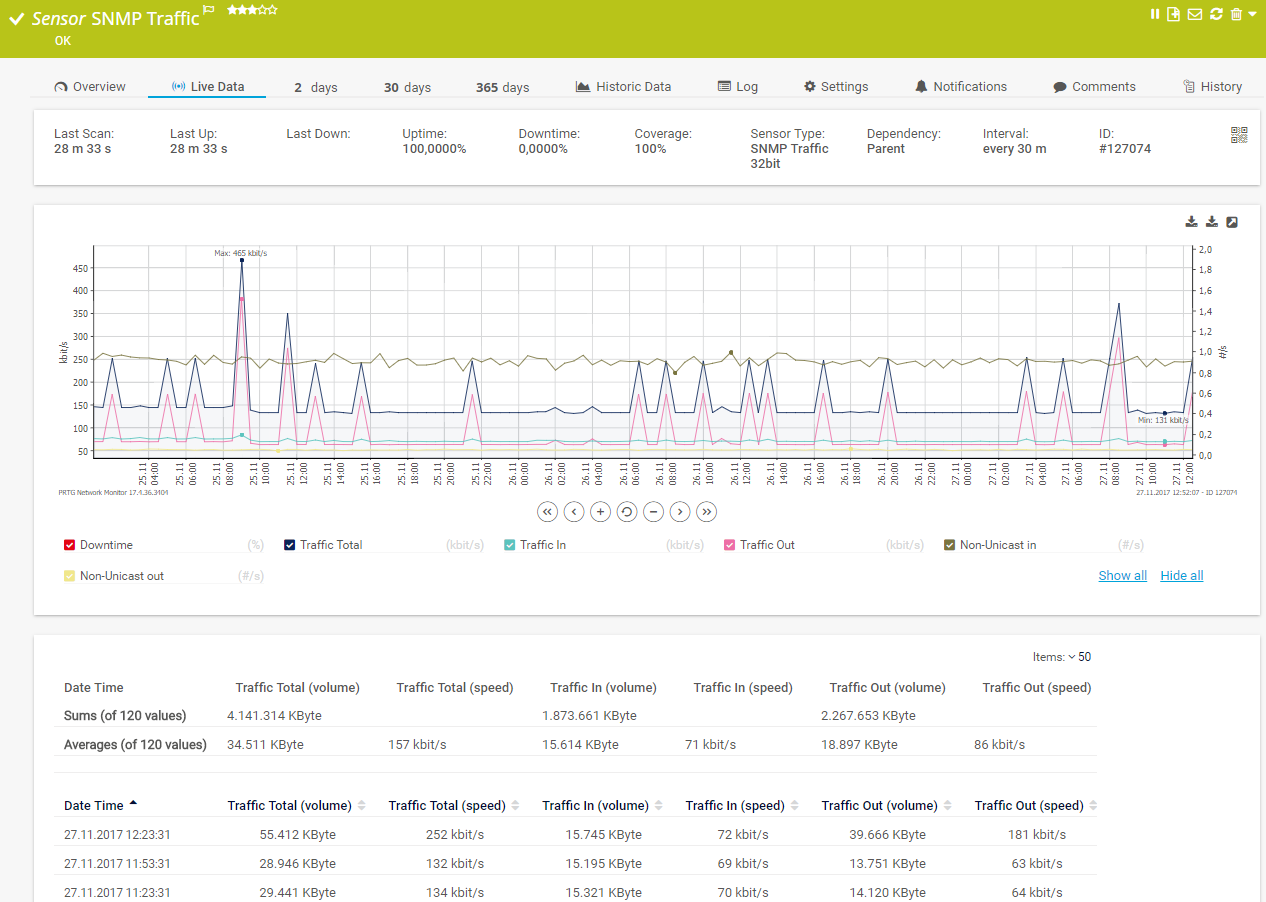
Live traffic data graph in PRTG
Every system failure leads to lost sales and customer complaints, making high availability essential with as little disruptions and downtime as possible.
With PRTG, you always have an eye on the targeted 99.999% uptime, no matter how ambitious these goals may seem.
As a service provider, you can increase customer satisfaction by providing quantified information about the status of SLA compliance at any time.
Plus, in-depth SLA reporting with PRTG also makes it easier for you to offer transparency by communicating with the customer about the causes that led to downtime.
Large IT infrastructures require a monitoring solution that provides a complete overview of the entire infrastructure, including at-a-glance visualization.
With PRTG, you get all this in custom dashboards. Clear color coding always shows you if everything is okay or if there is a problem.
PRTG lets you report on SLAs based on historical monitoring data (uptime & downtime) and across multiple PRTG servers.
Plus, you can store your SLA data separately from PRTG in an MS SQL database and deploy third-party tools you already have in your company for creating custom SLA reports.
Custom alerts and data visualization let you quickly identify and prevent slow resolution time, outages, and other service delivery issues.
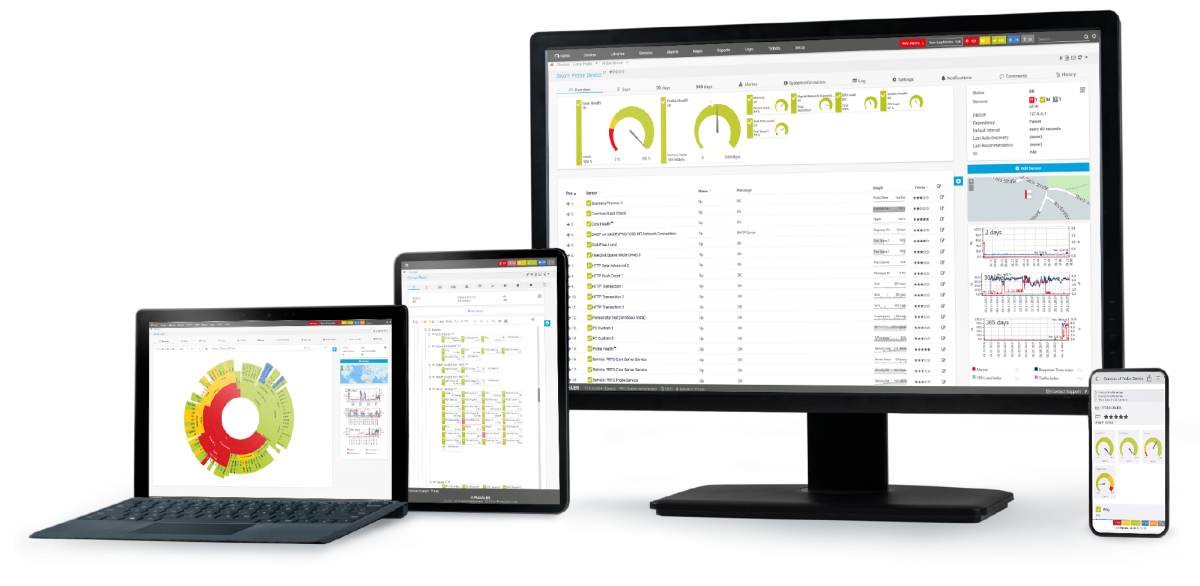
PRTG is set up in a matter of minutes and can be used on a wide variety of mobile devices.

“Excellent tool for detailed monitoring. Alarms and notifications work greatly. Equipment addition is straight forward and server initial setup is very easy. ...feel safe to purchase it if you intend to monitor a large networking landscape.”
Partnering with innovative IT vendors, Paessler unleashes synergies to create
new and additional benefits for joined customers.
By integrating PRTG with Martello iQ, you can add a fast analytics layer to improve uptime, visualize your IT environment, and integrate all of your IT systems into a single pane of glass.
Combining PRTG’s broad monitoring feature set with IP Fabric’s automated network assurance creates a new level of network visibility and reliability.
With ScriptRunner Paessler integrates a powerful event automation platform into PRTG Network Monitor.
Real-time notifications mean faster troubleshooting so that you can act before more serious issues occur.
Network Monitoring Software – Version 25.3.110.1313 (August 27, 2025)
Download for Windows and cloud-based version PRTG Hosted Monitor available
English, German, Spanish, French, Portuguese, Dutch, Russian, Japanese, and Simplified Chinese
Network devices, bandwidth, servers, applications, virtual environments, remote systems, IoT, and more
Choose the PRTG Network Monitor subscription that's best for you
A service level agreement, or SLA, describes an agreement between the provider of a service and a customer who uses the service.
The SLA defines various aspects of the service, including:
Service level agreements are usually set out in a service contract. SLAs are popular in the IT sector, for example with IT service providers, cloud service providers, or managed service providers (MSPs).
Monitoring service level agreements is important for both sides: for the service provider as well as for the customer. After all, an agreement only has added value if the involved parties stick to it – and monitoring makes compliance with the standards defined in the SLAs transparent.
Transparency for the customer
Customers should be able to check for themselves – independently of the service provider – whether the provider actually delivers all agreed services in full. To do this, they need the most meaningful figures possible on the availability and downtimes of the provided services.
Transparency for the service provider
Service providers should be able to make sure that they comply with the defined SLAs. On the one hand, to ensure the quality of their services, and on the other hand, to avoid legal action by the customer if they do not comply with the SLAs.
In combination with service level management (SLM), service level agreement monitoring also helps to optimize services and adjust SLAs accordingly together with the customer.
SLA monitoring focuses on real-time tracking and analysis of performance metrics to ensure compliance with agreed-upon standards. It involves ongoing surveillance to promptly address any deviations and maintain service quality.
On the other hand, SLA reporting involves the periodic generation and distribution of comprehensive reports summarizing performance metrics over a specific period. These reports provide stakeholders with insights into service performance trends, areas of improvement, and compliance with SLA terms.
Paessler PRTG SLA Reporter is a separately licensed product extension of Paessler PRTG monitoring software by Paessler GmbH. It provides detailed SLA reporting based on monitoring data collected from your PRTG installations. You can only use the extension together with a commercial license of PRTG Network Monitor with active maintenance or an active PRTG Enterprise Monitor subscription.
In PRTG, “sensors” are the basic monitoring elements. One sensor usually monitors one measured value in your network, for example the traffic of a switch port, the CPU load of a server, or the free space on a disk drive. On average, you need about 5-10 sensors per device or one sensor per switch port.
Paessler conducted trials in over 600 IT departments worldwide to tune its network monitoring software closer to the needs of sysadmins. The result of the survey: over 95% of the participants would recommend PRTG – or already have.
Paessler PRTG is used by companies of all sizes. Sysadmins love PRTG because it makes their job a whole lot easier.
Bandwidth, servers, virtual environments, websites, VoIP services – PRTG keeps an eye on your entire network.
Everyone has different monitoring needs. That’s why we let you try PRTG for free.