PRTG Manual: Object Hierarchy
PRTG arranges all objects in the monitoring configuration in a tree-like hierarchy. You can arrange the objects in groups that monitor similar devices, services, or particular locations. You can also use this hierarchical order to define common settings for larger groups of objects. The settings of the root group, for example, apply to all other objects underneath in the object hierarchy by default.
For more information, see section Inheritance of Settings.
The root group is the topmost instance in PRTG. It contains all other objects in your setup. We recommend that you adjust all default settings for the root group. This is because all other objects in the device tree inherit these standard settings by default so that you do not need to set up the same configuration for each object anew.
Each group is part of a probe (this excludes root group). This is where the actual monitoring takes place. All objects that you add to a probe are monitored via that probe. In PRTG Network Monitor, every PRTG core server installation automatically installs the local probe.
In PRTG Hosted Monitor, every instance has the hosted probe.
In a failover cluster, there is an additional cluster probe that runs on all cluster nodes. All devices that you create on the cluster probe are monitored by all cluster nodes, so data from different perspectives is available and monitoring continues even if one of the cluster nodes fails.
You can add additional probes and remote probes to your configuration to also monitor remote devices from outside your network.
For more information, see section Add Remote Probe.
On each probe, there are one or more groups that have structural purposes. Use groups to arrange similar objects so that they inherit the same settings. To a group, you add devices. You can arrange your devices in different nested groups to reflect the structure of your network.
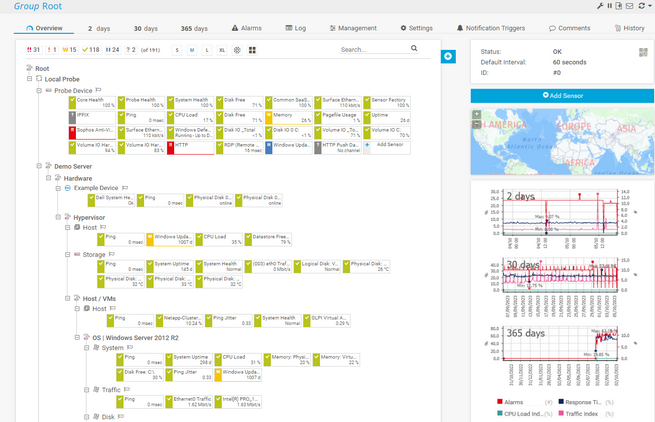
Here you can see a sample configuration of a device tree with the local probe, several groups, devices, and their sensors:
You can add devices that you want to monitor to each probe or group. Each device in your configuration represents real hardware or a virtual device in your network, for example:
- Web or file servers
- Client computers (Windows, Linux, or macOS)
- Routers or network switches
- Almost every device in your network that has its own IP address
You can add devices with the same IP address or Domain Name System (DNS) name multiple times. This way, you can get a more detailed overview when you use a large number of sensors or you can use different device settings for different groups of sensors. The sensors on all of these devices then query the same real hardware device in your network.
PRTG additionally adds the probe device to the local probe. This is an internal system device with several sensors. It has access to the probe system and monitors the system's health parameters.
PRTG automatically analyzes the devices that you add and recommends appropriate sensors on the Overview tab of the device. To create recommended sensors, click Add These Sensors in the Recommended Sensors table.
For more information about the Overview tab, see the Knowledge Base: What options do I have to review my monitoring data in detail?
You can turn off the sensor recommendation in the system administration settings under Monitoring.
On each device, you can create a number of sensors. Every sensor monitors one single aspect of a device, for example:
- A network service like Simple Mail Transfer Protocol (SMTP), File Transfer Protocol (FTP), or HTTP
- The traffic on a network switch
- The CPU load of a device
- The memory usage of a device
- The traffic on one network adapter
- A NetFlow device
- The system health of a device
- And much more
For more information, see the video tutorial: What is a sensor?
Every sensor has a number of channels through which it receives the different data streams. The available channels depend on the type of sensor. One channel can contain, for example:
- Downtime and uptime of a device
- Traffic in, Traffic out, or Traffic sum of a bandwidth device (for example, a router)
- Mail traffic of a NetFlow device
- CPU load of a device
- Loading time, Download bandwidth, or Time to first byte of a web page
- Response time of a ping request to a device
- And much more
VIDEO TUTORIAL
What is a sensor?

