PRTG Manual: Alarms
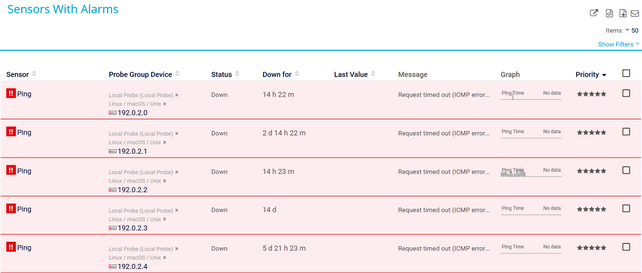
You can see all sensors that are in the Down, Down (Partial), Down (Acknowledged), Warning, or the Unusual status. Sensors in other states, for example, Up, Paused, or Unknown, do not appear here. This is useful for keeping track of all irregularities in your network.
By default, table lists that show alarms are sorted by priority. Click a column header to sort the list items by a different category.
There are two ways to display the alarms list. Either click the Alarms tab of a probe, group, or device, or click Alarms in the main menu bar.
Probe, group, device, and sensor pages have tabs that you can use to navigate between the different options. For example, you can view your network's status, view monitoring results, or change settings.
Click the Alarms tab of a probe, group, or device to show a table list of all sensors on the selected object that show the Down, Down (Partial), Down (Acknowledged), Warning, or Unusual status. This list is a subset of the entries that are available via the Alarms | All option in the main menu bar.
The Alarms tab is not available for sensors.
Click Alarms in the main menu bar to show a table list of all sensors in your installation that show the Down, Down (Partial), Down (Acknowledged), Warning, or Unusual status. You can also show these sensors as gauges or only show a subset of sensors in specific states. Hover over Alarms to show further options:
Option |
Description |
|---|---|
All |
Open a list of all sensors that are in the Down, Down (Partial), Down (Acknowledged), Warning, or Unusual status. |
Show as Gauges |
Open a page with the gauges of all sensors that are in the Down, Down (Partial), Down (Acknowledged), Warning, or Unusual status. The size of the gauges corresponds to the sensor's priority. |
Errors Only |
Open a list of all sensors that are in the Down, Down (Partial), or Down (Acknowledged) status. |
Warnings Only |
Open a list of all sensors that are in the Warning status. |
Unusuals Only |
Open a list of all sensors that are in the Unusual status. |
An acknowledged alarm shows the Down (Acknowledged) status. It does not trigger any more notifications.
If the alarm condition clears, the sensor usually returns to the Up status with the next sensor scan.
If a sensor in the Down (Acknowledged) status was paused and resumed, it shows the Down status again.
To acknowledge an alarm, right-click a sensor that shows the Down status. From the context menu, select Acknowledge Alarm, then select a time span, optionally enter a message, and click OK. The message appears in the last message value of the sensor.
The time spans that you can select are: Acknowledge Indefinitely, acknowledge For 5 Minutes, For 15 Minutes, For 1 Hour, For 3 Hours, For 1 Day, or Until. If you select Until, provide the following information:
Field |
Description |
|---|---|
Selected Objects |
Shows the sensors for which you want to acknowledge the alarm. You can acknowledge alarms for more than one sensor using multi-edit. |
Message |
Enter a text, for example, the reason why you acknowledge the alarm. Enter a string or leave the field empty. |
Until |
Select the date when the Down (Acknowledged) status ends. Use the date time picker to enter the date and time.
|
By default, only read/write users or administrators can acknowledge alarms. However, you can give read-only users the right to acknowledge alarms, too. For more information, see the PRTG Manual: User Accounts.
KNOWLEDGE BASE
Which audible notifications are available in the PRTG web interface and in the PRTG app for desktop?

