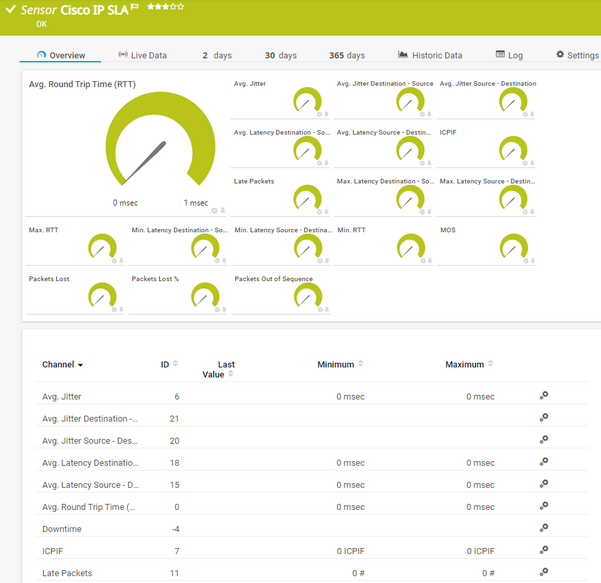
PRTG Manual: Cisco IP SLA Sensor
The Cisco IP SLA sensor monitors Voice over IP (VoIP) network parameters using IP service level agreements (SLA) from Cisco via the Simple Network Management Protocol (SNMP).
For a detailed list and descriptions of the channels that this sensor can show, see section Channel List.
- Dutch: Cisco IP SLA
- French: Cisco IP SLA
- German: Cisco IP SLA
- Japanese: Cisco IP SLA
- Portuguese: Cisco IP SLA
- Russian: Cisco IP SLA
- Simplified Chinese: Cisco IP SLA
- Spanish: Cisco IP SLA
Consider the following remarks and requirements for this sensor:
Remark |
Description |
|---|---|
IPv4 |
This sensor only supports IPv4. |
Performance impact |
This sensor has a low performance impact. |
Lookups |
This sensor uses lookups to determine the status values of one or more channels. |
Object identifiers (OID) |
If the object identifiers (OID) that this sensor uses are not available on the target device, the sensor shows the error message: No such object (SNMP error # 222). If this occurs, open the SNMP Compatibility Options setting of the parent device or group and set the Request Mode to Use single get. |
Sensor creation |
If there is a very large number of IP SLAs available during sensor creation, we recommend that you limit the result set by using the Start Interface Index and End Interface Index options in the SNMP Compatibility Options setting of the parent device or group. |
The sensor has the following default tags that are automatically predefined in the sensor's settings when you add the sensor:
- ipslasensor
For more information about basic sensor settings, see section Sensor Settings.
Setting |
Description |
|---|---|
ID |
The ID of the SLA that this sensor monitors. This sensor can support the following operations with the specified type IDs:
|
Type |
The type of the SLA that this sensor monitors. |
Name (Tag) |
The name of the SLA that this sensor monitors. |
Owner |
The owner of the SLA that this sensor monitors. |
Frequency |
The frequency of the SLA that this sensor monitors. |
Setting |
Description |
|---|---|
Primary Channel |
Select a channel from the list to define it as the primary channel. In the device tree, PRTG displays the last value of the primary channel below the sensor's name. The available options depend on what channels are available for this sensor.
|
Graph Type |
Define how this sensor shows different channels:
|
Stack Unit |
This setting is only visible if you select Stack channels on top of each other above. Select a unit from the list. PRTG stacks all channels with this unit on top of each other. By default, you cannot exclude single channels from stacking if they use the selected unit. However, there is an advanced procedure to do so. |
By default, all of these settings are inherited from objects that are higher in the hierarchy. We recommend that you change them centrally in the root group settings if necessary. To change a setting for this object only, click ![]() under the corresponding setting name to disable the inheritance and to display its options.
under the corresponding setting name to disable the inheritance and to display its options.
For more information, see section Inheritance of Settings.
Which channels the sensor actually shows might depend on the target device, the available components, and the sensor setup.
Channel |
Description |
|---|---|
Avg. Jitter |
The average jitter |
Avg. Jitter Destination - Source |
The average jitter between destination and source |
Avg. Jitter Source - Destination |
The average jitter between source and destination |
Avg. Latency Destination - Source |
The average latency between destination and source |
Avg. Latency Source - Destination |
The average latency between source and destination |
Average Round Trip Time (RTT) |
The average RTT
|
Downtime |
In the channel table on the Overview tab, this channel never shows any values. PRTG uses this channel in graphs and reports to show the amount of time in which the sensor was in the Down status. |
ICPIF |
The ICPIF |
Late Packets |
The number of late packets |
Max. Latency Destination - Source |
The maximum latency between destination and source |
Max. Latency Source - Destination |
The maximum latency between source and destination |
Max. RTT |
The maximum RTT |
Min. Latency Destination - Source |
The minimum latency between destination and source |
Min. Latency Source - Destination |
The minimum latency between source and destination |
Min. RTT |
The minimum RTT |
MOS |
The MOS |
Packets Lost |
The number of lost packets |
Packets Lost % |
The number of lost packets (%) |
Packets Out of Sequence |
The number of out-of-sequence packets |
KNOWLEDGE BASE
What security features does PRTG include?


