PRTG Manual: Proxmox VE Virtual Machine Status Sensor
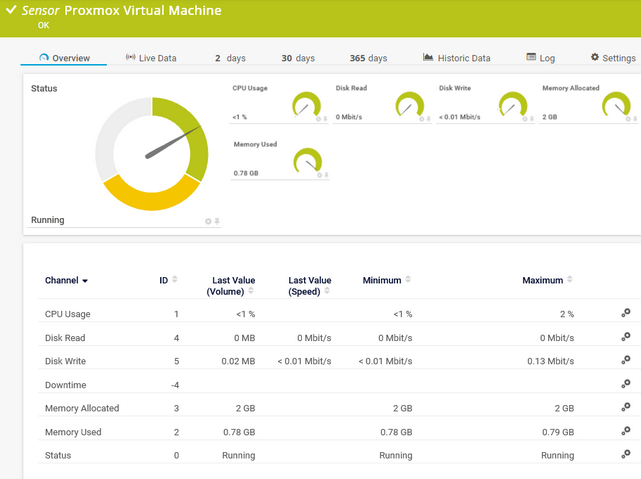
The Proxmox VE Virtual Machine Status sensor monitors the status of a Proxmox Virtual Environment (Proxmox VE) Quality Emulator (QEMU) virtual machine (VM).
This sensor is in beta status. The operating methods and the available settings are still subject to change. Do not expect that all functions work properly, or that this sensor works as expected at all.
For a detailed list and descriptions of the channels that this sensor can show, see section Channel List.
- Dutch: Proxmox VE Virtual Machine Status
- French: Proxmox VE Virtual Machine Status
- German: Proxmox VE Virtual Machine Status
- Japanese: Proxmox VE Virtual Machine Status
- Portuguese: Proxmox VE Virtual Machine Status
- Russian: Proxmox VE Virtual Machine Status
- Simplified Chinese: Proxmox VE Virtual Machine Status
- Spanish: Proxmox VE Virtual Machine Status
Consider the following remarks and requirements for this sensor:
Requirement |
Description |
|---|---|
This sensor requires that the Beta Sensors experimental feature is enabled.
|
|
Credentials |
This sensor requires credentials for Proxmox VE in settings that are higher in the object hierarchy. |
Meta-scan |
This sensor uses the meta-scan feature. After sensor creation, some settings might appear for reference purposes only. |
Parent device |
|
Multi-platform probe |
You can add this sensor to a multi-platform probe. |
IPv6 |
This sensor supports IPv6. |
Performance impact |
This sensor has a very low performance impact. |
Lookups |
This sensor uses lookups to determine the status values of one or more channels. |
Knowledge Base |
Knowledge Base: https://helpdesk.paessler.com/en/support/solutions/articles/76000087437 |
The sensor has the following default tags that are automatically predefined in the sensor's settings when you add the sensor:
- kvm
- proxmox
- qemu
- virtualization
- vm
For more information about basic sensor settings, see section Sensor Settings.
Setting |
Description |
|---|---|
VM ID |
The ID of the VM that this sensor monitors. |
VM Name |
The name of the VM that this sensor monitors. |
Node |
The Proxmox cluster node that hosts the VM that this sensor monitors. |
Setting |
Description |
|---|---|
Primary Channel |
Select a channel from the list to define it as the primary channel. In the device tree, PRTG displays the last value of the primary channel below the sensor's name. The available options depend on what channels are available for this sensor.
|
Graph Type |
Define how this sensor shows different channels:
|
Stack Unit |
This setting is only visible if you select Stack channels on top of each other above. Select a unit from the list. PRTG stacks all channels with this unit on top of each other. By default, you cannot exclude single channels from stacking if they use the selected unit. However, there is an advanced procedure to do so. |
Setting |
Description |
|---|---|
Result Handling |
Define what PRTG does with the sensor result:
|
By default, all of these settings are inherited from objects that are higher in the hierarchy. We recommend that you change them centrally in the root group settings if necessary. To change a setting for this object only, click ![]() under the corresponding setting name to disable the inheritance and to display its options.
under the corresponding setting name to disable the inheritance and to display its options.
For more information, see section Inheritance of Settings.
Which channels the sensor actually shows might depend on the target device, the available components, and the sensor setup.
Channel |
Description |
|---|---|
CPU Usage |
The CPU usage |
Disk Read |
The disk read speed |
Disk Write |
The disk write speed |
Downtime |
In the channel table on the Overview tab, this channel never shows any values. PRTG uses this channel in graphs and reports to show the amount of time in which the sensor was in the Down status. |
Memory Allocated |
The total memory allocated to the VM |
Memory Used |
The memory in use |
Status |
The overall status
|
KNOWLEDGE BASE
What are beta sensors and how can I use them?
What security features does PRTG include?


