![]()
Ensure your network’s continued availability, with PRTG uptime monitoring
- Continuously monitor and analyze uptime across your infrastructure
- Get alerted promptly of unexpected downtimes in your network
- Give customers real-time status updates in case of outages
- Optimize performance and proactively plan future capacity
Our users give top ratings for monitoring with Paessler PRTG


PRTG uptime monitoring: What you’ll find on this page

PRTG makes monitoring uptime easy
Custom alerts and data visualizations make it easy to monitor, identify, and prevent slow response times, bottlenecks, downtime, and other network availability issues.
Five nines for the uptime win
It's the number every sysadmin strives for: 99.999% uptime. It doesn't get more stable and reliable than that.
But, with so many variables that could impact your network's performance, hitting that mythical benchmark can seem as likely as becoming an overnight millionaire.
With more than 250 preconfigured sensors for monitoring your entire network, Paessler PRTG can continuously track servers, routers, switches, applications, virtual machines, and every other component that could fail and cause disruption, alerting you as soon as your network's uptime is at risk.
That means more availability, less unplanned downtime, and happier colleagues, higher-ups, and customers.
4 reasons why to choose PRTG as your uptime monitoring software
Smart setup
Just install PRTG with a few clicks and let the automatic network discovery ping your chosen IP range. PRTG automatically detects any devices in that range that are connected to your network and adds the sensors you need to monitor their uptime and other key metrics. Could it be any simpler?
Automatic alerts
Get in front of potential issues, before they cause real problems. Set your preferred warning and error thresholds, and PRTG will sound the alarm as soon as a device, application, or service is down. You can even automatically inform customers in real time if a potential outage might affect them.
Proactive planning
Knowledge is power. PRTG's monitoring data doesn't only help you spot and fix issues and optimize your network. Just as important, its wealth of historic data enables you to anticipate your network's medium and long-term needs. Which means you can plan ahead instead of scrambling to catch up.
Wide compatibility
PRTG works with most major manufacturers and infrastructure providers, including AWS, Azure, Cisco, Dell, Oracle, and HPE, and uses standard protocols to collect data. Can't find a preconfigured sensor for your preferred vendor or technology? Create your custom sensor using Python script.
What uptime monitoring looks like in PRTG
Diagnose network issues by continuously monitoring servers, routers, switches, applications, virtual machines, and other network components. Show uptime and other key stats in real time and visualize data in graphic maps & dashboards to identify problems more easily. Gain the visibility you need to troubleshoot bottlenecks, downtime, and other network performance problems.

Device tree view of the complete monitoring setup
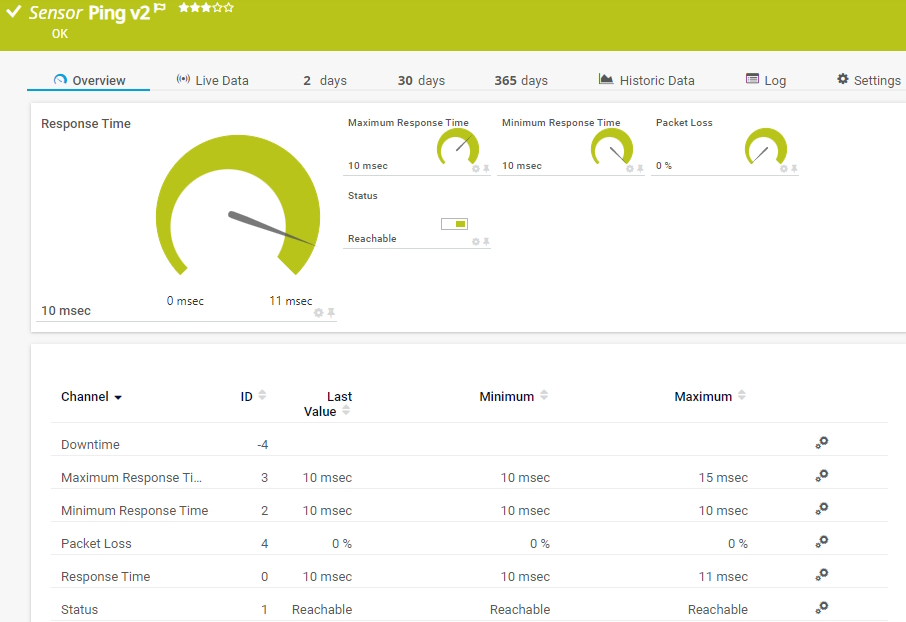
Ping v2 sensor in PRTG

Custom PRTG dashboard for keeping an eye on the entire IT infrastructure
Start uptime monitoring with PRTG and see how it can make your network more reliable and your job easier.
“All-around winning “The real beauty of PRTG is the endless possibilities it offers” “PRTG Network MonitorIT experts agree: Paessler PRTG is a great solution for IT infrastructure monitoring

network monitor”

is very hard to beat”
How to track your network's uptime with pinpoint accuracy
Server hardware. Applications. Website availability. Database performance. Customer-facing online services.
If it's connected to your network, PRTG will keep an eagle-eye out for availability and performance issues, continuously measuring uptime and alerting you promptly when you're at risk of downtime.
PRTG's dedicated uptime monitoring sensors include:
Ping v2
The Ping v2 sensor sends an ICMP echo request ("ping") from the probe system to the parent device to monitor its availability. It can show the following:
- Downtime
- Minimum and maximum response time
- Packet loss
- Ping time
- Target status: reachable or unreachable
SNMP Uptime v2
The SNMP Uptime v2 sensor monitors the uptime of a device via SNMP. It can show the following:
- Downtime
- System uptime
Windows System Uptime
The Windows System Uptime sensor monitors the uptime of a Windows system via WMI or Windows performance counters. It can show the following:
- Downtime
- System uptime
Your uptime monitor at a glance – even on the go
Set up PRTG in minutes and use it on almost any mobile device.


Easily find the source of the problem with our PRTG uptime monitoring solution
Real-time alerts and custom notifications make it easy to solve issues such as low availability, bottlenecks, downtime, and other network performance problems.
PRTG is compatible with all major vendors, products, and systems
![]()
Create innovative solutions with Paessler’s partners
Partnering with innovative vendors, Paessler unleashes synergies to create
new and additional benefits for joined customers.


With ScriptRunner, Paessler integrates a powerful event automation platform into PRTG Network Monitor.
ScriptRunner
“Excellent tool for detailed monitoring. Alarms and notifications work greatly. Equipment addition is straight forward and server initial setup is very easy. ...feel safe to purchase it if you intend to monitor a large networking landscape.”
Infrastructure and Operations Engineer in the Communications Industry, firm size 10B - 30B USD
PRTG makes monitoring uptime easy
Custom alerts and data visualizations make it easy to monitor, identify, and prevent slow response times, bottlenecks, downtime, and other network availability issues.
Monitor uptime: FAQ
What is uptime?
The term "uptime" is used in IT to define the period of time in which a computer system is functional and available. When referring to a network, uptime is defined in terms of the availability and reliability of servers and devices, or by domain and website availability. Most of the time, availability is displayed as a percentage. An availability of 90% measured over the course of a day means the system was functional and available for exactly 1296 minutes (21.6 hours) on that particular day.
What is the PRTG uptime monitoring tool?
PRTG is a proprietary software tool that tracks and analyzes uptime across your network. Available for Windows-based on-premises servers or as a cloud-hosted solution, it continuously monitors hardware and software availability, response times, latency, error rates, and other key performance metrics, so you can prevent bottlenecks and other network issues, and ensure you keep unplanned downtime to a minimum.
What is the preferred uptime value?
The gold standard is 99.999%. A network with 99.999% uptime has around 5.26 minutes of unplanned downtime in a given year. In practice, very few networks achieve that level of uptime consistently, with the most stable networks typically having 99.9% or 99.95% uptime – equal to around four to eight hours of unplanned downtime each year.
Of course, the more closely you monitor your network, the easier it is to achieve a high level of uptime. PRTG is designed to sound the alarm as soon as there are potential issues, so you can fix them before they cause a network outage.
Why should I monitor uptime?
Monitoring uptime is crucial for maintaining the health and performance of your systems. Regular uptime monitoring helps ensure that your services are consistently available to users.
Furthermore, by tracking uptime, you can quickly detect and address issues before they escalate. Monitoring uptime also provides insights into your system's performance, allowing you to identify and rectify bottlenecks or inefficiencies. Uptime metrics provide valuable data that can inform your IT and business strategies. With accurate uptime records, you can make informed decisions about capacity planning, resource allocation, and service improvements.
In addition, many businesses have Service Level Agreements (SLAs) that require a certain level of uptime. Monitoring helps you meet these obligations, avoid penalties, and demonstrate compliance to stakeholders.
What is a sensor in PRTG?
In PRTG, “sensors” are the basic monitoring elements. One sensor usually monitors one measured value in your network, for example the traffic of a switch port, the CPU load of a server, or the free space on a disk drive.
On average, you need about 5-10 sensors per device or one sensor per switch port.

PRTG: The multi-tool for sysadmins
Adapt PRTG individually and dynamically to your needs and rely on a strong API:- HTTP API: Access monitoring data and manipulate monitoring objects via HTTP requests
- Custom sensors: Create your own PRTG sensors for customized monitoring
- Custom notifications: Create your own notifications and send action triggers to external systems
- REST Custom sensor: Monitor almost everything that provides data in XML or JSON format
Paessler conducted trials in over 600 IT departments worldwide to tune its network monitoring software closer to the needs of sysadmins. We asked: would you recommend PRTG?
Over 95% of our customers say yes!
The result of the survey: over 95% of the participants would recommend PRTG – or already have.
Paessler PRTG is used by companies of all sizes. Sysadmins love PRTG because it makes their job a whole lot easier. Bandwidth, servers, virtual environments, websites, VoIP services – PRTG keeps an eye on your entire network. Everyone has different monitoring needs. That’s why we let you try PRTG for free.Still not convinced?
![]()
More than 500,000
sysadmins love PRTG![]()
Monitor your entire IT infrastructure
![]()
Try Paessler PRTG
for free
![]()
Start uptime monitoring with PRTG and see how it can make your network more reliable and your job easier.
|
PRTG |
Network Monitoring Software - Version 24.2.96.1375 (June 26th, 2024) |
|
Hosting |
Download for Windows and cloud-based version PRTG Hosted Monitor available |
Languages |
English, German, Spanish, French, Portuguese, Dutch, Russian, Japanese, and Simplified Chinese |
Pricing |
Up to 100 sensors for free (Price List) |
Unified Monitoring |
Network devices, bandwidth, servers, applications, virtual environments, remote systems, IoT, and more |
Supported Vendors & Applications |
|
Combining the broad monitoring feature set of PRTG with IP Fabric’s automated network assurance creates a new level of network visibility and reliability.