Custom alerts and data visualization let you quickly identify and prevent availability and performance issues of your virtual network devices.
They're the multi-tools of enterprise networks. Flexible. Versatile. Multifunctional.
And, because they're isolated from each other by design, a single virtual machine's failure won't bring the network down.
Accurate, highly customizable, and compatible with most major virtualization platforms, Paessler PRTG makes sure all your virtual servers work smoothly, and lets you know the second there's a risk something might go wrong so you can fix it double quick.
Because when your virtual machines are working as they should, your colleagues are happy… and so are you.

Managing an enterprise network is complicated enough, without having to continually flip between multiple monitoring environments. With the ability to monitor every hardware and software component, PRTG streamlines your workflow (and makes your life that much easier).
Get on with your day and let PRTG do the worrying. Once you pick your preferred warning and error thresholds, PRTG will watch them like a hawk and let you know if something's not right. Which means nothing will fall through the cracks, no matter how busy you are.
Is your IT infrastructure reaching capacity? Are there components that are past their prime? PRTG puts key VM performance data at your fingertips, so you can spot where you're under or over-resourced, and make better-informed decisions for the short, medium, and long term.
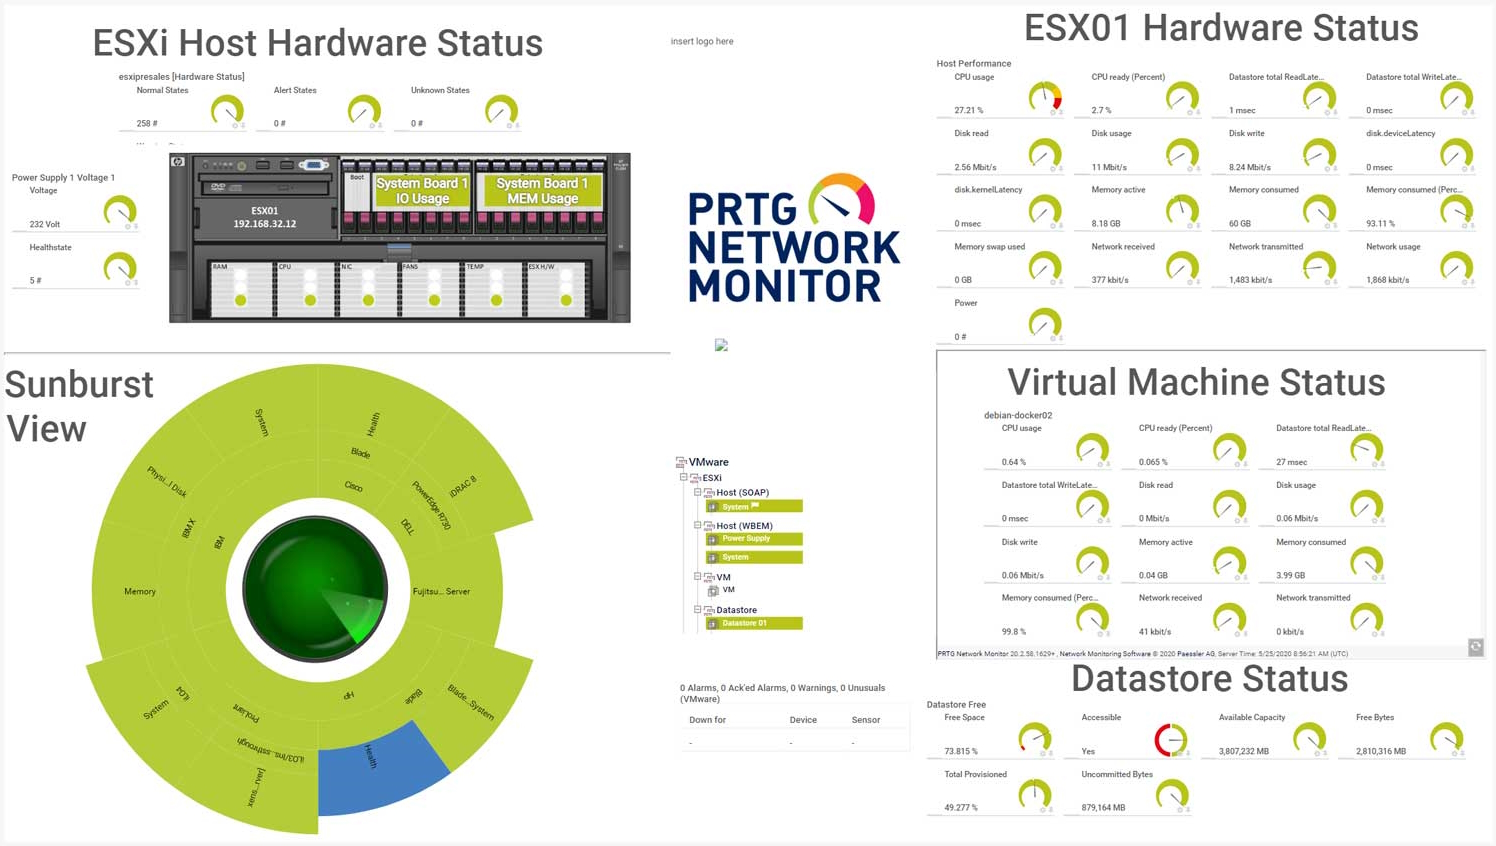
Diagnose network issues by continuously tracking the performance of virtual machines as well as the health of the physical hosts. Show availability, memory usage, CPU load, uptime, network data transfer speeds, and other key performance metrics in real time. Visualize collected data in clear graphs and dashboards to identify problems more easily. Gain the overview you need to troubleshoot all issues with your virtual IT environments.

Device tree view of the complete monitoring setup

Custom PRTG dashboard for keeping an eye on the entire IT infrastructure

Live traffic data graph in PRTG
Map virtualization monitoring with PRTG
“All-around winning
network monitor”
“The real beauty of PRTG is the endless possibilities it offers”
“PRTG Network Monitor
is very hard to beat”
PRTG comes with more than 250 native sensor types for monitoring your entire on-premises, cloud, and hybrid cloud environment out of the box. Check out some examples below!
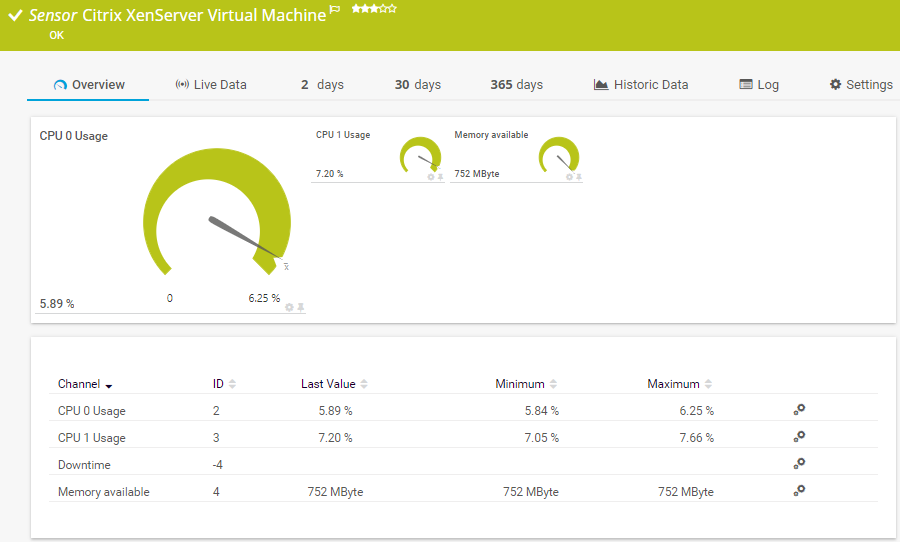
The Citrix XenServer Virtual Machine sensor monitors a virtual machine (VM) on a XenServer via HTTP. It can show the following:
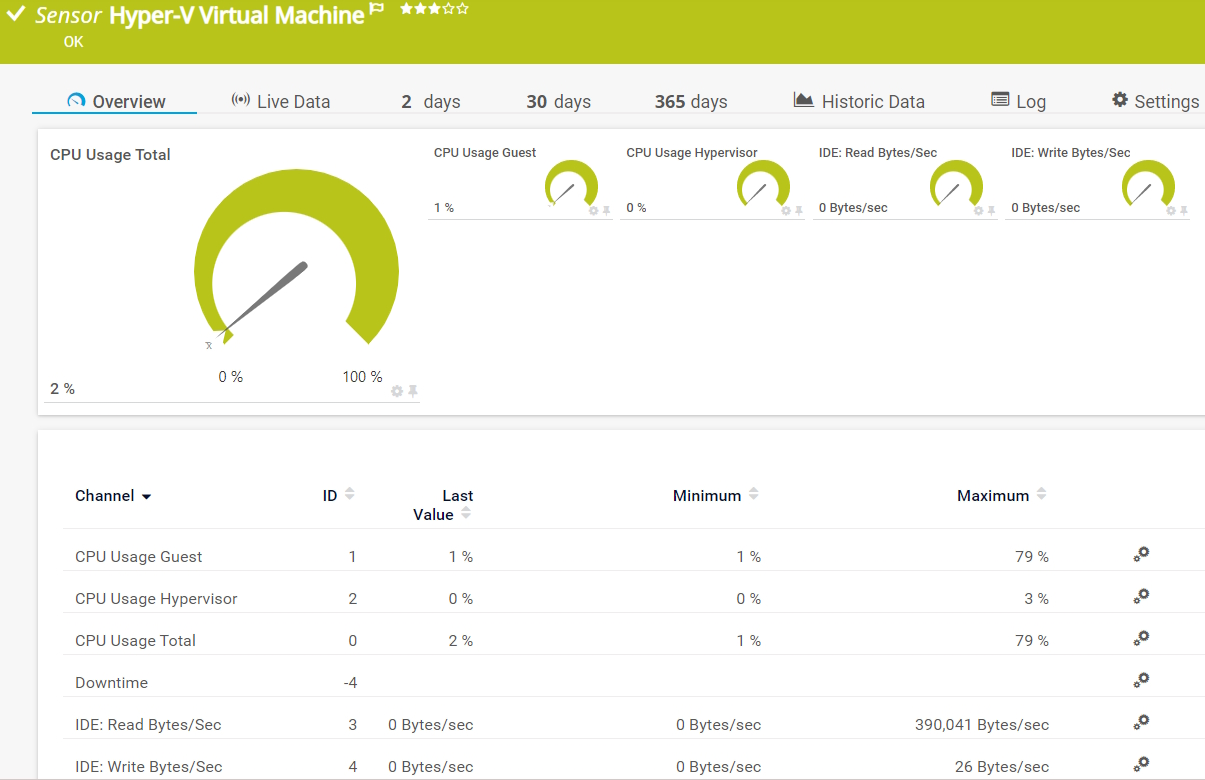
The Hyper-V Virtual Machine sensor monitors a virtual machine that runs on a Microsoft Hyper-V host server via WMI or Windows performance counters. It can show the following:
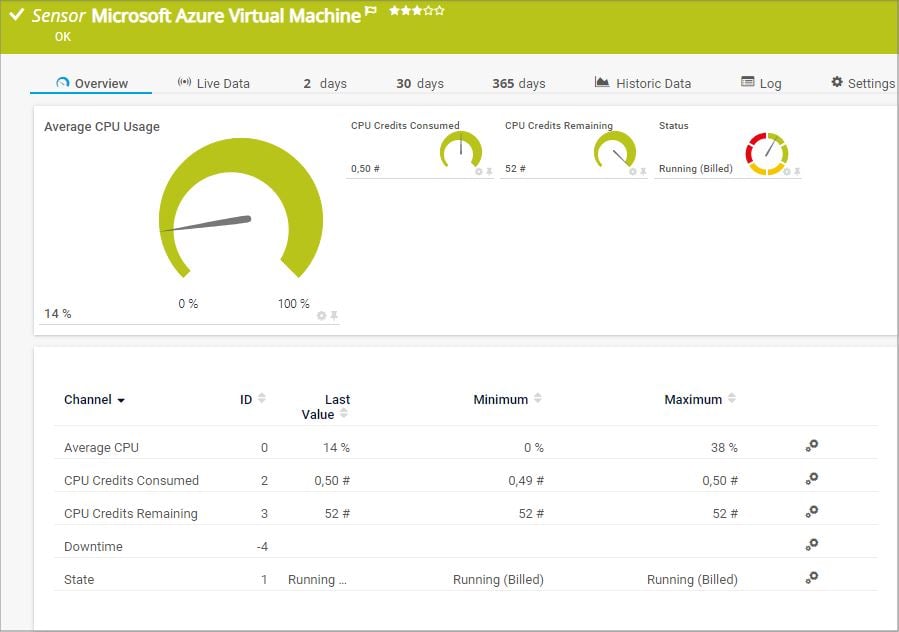
The Microsoft Azure Virtual Machine sensor monitors the status of a virtual machine (VM) in a Microsoft Azure subscription. It can show the following:
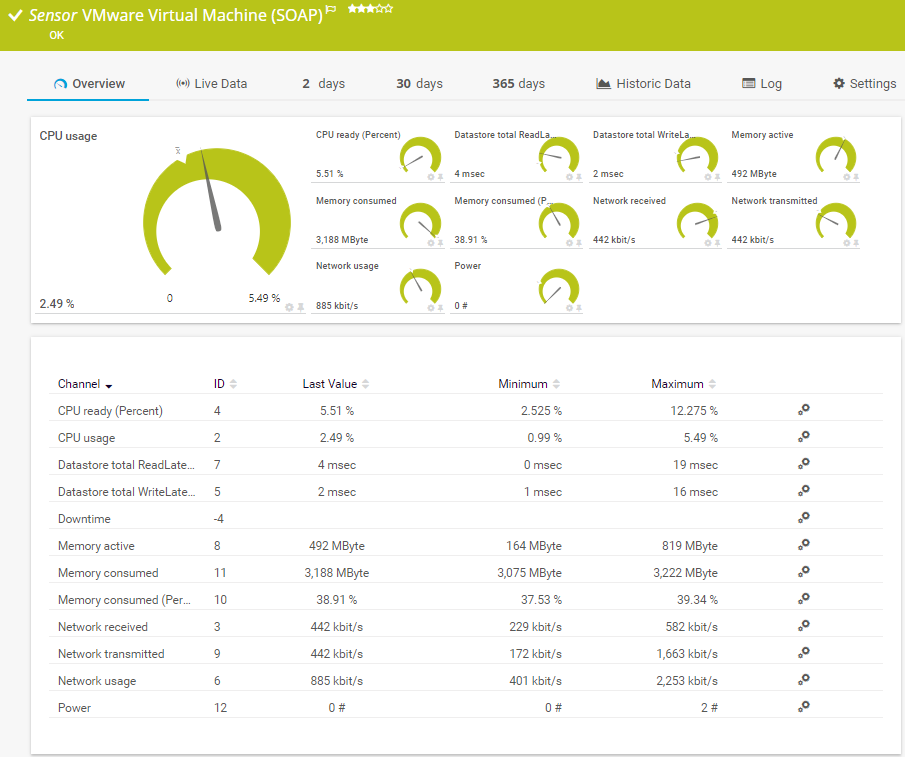
The VMware Virtual Machine (SOAP) sensor monitors a virtual machine (VM) on a VMware host server using the Simple Object Access Protocol (SOAP). It can show the following and more:
CPU readiness and usage
See the PRTG Manual for a list of all available sensor types.

Real-time notifications mean faster troubleshooting so that you can act before more serious issues occur.
PRTG is set up in a matter of minutes and can be used on a wide variety of mobile devices.

Paessler achieved VMware's highest level of endorsement due to our technological excellence, leading market position, and superior compatibility with VMware products.
What does this mean for you?
Partnering with innovative IT vendors, Paessler unleashes synergies to create
new and additional benefits for joined customers.
baramundi and PRTG create a secure, reliable and powerful IT infrastructure where you have everything under control - from the traffic in your firewall to the configuration of your clients.
Combining their tools to a powerful solution for advanced analysis and automation, KnowledgeRiver and Paessler enable IT teams to ensure best performance for their infrastructure and networks.
Siemon and Paessler bring together intelligent building technology and advanced monitoring and make your vision of intelligent buildings and data centers become reality.
Custom alerts and data visualization let you quickly identify and prevent availability and performance issues.
Network Monitoring Software – Version 26.1.116.1532 (February 9th, 2026)
Download for Windows and cloud-based version PRTG Hosted Monitor available
English, German, Spanish, French, Portuguese, Dutch, Russian, Japanese, and Simplified Chinese
Network devices, bandwidth, servers, applications, virtual environments, remote systems, IoT, and more
Choose the PRTG Network Monitor subscription that's best for you


A virtual machine (VM) is a software simulation of a physical computer that runs on a host system. It allows multiple operating systems to operate simultaneously on a single physical machine. Each VM functions as if it were an independent computer, with its own virtual hardware including CPU, memory, storage, and network interfaces. This isolation ensures that activities within one VM do not affect others, providing a secure and flexible environment for testing, development, and running multiple applications.
A VM monitor – or hypervisor – is a virtualization layer installed on a host system. This system usually corresponds to a hardware environment. The virtualization layer allows IT managers to control virtual machines running on the hypervisor as guest systems. Hypervisors make it possible to run multiple virtual machines on one main system and help manage the allocation of resources.
Paessler PRTG is proprietary software that tracks and analyzes the availability and performance of your virtual machines, hypervisors, and the servers they run on. Compatible with most major virtualization platforms, PRTG brings together memory usage and CPU load information, network data transfer speeds, and other key stats in one place, so you can easily monitor your virtual environments' health and ensure they run smoothly.
Any component you can think of. No, really. If it's connected to your network, PRTG probably has a sensor type (or more than one) you can use to keep an eye on it: routers, switches, applications, bandwidth, network traffic… With more than 250 preconfigured sensor types and the ability to create custom sensors, PRTG can monitor your organization's entire IT infrastructure, no matter how complex.
Comprehensive virtual machine monitoring delivers several critical advantages for enterprises. First, effective virtual machine monitoring enables proactive identification of resource bottlenecks before they impact performance. Second, proper virtual machine monitoring provides visibility into VM sprawl, helping organizations control costs by identifying unused or underutilized VMs.
Additionally, this approach supports capacity planning by tracking resource utilization trends, allowing IT teams to allocate resources more efficiently.
Virtual machine monitoring approaches vary significantly between on-premises and cloud deployments. On-premises virtual machine monitoring typically provides deeper access to host-level metrics and hypervisor data, while cloud-based virtual machine monitoring often relies on APIs provided by the service provider
Despite these differences, both environments benefit from centralized dashboards that consolidate performance data and automate alert notifications when issues arise.
In PRTG, “sensors” are the basic monitoring elements. One sensor usually monitors one measured value in your network, for example the traffic of a switch port, the CPU load of a server, or the free space on a disk drive. On average, you need about 5-10 sensors per device or one sensor per switch port.
Paessler conducted trials in over 600 IT departments worldwide to tune its network monitoring software closer to the needs of sysadmins. The result of the survey: over 95% of the participants would recommend PRTG – or already have.

Paessler PRTG is used by companies of all sizes. Sysadmins love PRTG because it makes their job a whole lot easier.
Bandwidth, servers, virtual environments, websites, VoIP services – PRTG keeps an eye on your entire network.
Everyone has different monitoring needs. That’s why we let you try PRTG for free.