Our users give top ratings for monitoring with Paessler PRTG


PRTG cloud monitoring platform: What you’ll find on this page

PRTG makes cloud monitoring easy
Custom alerts and data visualization make it easy to monitor, identify, and prevent cloud-related infrastructure issues.
Explore cloud application monitoring by PRTG
Cloud service & performance monitoring
Do you use cloud computing services in a variety of locations worldwide? Now you can check service accessibility and performance from your own location with Paessler PRTG’s Cloud HTTP v2 sensor.
It monitors the loading time of a web server from locations in Asia, Europe, and the USA, so you can determine your web service’s response times from all over the world.
Or do you want to keep an eye on the availability of your software as a service provider? Then our Common SaaS sensor has got you covered. It monitors the response times of several SaaS providers, for example Dropbox, GitHub, Google Apps, or Office 365.
Ping monitoring from the cloud
Whether you’re running your own services on-premises or relying on global-scale service providers, PRTG’s Cloud Ping v2 Sensor can check the TCP ping response times of your devices from multiple locations around the world, for example, from the Asia-Pacific region, Europe, or the USA.
- Ensure public-facing web services are available and performant
- Check the average response time for overall performance worldwide
- Be alerted in time to respond to problems before your customers even notice
Amazon Web Services monitoring
PRTG accesses the Amazon CloudWatch API, retrieves the data from every AWS account, and makes it centrally available. This makes PRTG the best choice for monitoring many different AWS accounts without having to constantly jump from one account to another.
PRTG comes with preconfigured AWS sensors out-of-the-box:
- The AWS Alarm v2 sensor to monitor the status of an AWS alarm
- The AWS Cost sensor for monitoring the cost of an AWS account
- The AWS EBS v2, AWS EC2 v2, AWS ELB v2, and AWS RDS v2 sensors to keep an eye on service performance
Microsoft cloud platform monitoring
If you use cloud computing services from Microsoft like Azure or Microsoft 365, PRTG has got you covered as well:
- The Microsoft Azure SQL Database sensor monitors the CPU, data input/output, and connections
- The Microsoft Azure Storage Account sensor checks capacity and latency
- The Microsoft Azure Subscription Cost sensor monitors the cost in an Azure subscription
- The Microsoft Azure Virtual Machine sensor keeps an eye on CPU usage and status
- The Microsoft 365 Service Status and Microsoft 365 Service Status Advanced sensors check the states of Microsoft services
What cloud monitoring looks like in PRTG
Diagnose network issues by continuously monitoring the status, cost, and availability of your cloud services. Show cloud application monitoring metrics in real time and visualize data in graphic maps & dashboards to identify problems more easily. Gain the visibility you need to troubleshoot cloud health issues.

Custom PRTG dashboard for monitoring the cloud and more
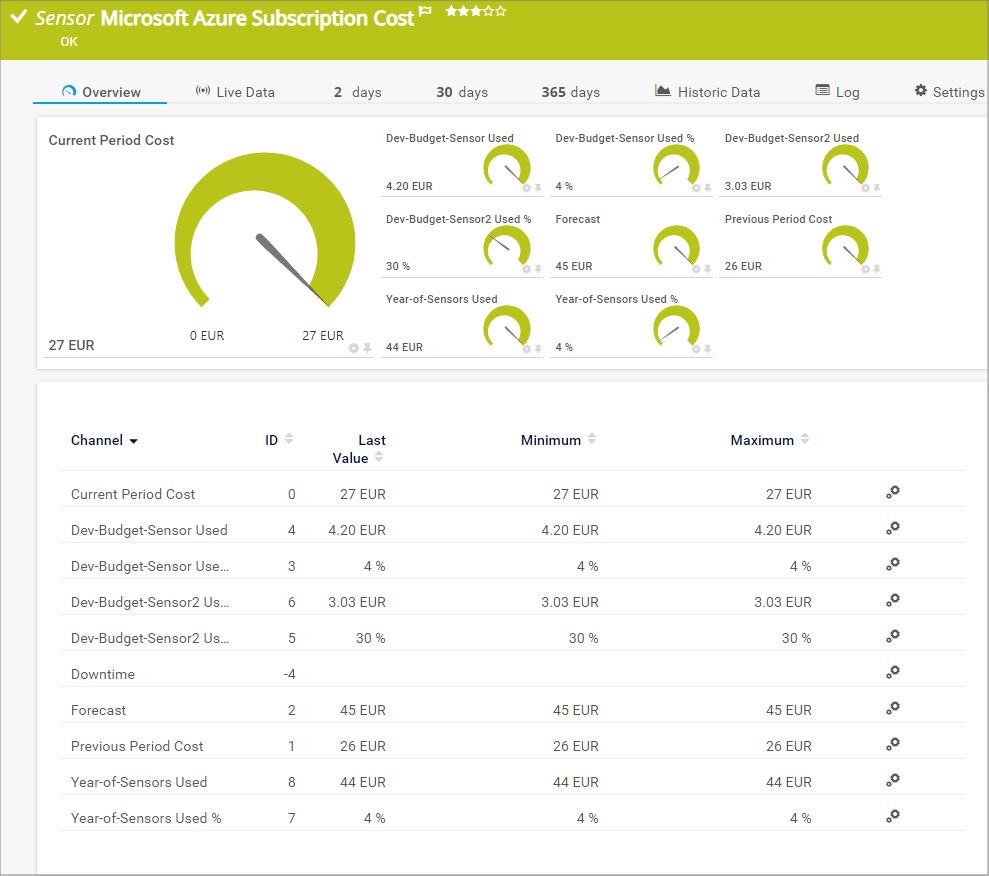
Microsoft Azure Subscription Cost sensor in PRTG

Overview of the complete monitoring setup
PRTG is compatible with all major vendors, products, and systems
![]()
Easily find the source of the problem with our PRTG cloud monitoring solution
Real-time alerts and custom notifications make it easy to solve issues with the health and availability of your cloud services.
Independent monitoring of cloud management services for all cloud strategies with PRTG
Monitor Infrastructure as a Service (IaaS) products
If you use cloud computing services such as AWS, Microsoft Azure, or Google Cloud, and need a comprehensive cloud monitoring tool, then PRTG makes sense for you.
Why? While Amazon offers its own CloudWatch solution for monitoring, for example, your IT department will often have separate accounts for different providers and services, which won’t be covered by CloudWatch.
With PRTG, all accounts from all IaaSs are monitored centrally. PRTG is a comprehensive cloud monitoring tool using a single pane of glass that you can read at a quick glance.
Keep an eye on Software as a Service (SaaS)
Many specialized departments require specific software for their work, software which is often only offered as a SaaS solution. Also, many companies are switching to services such as Microsoft 365. In fact, many email services are also cloud-based solutions.
In this case, an independent cloud monitoring software also makes sense. Why? As with IaaS, PRTG offers comprehensive cloud application monitoring that is easy and quick to configure.
Check Platform as a Service (PaaS) products
Several PaaS services provide an environment for developers. These services can be used without any major administrative hassles or costly acquisition fees.
Here, too, a cloud monitoring platform makes sense. Why? Development work is highly sensitive, and system failures will incur high costs – especially when it’s not clear where the problem lies.
With PRTG, administrators instantly have everything in check and can immediately tell if issues result from the PaaS system, a malfunctioning router, or from somewhere completely different.
IT experts agree: Paessler PRTG is a great solution for IT infrastructure monitoring

“All-around winning
network monitor”

“The real beauty of PRTG is the endless possibilities it offers”

“PRTG Network Monitor
is very hard to beat”
5 reasons to choose PRTG as your cloud management tool
Create central cloud monitoring overviews
Using a separate monitoring tool for every cloud service is inconvenient. All-in-one cloud monitoring with PRTG solves this problem as you’ll have everything under control from a central dashboard. You can even create custom dashboards and maps to have all the information you need at a glance.
Reap cost benefits from cloud solutions
Many administrators use cloud services to save money. But when system failures occur, cost benefits quickly disappear – particularly if determining the cause of the failure is cumbersome. With PRTG, you’ll reap the cost benefits of your cloud strategy as it alerts you before any real damage is done.
Bolster your monitoring autonomy
Increasing reliance on cloud-based “X-as-a-Service” offerings means it’s not always obvious where your service instances are being delivered from. Many cloud service providers operate from data centers worldwide. With PRTG, you’ll have your own cloud monitoring tool with a customizable configuration to effectively adapt to your on-premises, cloud, or hybrid infrastructure.
Erase all doubt about the cloud
Many IT or development departments have doubts regarding the use of cloud services due to overdependence or the risk of system failures. With PRTG, you get a vendor-independent, unified monitoring tool that keeps an eye on all cloud service products and cloud computing platforms alike.
Get peace of mind 24/7/365
PRTG notifies you only if a threshold value is exceeded. You won’t be bombarded with daily email status updates just to let you know everything is OK (unless you opt for this feature). This way, you are free to complete your work in peace, knowing you will be immediately alerted of any problem.
Your cloud monitor at a glance – even on the go
Set up PRTG in minutes and use it on almost any mobile device.


Start cloud service monitoring with PRTG and see how it can make your network more reliable and your job easier.
Create innovative solutions with Paessler’s partners
Partnering with innovative vendors, Paessler unleashes synergies to create
new and additional benefits for joined customers.
mioty alliance
Paessler is member of the mioty alliance, composed of companies that use mioty to create innovative IoT and IIoT solutions such as the retrofitting of industrial environments.
“Excellent tool for detailed monitoring. Alarms and notifications work greatly. Equipment addition is straight forward and server initial setup is very easy. ...feel safe to purchase it if you intend to monitor a large networking landscape.”
Infrastructure and Operations Engineer in the Communications Industry, firm size 10B - 30B USD
Easily find the source of the problem with our PRTG cloud monitoring solution
Real-time alerts and custom notifications make it easy to solve issues with the health and availability of your cloud services.
Monitor the cloud: FAQ
1. What is cloud monitoring?
Cloud monitoring is the process of overseeing and managing the performance, availability, and security of applications and infrastructure hosted in a cloud environment. It involves tracking various metrics, logs, and events to ensure optimal functioning, identify potential issues, and facilitate timely responses to maintain a reliable and efficient cloud infrastructure.
Cloud monitoring tools like PRTG enable real-time visibility, analysis, and proactive management of resources in the cloud.
2. What are benefits of cloud monitoring tools?
Tools for monitoring cloud services have various benefits:
- Real-time visibility: Cloud monitoring tools provide real-time insights into the performance and health of cloud resources, allowing organizations to promptly detect and address issues.
- Optimized performance: By continuously monitoring metrics such as resource utilization, response times, and error rates, these tools help optimize the performance of applications and infrastructure for better user experiences.
- Cost optimization: Cloud monitoring tools assist in tracking resource utilization and identifying areas for cost savings by optimizing resource allocation, which helps organizations manage their cloud spending efficiently.
- Security and compliance: Monitoring tools contribute to the overall security of the cloud environment by detecting and alerting on unusual activities, potential security threats, and ensuring compliance with regulatory requirements.
- Proactive issue resolution: With automated alerts and notifications, cloud monitoring tools enable proactive issue resolution, minimizing downtime and enhancing the overall reliability and availability of cloud-based services.
3. Is there a limit to monitoring the cloud with PRTG?
No, there isn’t. PRTG monitors all cloud services, no matter the vendor or cloud provider. It comes with preconfigured sensors for monitoring AWS, Microsoft Azure, and Microsoft 365 for easier integration. However, using one of the many custom sensors of PRTG, you can keep an eye on any cloud-based resource you like.
4. Is cloud monitoring with PRTG free?
Yes and no. PRTG is proprietary monitoring software that offers various licenses for infrastructures of all sizes in on-premises, cloud, and hybrid environments. However, there is also a freeware edition of PRTG that includes 100 sensors at no cost for life.
5. What is a sensor in PRTG?
In PRTG, “sensors” are the basic monitoring elements. One sensor usually monitors one measured value in your network, for example the traffic of a switch port, the CPU load of a server, or the free space on a disk drive.
On average, you need about 5-10 sensors per device or one sensor per switch port.
More than just a monitoring tool:
Reasons our customers love PRTG


Still not convinced?
![]()
More than 500,000
sysadmins love PRTG
Paessler PRTG is used by companies of all sizes. Sysadmins love PRTG because it makes their job a whole lot easier.
![]()
Monitor your entire IT infrastructure
Bandwidth, servers, virtual environments, websites, VoIP services – PRTG keeps an eye on your entire network.
![]()
Try Paessler PRTG
for free
Everyone has different monitoring needs. That’s why we let you try PRTG for free.
![]()
Start cloud service monitoring with PRTG and see how it can make your network more reliable and your job easier.
|
PRTG |
Network Monitoring Software - Version 24.2.96.1375 (June 26th, 2024) |
|
Hosting |
Download for Windows and cloud-based version PRTG Hosted Monitor available |
Languages |
English, German, Spanish, French, Portuguese, Dutch, Russian, Japanese, and Simplified Chinese |
Pricing |
Up to 100 sensors for free (Price List) |
Unified Monitoring |
Network devices, bandwidth, servers, applications, virtual environments, remote systems, IoT, and more |
Supported Vendors & Applications |
|