![]()
Optimize your Cisco network – fully-integrated with PRTG
- Monitor your Cisco routers and switches out of the box
- Includes preconfigured sensors designed just for Cisco devices
- Increase the security of your network and the quality of your service
Our users give top ratings for monitoring with Paessler PRTG


PRTG Cisco monitoring: What you’ll find on this page

- Get in-depth insight into your Cisco network with PRTG sensors
- Cisco performance monitoring: Keep an eye on routers, switches, and ports
- What Cisco network monitoring looks like in PRTG
- Get started in minutes with our predefined Cisco sensors
- 7 reasons to choose PRTG as your Cisco monitoring tool
- Monitor Cisco: FAQ
PRTG makes Cisco network monitoring easy
Custom alerts and data visualization make it easy to monitor, identify, and prevent Cisco network health, availability, and performance issues.
Get in-depth insight into your Cisco network with PRTG sensors
As a Cisco Development Select Partner, Paessler PRTG is fully integrated with the Cisco ecosystem and comes with specially developed sensors for Cisco devices out of the box. By professionally monitoring Cisco-related parameters, you can exhaust all its possibilities:
- Effortlessly obtain an overview of the Cisco system status
- Get comprehensive reports on device status and your Cisco hardware like routers or switches
- Gain valuable information on network traffic, connections, and users
- Ensure system health, high performance, connection stability, and application security in your Cisco networks
Additional sensors use Cisco-specific NetFlow technology for traffic monitoring. From ADSL to VPN connections, all the way to VoIP applications: PRTG ensures the quality of your service and helps everyone work with peace of mind.
Cisco performance monitoring: Keep an eye on routers, switches, and ports
Cisco router monitoring
Cisco routers are extremely stable and offer high levels of security, which makes them popular with sysadmins. With PRTG, you can easily monitor your Cisco routers using NetFlow or SNMP.
Cisco switch monitoring
Cisco switches can often cause bottlenecks in a network. If a Cisco switch malfunctions or becomes overloaded, the entire network can suffer. Avoid this with professional switch monitoring, which automatically alerts you if problems arise and helps you avoid downtime.
Cisco port monitoring
PRTG uses NetFlow, SNMP, and packet sniffing to monitor open and closed ports. This helps you know if your Cisco ports are working properly, and determines how much (and which) traffic is flowing through the ports.
Cisco QoS monitoring
Monitor the quality of service of your Cisco devices with our built-in sensor for keeping an eye on Cisco CBQoS metrics, which uses data from Cisco’s Class-Based Quality of Service.
Cisco IP SLA monitoring
For Cisco devices that support IP SLA, you can use a preconfigured PRTG sensor for checking Cisco IP SLA parameters. Easily monitor your service level agreements and quality of service with PRTG.
![]() A service-level agreement (SLA) is a legally enforceable contract between a service provider and its customers. It documents the level of service expected from the service provider and outlines the expectations and requirements the customer has. An SLA defines the metrics by which the quality of services is measured, the penalties that may be incurred should the agreed-on service levels not be achieved, and resolutions to any SLA failures. Read more
A service-level agreement (SLA) is a legally enforceable contract between a service provider and its customers. It documents the level of service expected from the service provider and outlines the expectations and requirements the customer has. An SLA defines the metrics by which the quality of services is measured, the penalties that may be incurred should the agreed-on service levels not be achieved, and resolutions to any SLA failures. Read more
What Cisco network monitoring looks like in PRTG
Diagnose network issues by continuously monitoring the performance and health of your Cisco devices. Show bandwidth, traffic, VoIP, hardware health parameters, and more in real time and visualize data in graphic maps & dashboards to identify problems more easily. Gain the visibility you need to troubleshoot all kinds of issues with your Cisco network.

Device tree view of the complete monitoring setup
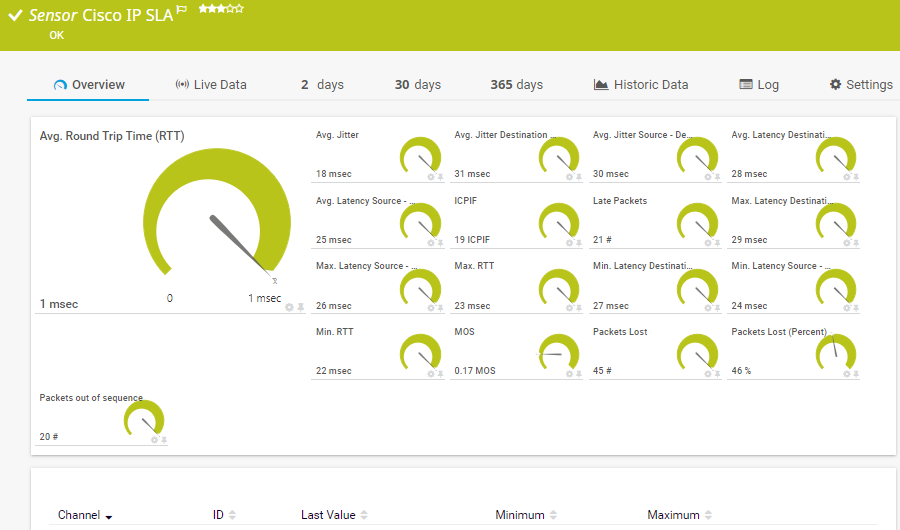
Preconfigured Cisco IP SLA sensor in PRTG
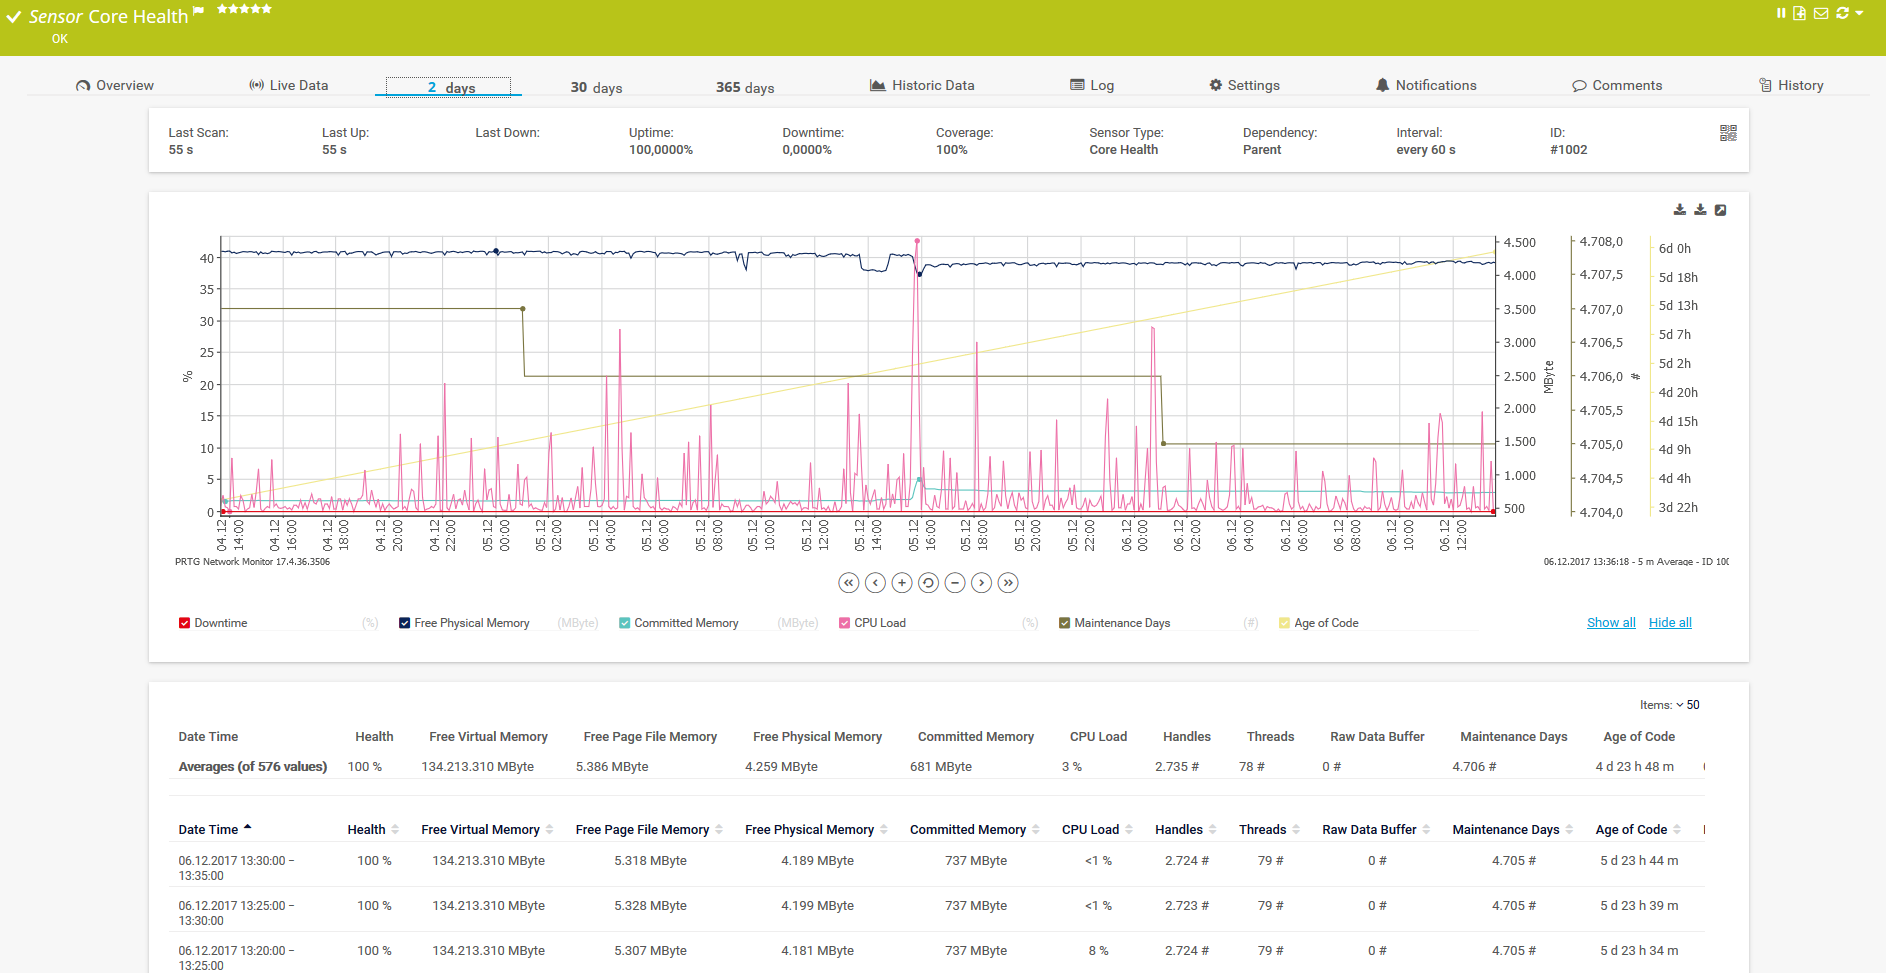
2-days historical data graph of the Core Health sensor in PRTG
Start monitoring Cisco devices with PRTG and see how it can make your network more reliable and your job easier.
“All-around winning “The real beauty of PRTG is the endless possibilities it offers” “PRTG Network MonitorIT experts agree: Paessler PRTG is a great solution for IT infrastructure monitoring

network monitor”

is very hard to beat”
Cisco IP SLA
The Cisco IP SLA sensor monitors Voice over IP (VoIP) network parameters using IP service level agreements (SLA) from Cisco. It can show the following:
SNMP Cisco ADSL
The SNMP Cisco ADSL sensor monitors asymmetric digital subscriber line (ADSL) statistics of a Cisco router. It can show the following:
- Local and remote attenuation
- Local and remote power output
- Local and remote SNR
- Downlink and uplink speed
SNMP Cisco CBQoS
The SNMP Cisco CBQoS sensor monitors network parameters using Cisco's Class Based Quality of Service (CBQoS). It can show the following:
- Current and maximum queue depth
- Number of drop packets (without buffer)
- Drop size
- Pre-policy and post-policy size
- Number of pre-policy packets
SNMP Cisco System Health
The SNMP Cisco System Health sensor monitors the system health of a Cisco device. It can show the following:
SNMP Cisco ASA
There are three preconfigured sensor types for monitoring a Cisco ASA:
SNMP Cisco ASA VPN Traffic
The SNMP Cisco ASA VPN Traffic sensor monitors the traffic of an Internet Protocol Security (IPsec) VPN connection on a Cisco Adaptive Security Appliance. It can show the following:
- Total traffic
- Incoming traffic
- Outgoing traffic
SNMP Cisco ASA VPN Connections
The SNMP Cisco ASA VPN Connections sensor monitors the VPN connections on a Cisco Adaptive Security Appliance. It can show the following:
- Number of active email IPsec, L2L, SVC, and LB sessions
- Total number of active sessions
- Number of active (WebVPN) users
- Number of groups with active users
SNMP Cisco ASA VPN Users
The SNMP Cisco ASA VPN Users sensor monitors account connections to a VPN on a Cisco Adaptive Security Appliance. It can show the following:
- Account status
- Number of connected accounts
SNMP Cisco System Health
The SNMP Cisco System Health sensor monitors the system health of a Cisco device. It can show the following:
SNMP Cisco UCS
There are four preconfigured sensor types for monitoring a Cisco UCS:
SNMP Cisco UCS Blade
The SNMP Cisco UCS Blade sensor monitors the health status of a Cisco Unified Computing System blade server. It can show the following:
- Oper status
- Operability status
- Power status
SNMP Cisco UCS Chassis
The SNMP Cisco UCS Chassis sensor monitors the health status of the chassis of a Cisco Unified Computing System device. It can show the following:
- Configuration status
- License status
- Oper status
- Operability status
- Power status
- The serial electrically erasable programmable read-only memory (SEEPROM) state
- Thermal status
SNMP Cisco UCS Physical Disk
The SNMP Cisco UCS Physical Disk sensor monitors a physical disk of a Cisco Unified Computing System device. It can show the following:
- Operability status
- Connection status
SNMP Cisco UCS System Health
The SNMP Cisco UCS System Health sensor monitors the system health of a Cisco Unified Computing System device. It can show the following:
- Number of minor, major, and critical faults
- Predicted fan, fan module, and power supply failure status
- Fan module and power supply performance and thermal status
- Number of operable and inoperable fan modules and power supplies
- Fan performance and thermal status
- Power supply voltage status
NetFlow v5/v9 and IPFIX
NetFlow v5/v9 and IPFIX
The NetFlow v5, the NetFlow v9, and the IPFIX sensors receive traffic data from a device compatible with NetFlow v5, NetFlow v9, or IPFIX, and show the traffic by type.
The sensors have several filter options to divide traffic into different channels.
PRTG makes Cisco network monitoring easy
Custom alerts and data visualization make it easy to monitor, identify, and prevent Cisco network health, availability, and performance issues.
PRTG is compatible with all major vendors, products, and systems
![]()
7 reasons to choose PRTG as your Cisco monitoring tool
Easy VoIP benchmarking
PRTG pre-calculates specific parameters (e.g. ICPIF, MOS) right from the analysis stage because they are especially prone to data delays and losses. This makes it easier to directly perform benchmarking without additional calculations.
Complete quality assurance
By merging all relevant parameters in just a few PRTG sensors, you can easily measure the service quality of your Cisco network and use your findings to make sound future planning decisions.
IPsec VPN connections overview
For Cisco devices with Adaptive Security Appliance (ASA), you get an easy-to-read overviewof traffic, users, and IPsec-secured VPN connections. Finding out which users are online and offline is a cinch with PRTG.
System health at a glance
With PRTG, you get a clear and reliable overview of all necessary system health metrics, including temperature, CPU load, power supply status, fan status, and available memory.
Custom alerts & notifications
If an error occurs in your network or if one of your self-defined warning or error thresholds is exceeded, you’ll be notified immediately the way you want, including email, SMS, or in-app push notification.
Automation for a lighter workload
You no longer need to take the time to check each and every Cisco device manually due to PRTG’s easily configured sensors, customizable notifications, and individually created dashboards and maps.
Enhanced network security
Thanks to our Cisco-specific and clear-cut monitoring, you’ll be quicker to spot network security loopholes in your Cisco devices and prevent emergencies.


Easily find the source of the problem with our PRTG Cisco monitoring solution
Real-time alerts and custom notifications make it easy to solve issues with your Cisco hardware, traffic, and VoIP.
Your Cisco monitor at a glance – even on the go
Set up PRTG in minutes and use it on almost any mobile device.


Create innovative solutions with Paessler’s partners
Partnering with innovative vendors, Paessler unleashes synergies to create
new and additional benefits for joined customers.

With the combination of PRTG and Insys, the monitoring specialist Paessler and the industrial gateway manufacturer INSYS icom offer a practical possibility to merge IT and OT.
INSYS icom

“Excellent tool for detailed monitoring. Alarms and notifications work greatly. Equipment addition is straight forward and server initial setup is very easy. ...feel safe to purchase it if you intend to monitor a large networking landscape.”
Infrastructure and Operations Engineer in the Communications Industry, firm size 10B - 30B USD
PRTG makes Cisco network monitoring easy
Custom alerts and data visualization make it easy to monitor, identify, and prevent Cisco network health, availability, and performance issues.
Monitor Cisco: FAQ
What is Cisco monitoring?
Cisco monitoring refers to the process of observing and managing Cisco network devices and services to ensure optimal performance, reliability, and security. This involves using specialized software tools like Paessler PRTG to track the health, status, and activity of routers, switches, firewalls, and other network components.
Key metrics include bandwidth usage, device uptime, latency, and error rates. Cisco monitoring helps detect issues earlier and become more proactive in troubleshooting.
How does Cisco monitoring with PRTG work?
PRTG uses SNMP and flow technologies to monitor Cisco devices.
SNMP
The Simple Network Management Protocol (SNMP) is the easiest way to monitor your network. Network and CPU loads are minimal, however an analysis with regard to protocol or an IP address is impossible. Use this protocol whenever you can for the most efficient monitoring.
NetFlow
NetFlow is a Cisco technology which minimizes bandwidth consumption by determining bandwidth usage within a device and collectively transmitting it to PRTG. NetFlow offers a higher degree of detail (e.g. per network protocol/IP address) than SNMP, and because of its low consumption, it is ideal for Cisco networks with a large amount of traffic.
How should I configure my Cisco devices to provide for the smoothest possible monitoring?
Find frequent questions and answers about Cisco monitoring also in our Knowledge Base:
- Does my Cisco device (Router/Switch) support NetFlow Export?
- Do you have any configuration tips for Cisco routers and PRTG?
- Is it possible to monitor Cisco ASA Firewalls using Netflow 9 and PRTG?
- How do I monitor Cisco ASA Firewalls using Netflow 9 and PRTG?
- What are the right NetFlow settings? Ingress vs. Egress
Why should I use PRTG instead of Cisco Prime Network Analysis?
Cisco’s own monitoring software, Cisco Prime Network Analysis Module, cannot monitor hardware from other manufacturers the way PRTG can. Since many sysadmins manage IT infrastructures that contain hardware from a variety of manufacturers, it’s essential to use a monitoring tool like PRTG which incorporates the technology you’ll need to monitor almost any hardware. And with PRTG, you can view all monitoring data together on an easy-to-read dashboard.
What is a sensor in PRTG?
In PRTG, “sensors” are the basic monitoring elements. One sensor usually monitors one measured value in your network, for example the traffic of a switch port, the CPU load of a server, or the free space on a disk drive.
On average, you need about 5-10 sensors per device or one sensor per switch port.

PRTG: The multi-tool for sysadmins
Adapt PRTG individually and dynamically to your needs and rely on a strong API:- HTTP API: Access monitoring data and manipulate monitoring objects via HTTP requests
- Custom sensors: Create your own PRTG sensors for customized monitoring
- Custom notifications: Create your own notifications and send action triggers to external systems
- REST Custom sensor: Monitor almost everything that provides data in XML or JSON format
Paessler conducted trials in over 600 IT departments worldwide to tune its network monitoring software closer to the needs of sysadmins. We asked: would you recommend PRTG?
Over 95% of our customers say yes!
The result of the survey: over 95% of the participants would recommend PRTG – or already have.
Paessler PRTG is used by companies of all sizes. Sysadmins love PRTG because it makes their job a whole lot easier. Bandwidth, servers, virtual environments, websites, VoIP services – PRTG keeps an eye on your entire network. Everyone has different monitoring needs. That’s why we let you try PRTG for free.Still not convinced?
![]()
More than 500,000
sysadmins love PRTG![]()
Monitor your entire IT infrastructure
![]()
Try Paessler PRTG
for free
![]()
Start monitoring Cisco devices with PRTG and see how it can make your network more reliable and your job easier.
|
PRTG |
Network Monitoring Software - Version 24.2.96.1375 (June 26th, 2024) |
|
Hosting |
Download for Windows and cloud-based version PRTG Hosted Monitor available |
Languages |
English, German, Spanish, French, Portuguese, Dutch, Russian, Japanese, and Simplified Chinese |
Pricing |
Up to 100 sensors for free (Price List) |
Unified Monitoring |
Network devices, bandwidth, servers, applications, virtual environments, remote systems, IoT, and more |
Supported Vendors & Applications |
|