Custom alerts and data visualization let you quickly identify and prevent PLC hardware health and performance issues.
PLCs are the backbone of industrial automation. As they operate in real time, meaning they process input signals and execute control functions with minimal delay, they are crucial for time-sensitive industrial processes.
But what happens if you have issues with PLCs – if they stop working or are lacking in performance? Production processes come to a standstill, unintended operations occur, machinery breaks down – and costs pile up to uncontrollable heights.
This is where Paessler PRTG comes into play. Our PLC monitoring solution keeps an eye on your programmable logic controllers as well as your entire OT environment round the clock, making sure that issues are detected before they become business critical and costly.

Diagnose network issues by continuously tracking the health and performance of your programmable logic controllers next to other industrial IT and IoT components like HMIs or SCADA systems Show I/O states, hardware parameters, PLC program functionality, bandwidth, environmental values, network traffic, and other key metrics in real time. Visualize monitoring data in clear graphs and dashboards to identify problems more easily. Gain the overview you need to troubleshoot all kinds of issues with your PLCs.
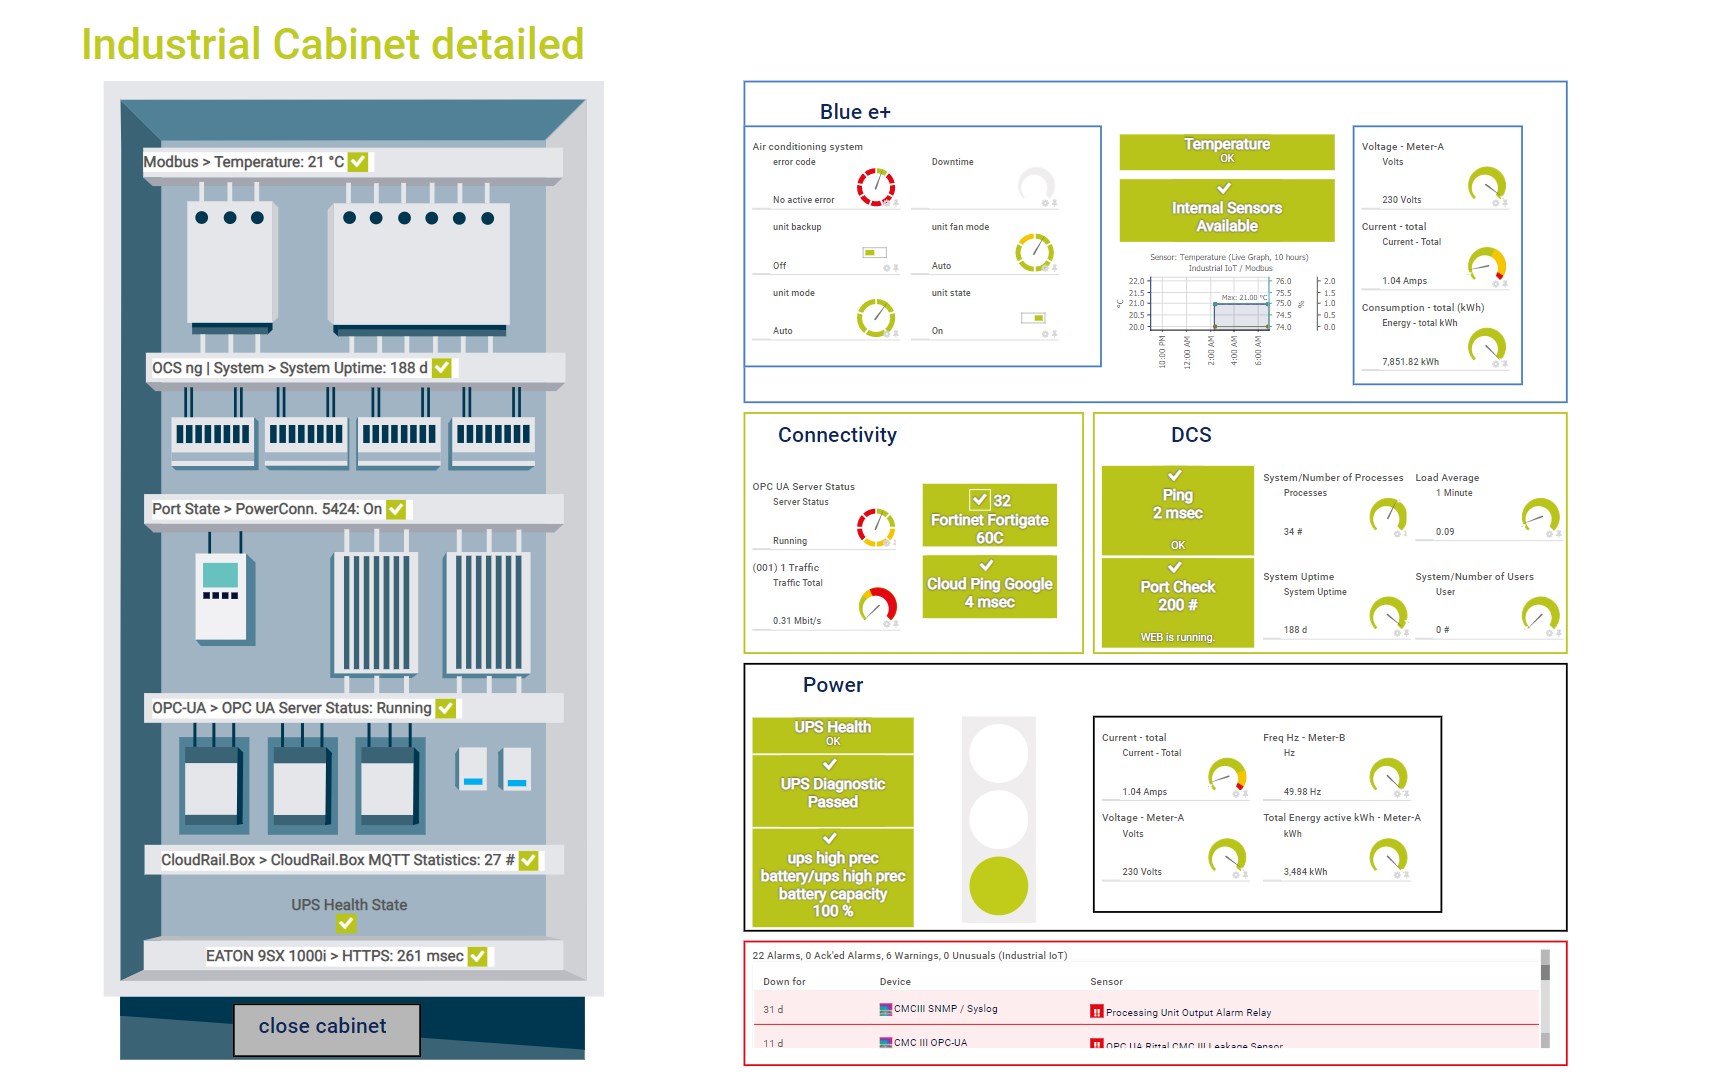
Custom PRTG dashboard for an industrial cabinet
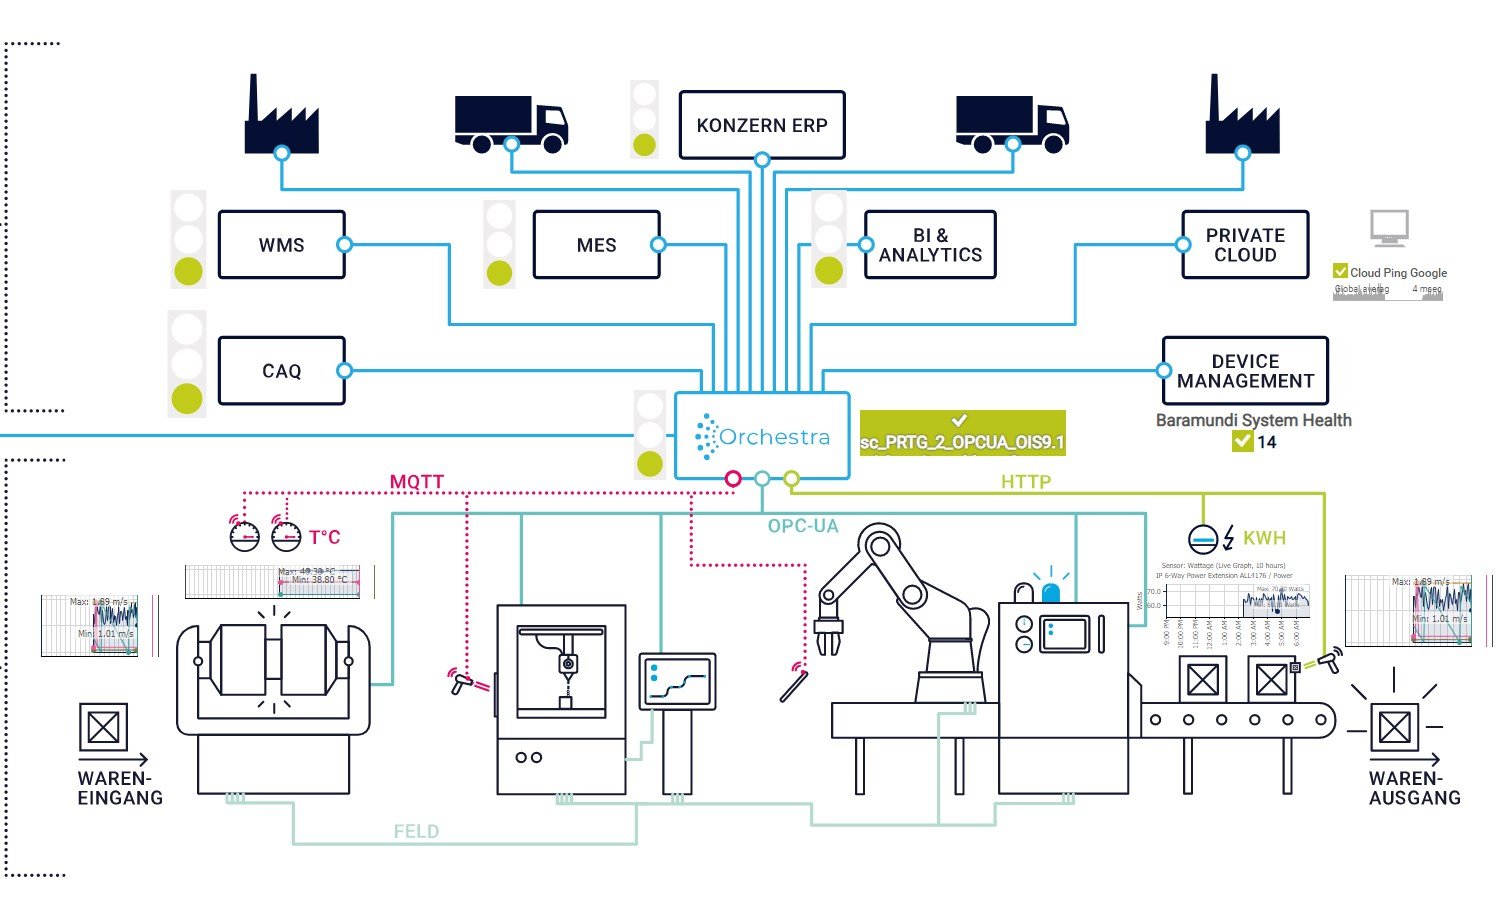
Custom PRTG map of an Orchestra environment

Device tree view of the complete monitoring setup

Custom PRTG dashboard for keeping an eye on the entire IT infrastructure

Live traffic data graph in PRTG
Awarded 3rd place in the
Software & IT category
Winner in the Software &
Computers category
PRTG's comprehensive protocol support ensures compatibility with a wide range of industrial devices and systems.
Whether your PLCs communicate via OPC UA, Modbus TCP/IP, Modbus RTU Serial, MQTT, or other industry-standard protocols over gateways, PRTG can seamlessly integrate and gather essential data for monitoring purposes.Something powerful?
Configure alerts based on predefined conditions or thresholds so that PRTG can notify you via SMS, email, in-app push notification, and other methods as soon as a warning or error threshold is breached.
With our product extension Paessler PRTG OPC UA Server, you can even integrate alarms from PRTG in your supervisory and control system using OPC UA
PRTG enhances your monitoring even further with highly customizable dashboards and maps that give you visual real-time insights into the performance and status of your PLCs and your entire industrial infrastructure.
Use our drag-and-drop editor to quickly create personalized views of your PLC health, and publish them internally or over the Internet.
PRTG comes with more than 250 native sensor types for monitoring your entire on-premises, cloud, and hybrid cloud environment out of the box. Check out some examples below!
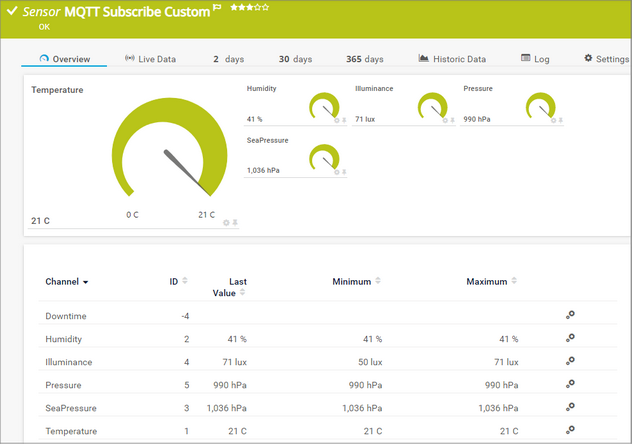
The MQTT Subscribe Custom sensor subscribes to a Message Queue Telemetry Transport (MQTT) topic and monitors up to ten numeric values from the received JSON data. It can show the following:
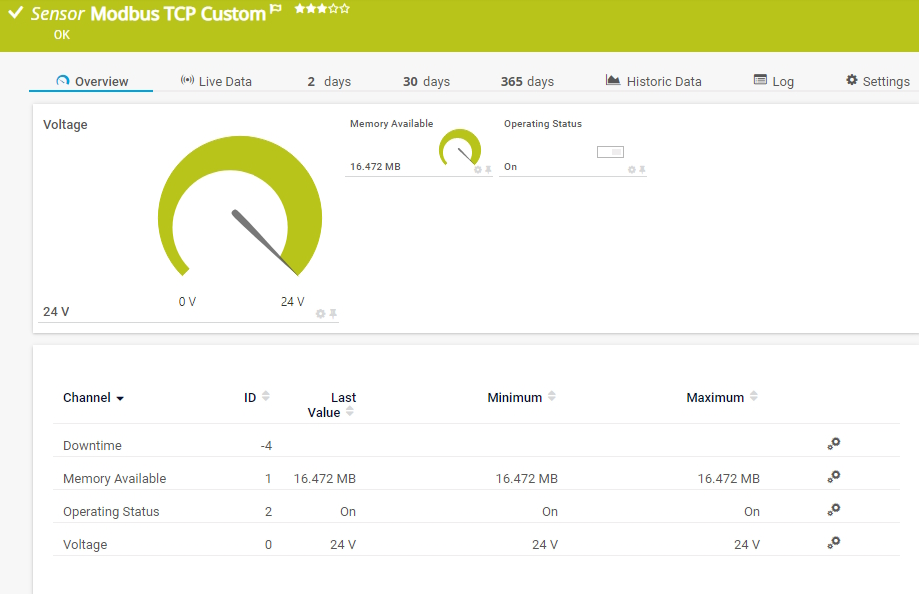
The Modbus TCP Custom sensor connects to a Modbus Transmission Control Protocol (TCP) server and monitors up to ten returned numeric values. It can show the following:
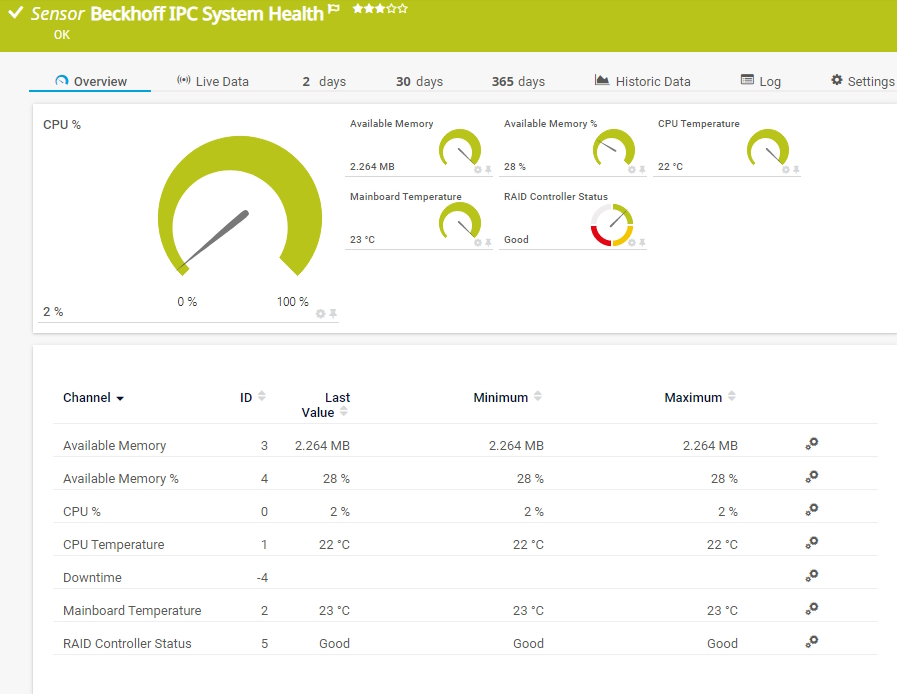
The Beckhoff IPC System Health sensor monitors the system health of a Beckhoff Industrial PC (IPC) via OPC Unified Architecture (OPC UA). It can show the following:
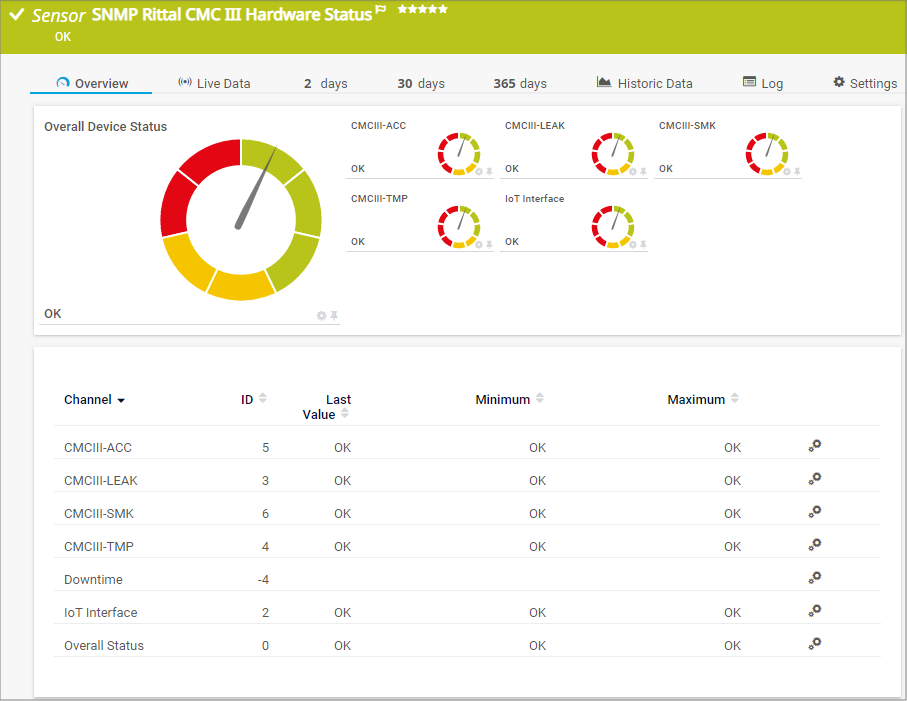
The SNMP Rittal CMC III Hardware Status sensor monitors the overall status of Rittal data center hardware, for example Rittal Computer Multi Control version 3 (CMC III) processing units, Rittal power distribution units (PDU), or Rittal IoT interfaces. It can show the following:
See the PRTG Manual for a list of all available sensor types.

Custom alerts and data visualization let you quickly identify and prevent PLC hardware health and performance issues.
PRTG is set up in a matter of minutes and can be used on a wide variety of mobile devices.


“Excellent tool for detailed monitoring. Alarms and notifications work greatly. Equipment addition is straight forward and server initial setup is very easy. ...feel safe to purchase it if you intend to monitor a large networking landscape.”
Partnering with innovative IT vendors, Paessler unleashes synergies to create
new and additional benefits for joined customers.
Paessler is member of the mioty alliance, composed of companies that use mioty to create innovative IoT and IIoT solutions such as the retrofitting of industrial environments.
Moxa is a leading manufacturer of network devices for industrial environments. Together, MXview and PRTG allow for the monitoring of industrial ethernets.
A combination of Orchestra and PRTG provides the ideal solution to monitor the traditional IT Infrastructure as well as the central communication server in hospitals and industrial environments.
Real-time notifications mean faster troubleshooting so that you can act before more serious issues occur.
Network Monitoring Software – Version 26.1.116.1532 (February 9th, 2026)
Download for Windows and cloud-based version PRTG Hosted Monitor available
English, German, Spanish, French, Portuguese, Dutch, Russian, Japanese, and Simplified Chinese
Network devices, bandwidth, servers, applications, virtual environments, remote systems, IoT, and more
Choose the PRTG Network Monitor subscription that's best for you


A PLC, or Programmable Logic Controller, is a specialized digital computer used in industrial automation and control systems. PLCs are designed to operate in harsh environments such as manufacturing plants, where they can endure high temperatures, humidity, dust, and vibration.
PLCs are programmed to perform control functions based on input received from sensors and other devices, and then they execute output commands to control machinery and processes. They are widely used in various industries for tasks such as controlling assembly lines, regulating chemical processes, managing power generation, and monitoring infrastructure systems.
In essence, PLCs serve as the 'brains' of automated systems, allowing for the centralized control and monitoring of industrial processes, and facilitating efficient and precise operation of machinery and equipment.Put some clear and concise content in here. Keep your reader in mind. What are they trying to do? What are they hoping to learn? Why are they reading this? Help them out and use the tone and voice of your organization.
PRTG supports various communication protocols like OPC UA, Modbus TCP, and MQTT. By supporting these protocols, PRTG can effectively monitor and gather data from PLCs from different manufacturers. Here's a list of some popular PLC brands and models that support OPC UA, Modbus TCP, or MQTT:
PRTG offers a comprehensive monitoring solution for PLCs, allowing users to track a wide range of parameters critical to industrial operations. This includes:
PRTG typically does not require any configuration on the PLC side. PRTG supports various industrial protocols like OPC UA, Modbus, and MQTT, allowing it to communicate directly with PLCs to retrieve monitoring data.
As long as the PLC is configured to communicate using one of these supported protocols and the network infrastructure allows communication between PRTG and the PLC, no additional changes to the PLC's configuration are usually necessary. PRTG can access data points or variables exposed by the PLC through the configured protocol without requiring any modifications to the PLC itself.
Yes, PRTG can monitor PLCs in real time. PRTG is a network monitoring software that can monitor various devices and systems, including industrial equipment like PLCs.
To monitor PLCs with PRTG, you typically need to use OPC UA, Modbus, or MQTT sensors provided by PRTG for PLC monitoring. These sensors can gather data such as CPU usage, memory usage, network traffic, and other relevant metrics from the PLCs and display them in real time in the PRTG web interface.
In PRTG, “sensors” are the basic monitoring elements. One sensor usually monitors one measured value in your network, for example the traffic of a switch port, the CPU load of a server, or the free space on a disk drive. On average, you need about 5-10 sensors per device or one sensor per switch port.
Paessler conducted trials in over 600 IT departments worldwide to tune its network monitoring software closer to the needs of sysadmins. The result of the survey: over 95% of the participants would recommend PRTG – or already have.

Paessler PRTG is used by companies of all sizes. Sysadmins love PRTG because it makes their job a whole lot easier.
Bandwidth, servers, virtual environments, websites, VoIP services – PRTG keeps an eye on your entire network.
Everyone has different monitoring needs. That’s why we let you try PRTG for free.