
- English
- Deutsch
- Español
- Français
- Italiano
- Português
Tracking energy consumption and power infrastructure health across a data center or server room typically requires either dedicated DCIM software or a patchwork of vendor-specific tools. Most of that hardware already speaks standard protocols. PDUs, UPS systems, servers with BMC interfaces, smart meters, environmental sensors: the data is there, it just needs something to collect and correlate it consistently.
PRTG pulls power and environmental metrics via SNMP, IPMI, Redfish, Modbus TCP, or HTTP, using whatever protocols your existing hardware already exposes. Voltage anomalies, battery failures, and load spikes trigger threshold-based alerts before they affect operations. On the hardware side: SNMP-enabled PDUs from APC, Raritan, Vertiv, and Eaton; UPS systems from APC, Eaton, CyberPower, and Tripp Lite; IPMI/Redfish servers from Dell, HP, Lenovo, and Supermicro; Modbus TCP industrial devices; HTTP IoT smart meters; and environmental sensors for temperature and humidity. HVAC systems and cooling units are also covered as long as they expose data via SNMP or Modbus.

Power infrastructure health depends on continuous visibility into the metrics that matter: voltage stability, battery charge levels, load distribution across circuits and PDUs. A UPS battery running low, a voltage reading drifting out of range, or a circuit approaching its load limit are all detectable well before they affect anything, provided you're actually watching them. PRTG monitors voltage, amperage, battery charge levels, and load capacity in near real-time across your PDUs and UPS devices. Set thresholds based on your actual infrastructure limits then PRTG triggers an alert the moment readings drift outside normal ranges, before anything trips.

Live graphs, real-time performance data
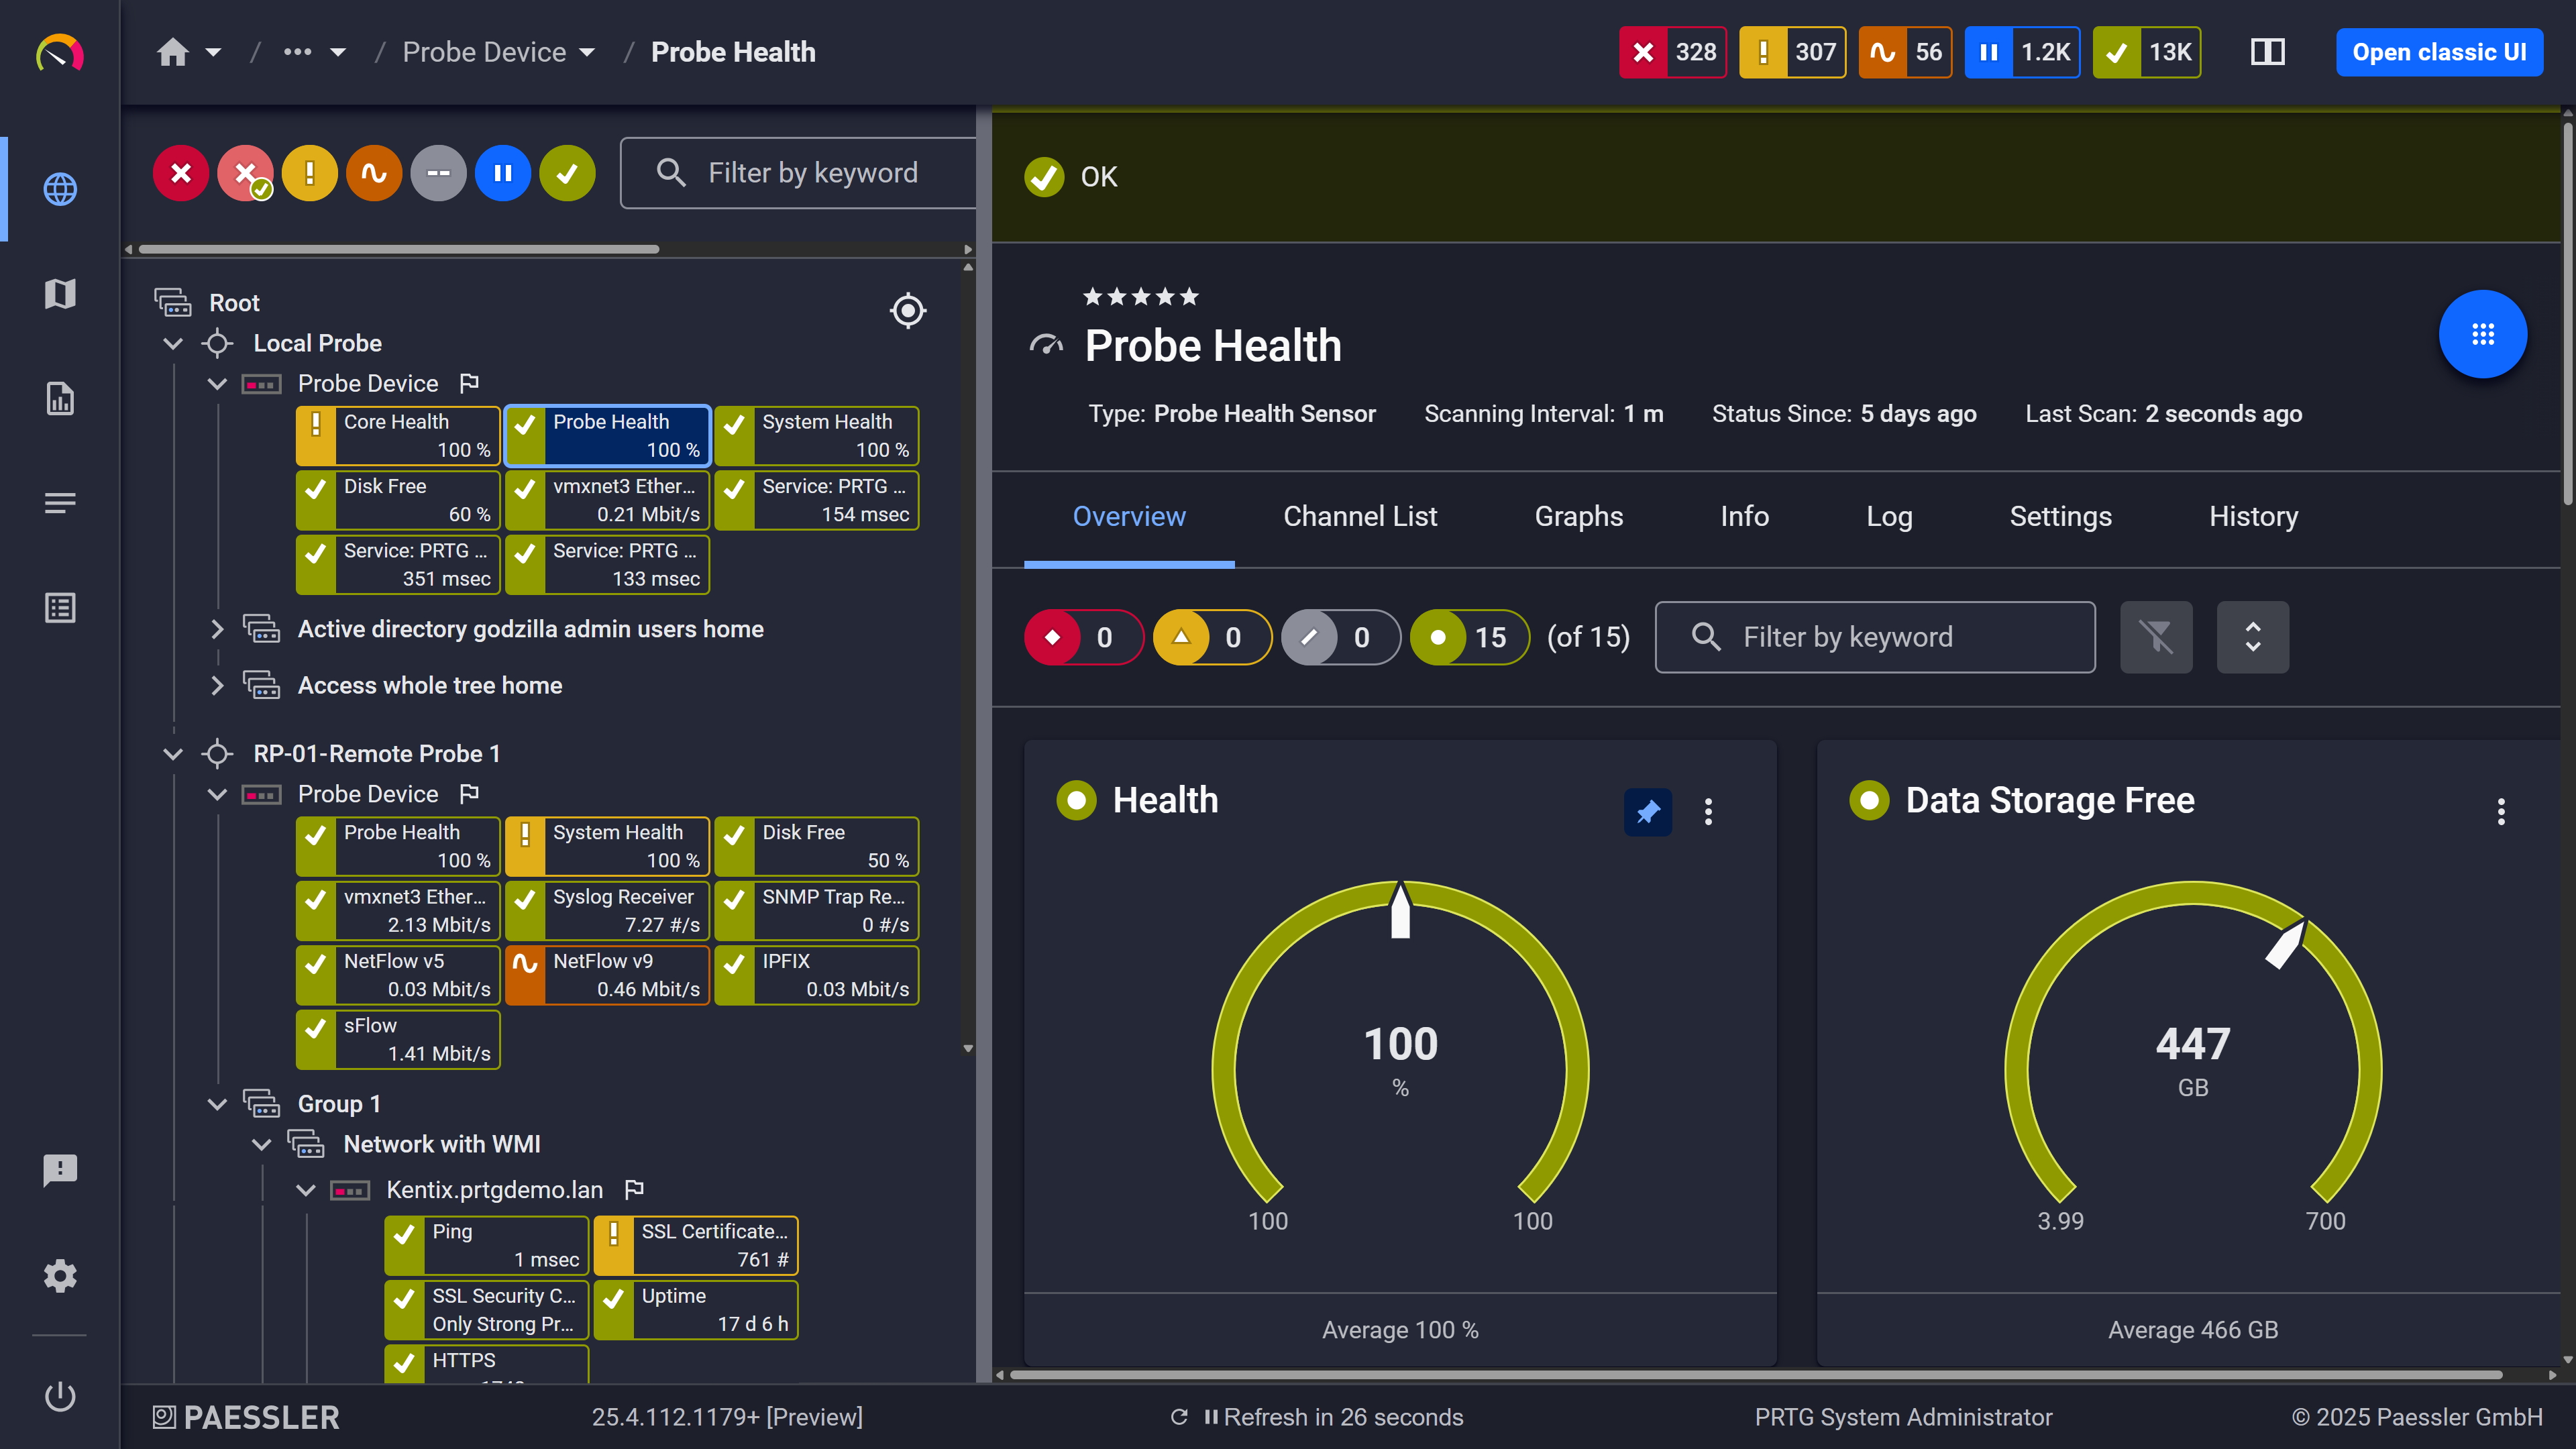
Probe health at a glance

Scheduled reports, always on time
Energy bills keep climbing, but without visibility into actual energy use you're guessing where to optimize. You need data to justify upgrades, identify inefficiencies, and prove ROI to leadership.
PRTG tracks energy consumption across devices and infrastructure, giving you baseline metrics and peak usage patterns. When a server starts drawing significantly more power than usual, that shows up. Underutilized equipment shows up too. And that gives you something concrete to build a business case around, rather than estimates.
Start monitoring your infrastructure in minutes. No professional services, no complex configuration, no risk.
Power capacity planning works best when it's based on trend data rather than spot checks. Knowing how close you are to circuit limits, how UPS load has grown over the past quarter, and where additional PDUs will be needed before you actually need them is what keeps infrastructure expansions planned rather than reactive. PRTG monitors load trends over time across your power infrastructure. Track how close you are to circuit limits, when UPS capacity will be exceeded, and where you'll need additional PDUs as you grow. This only works where PDUs actually report circuit and outlet load metrics, so check your hardware first.
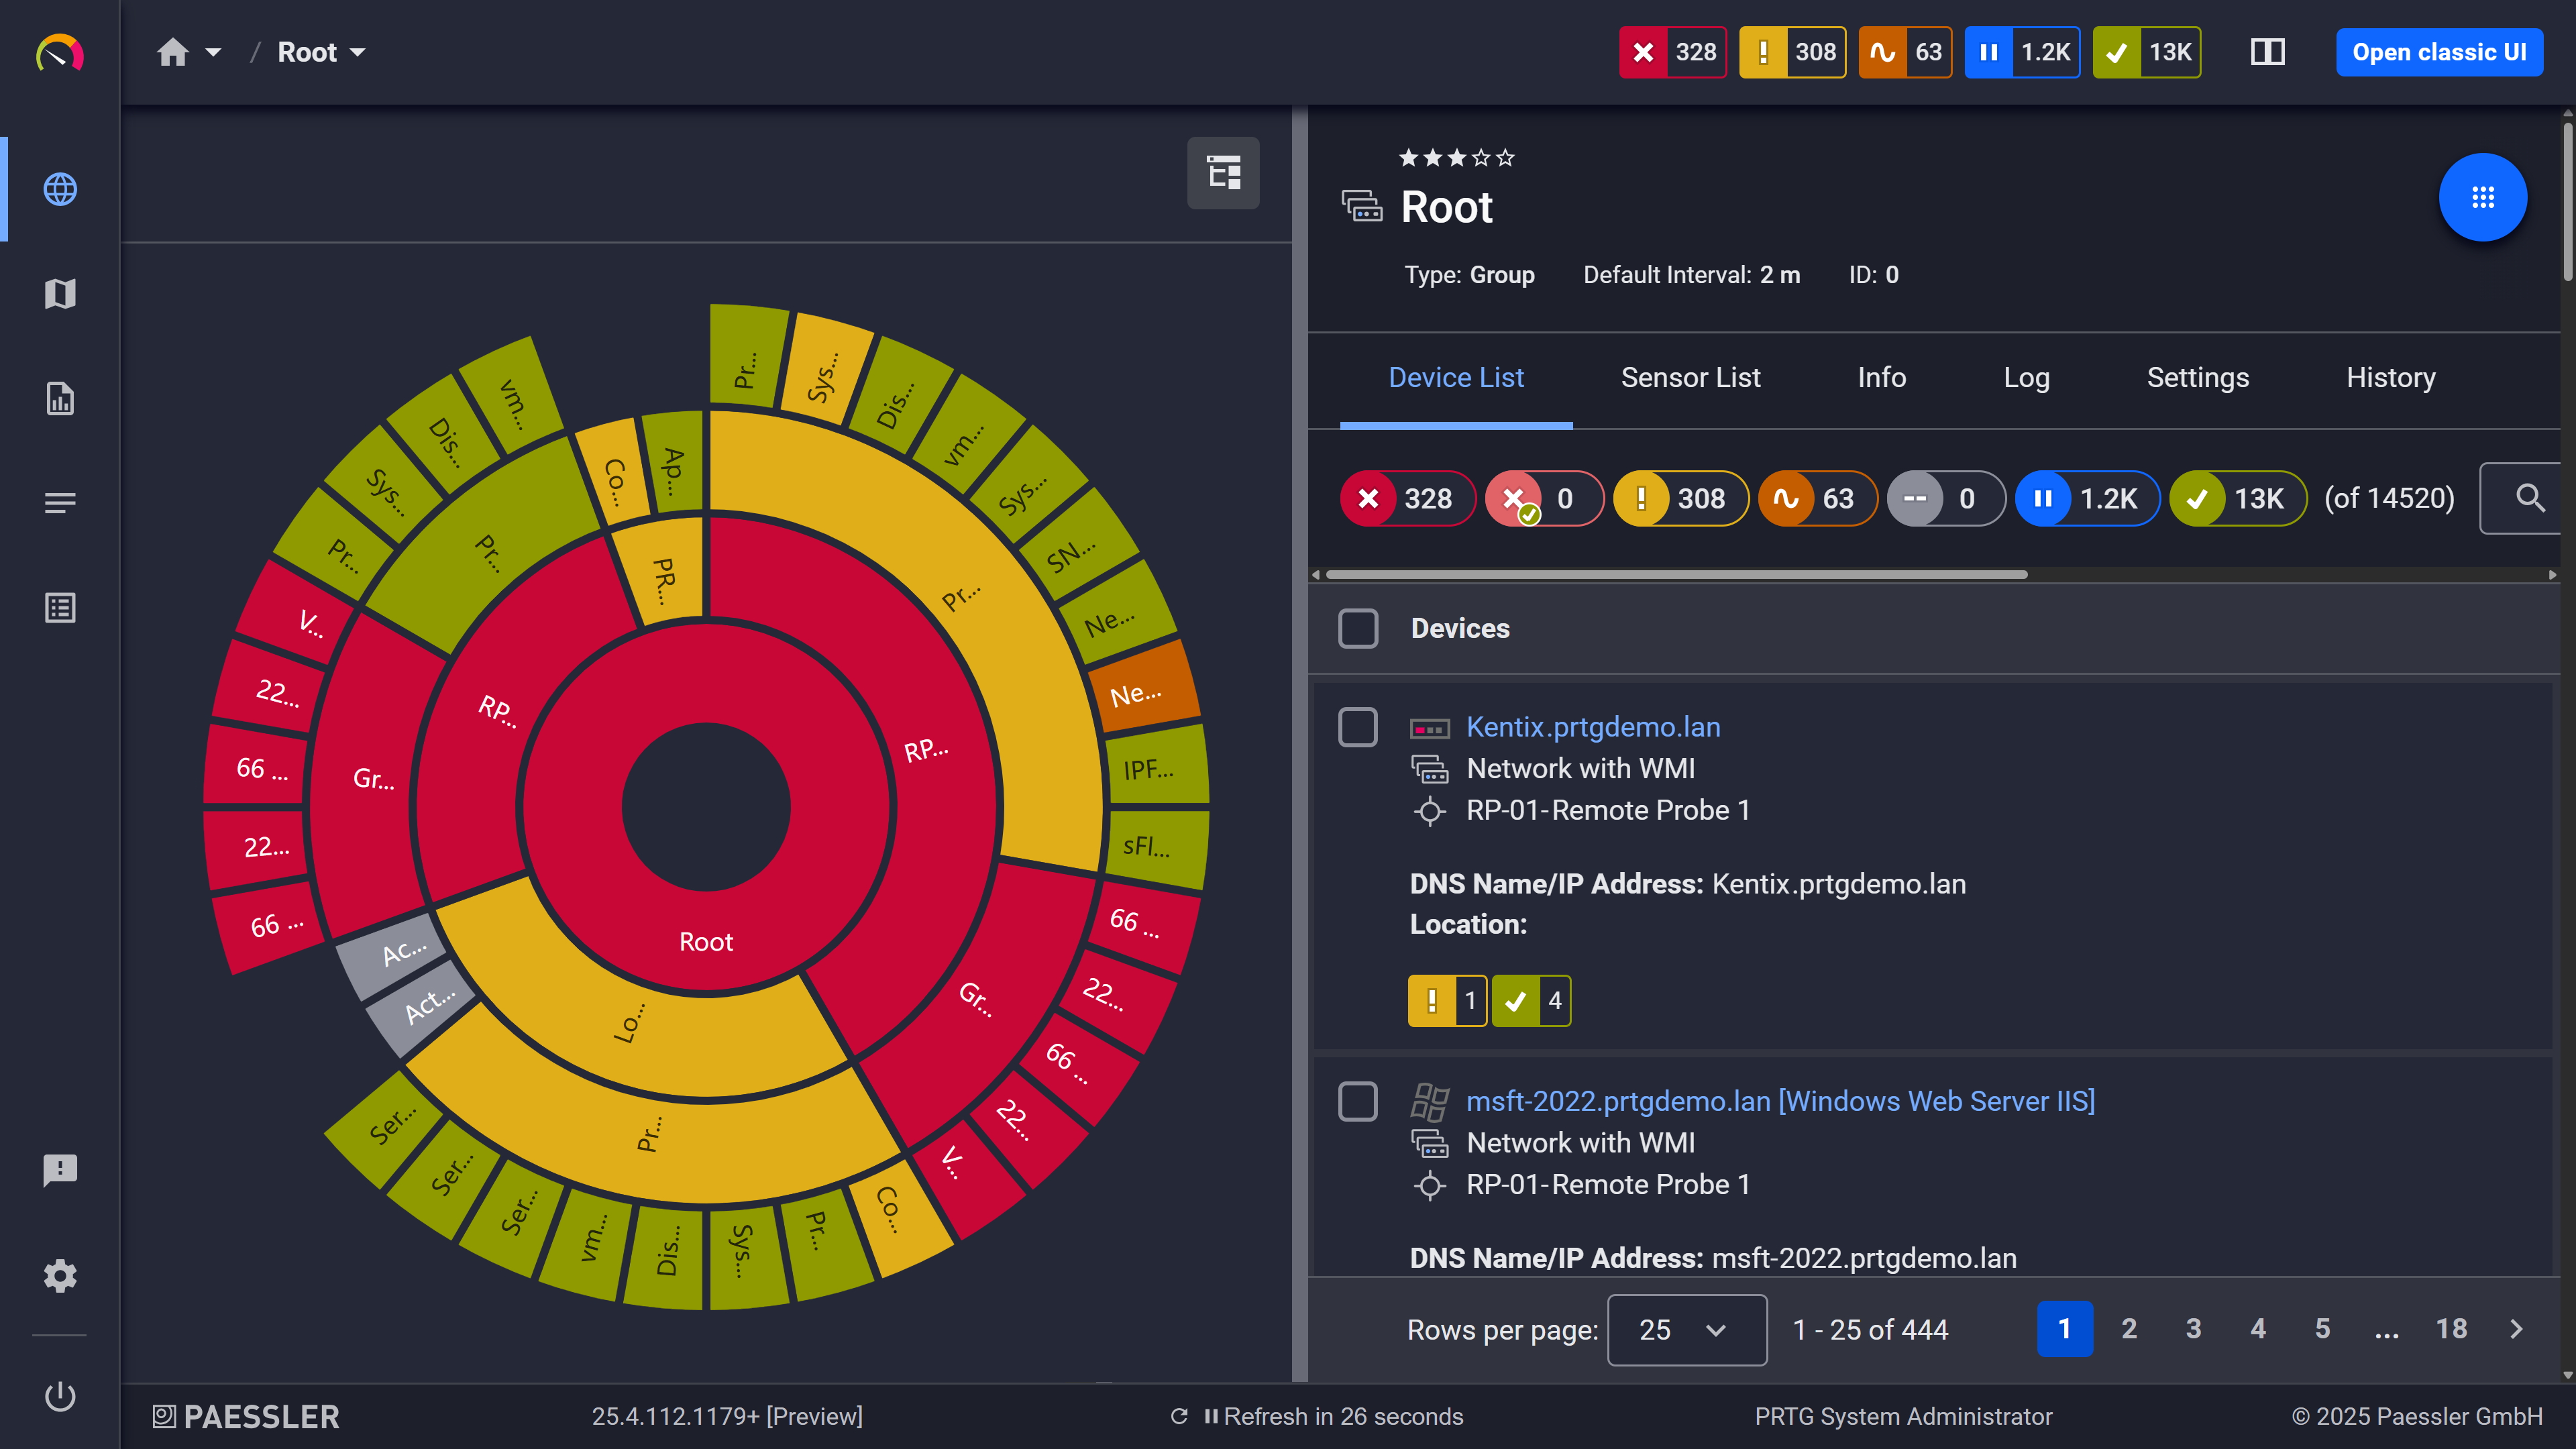
Your entire network, visualized instantly
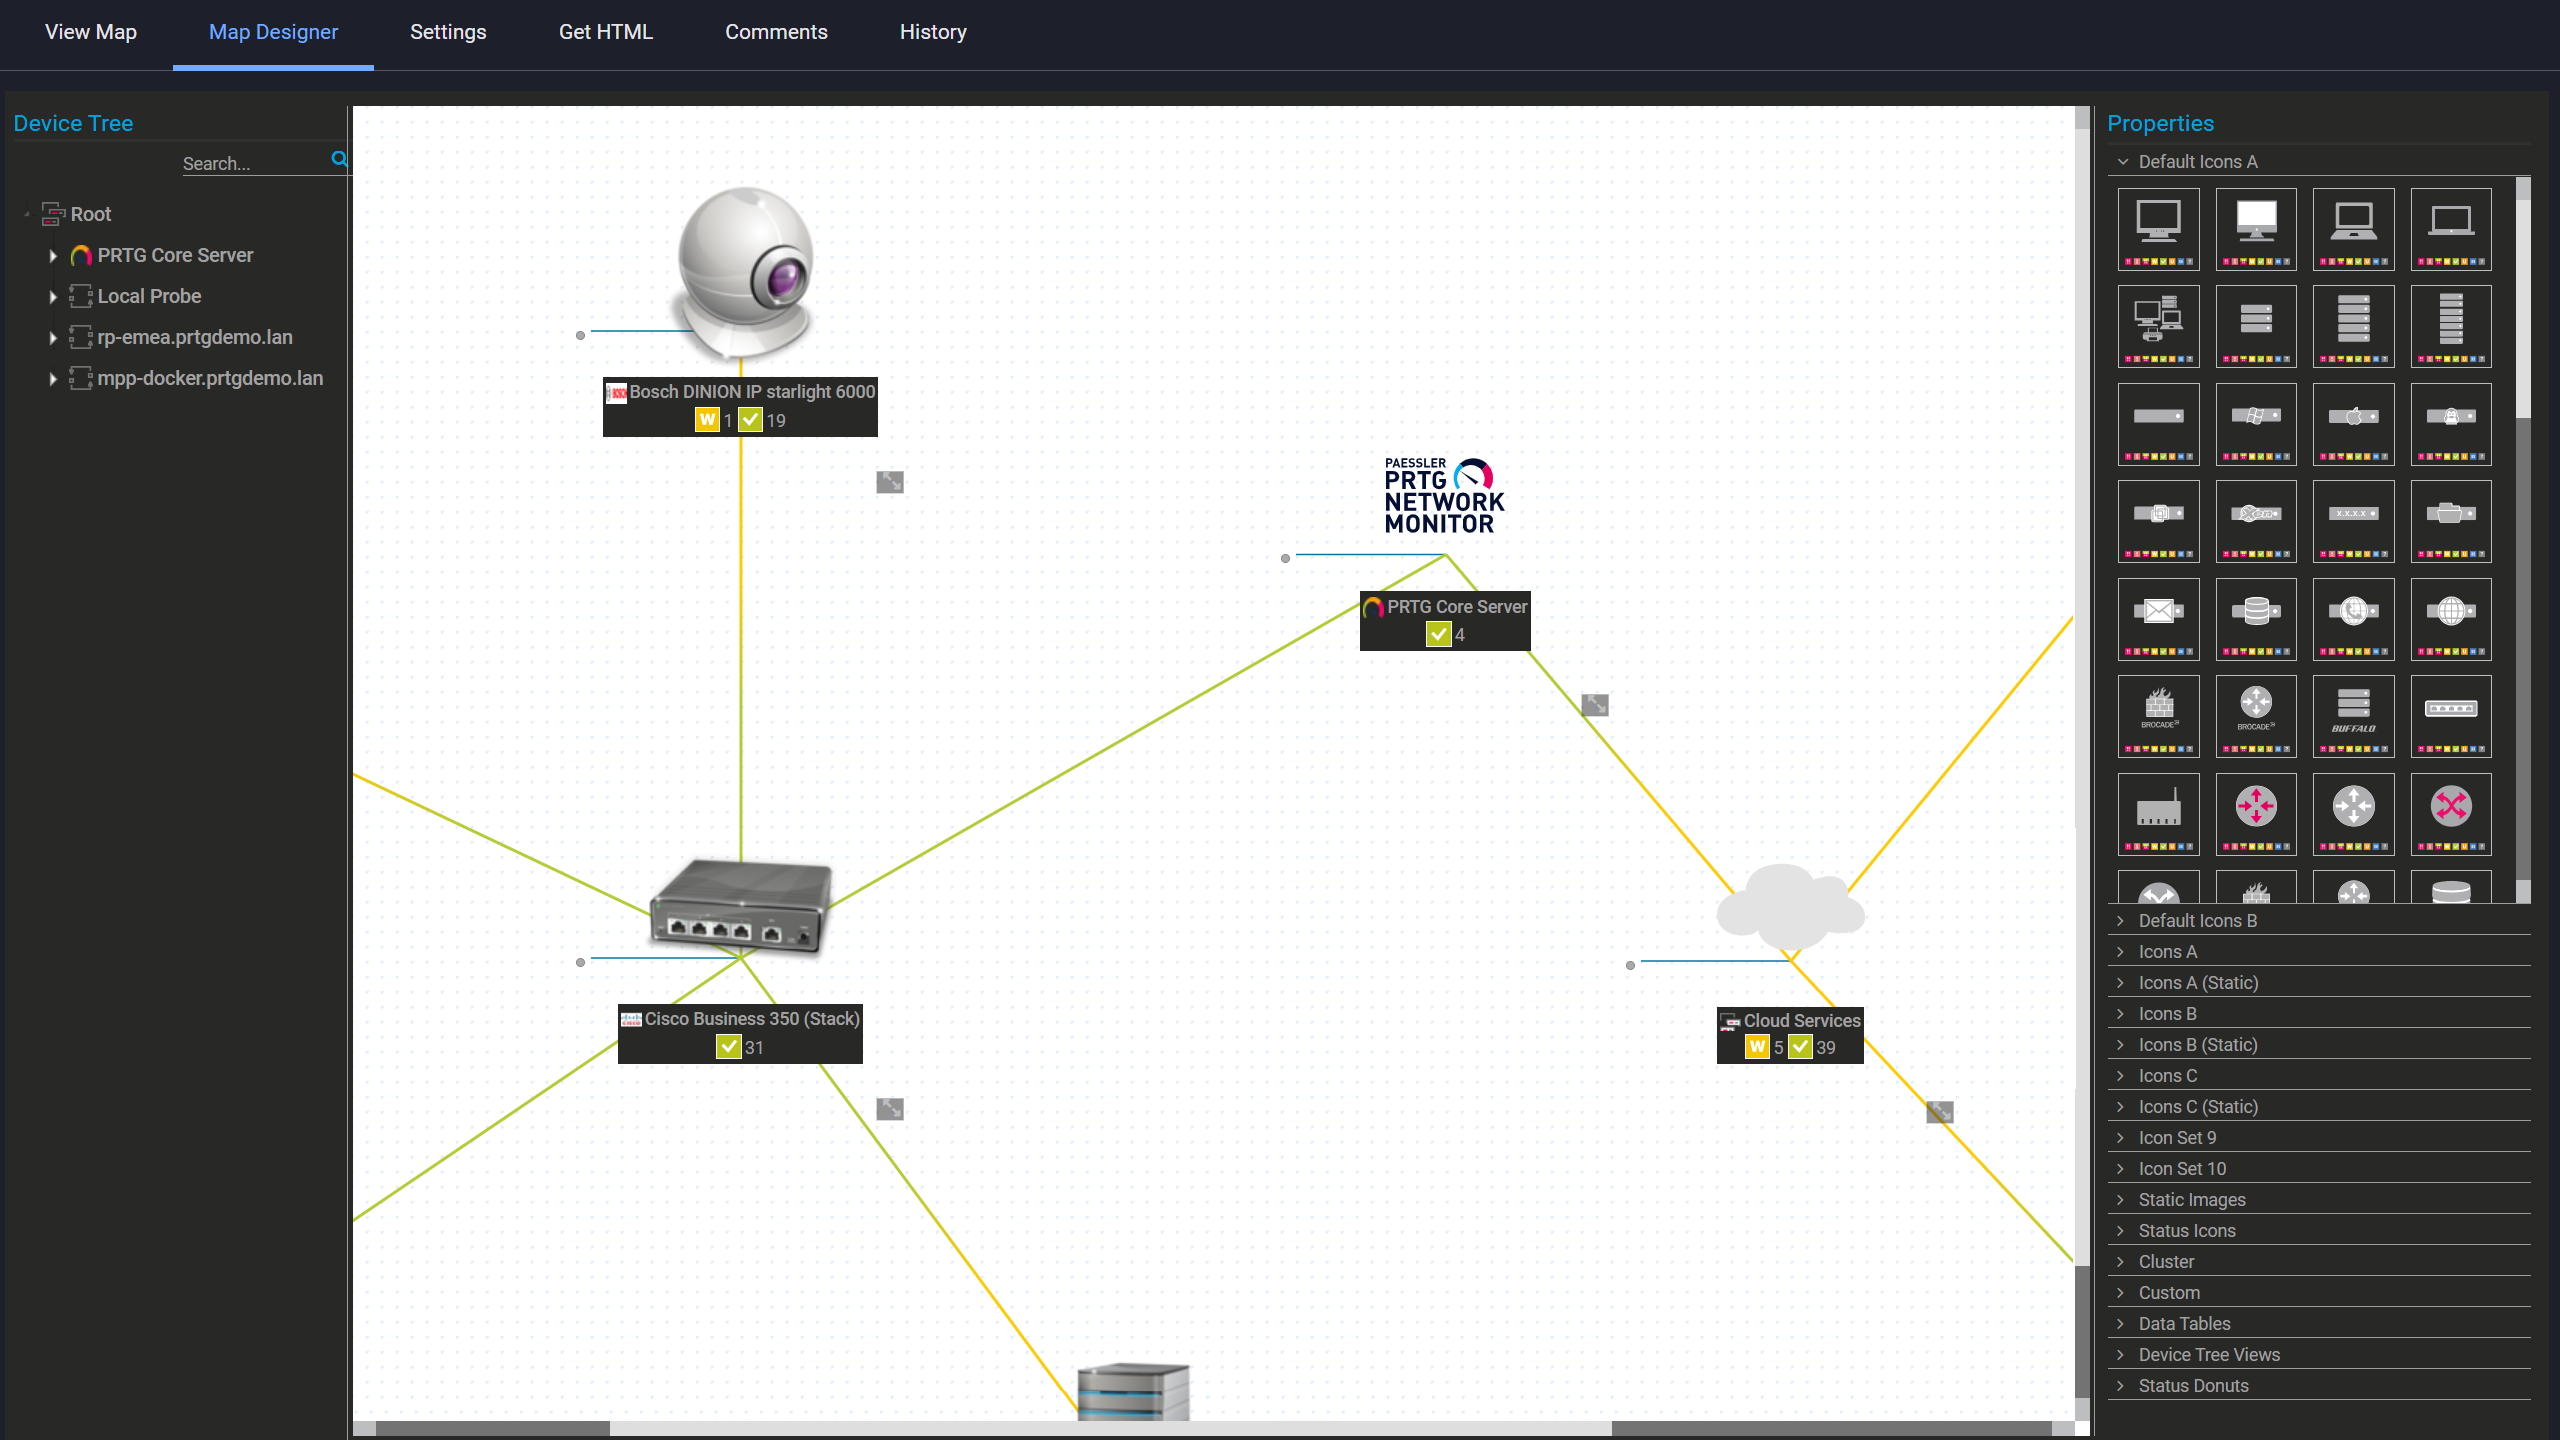
Custom maps with live status
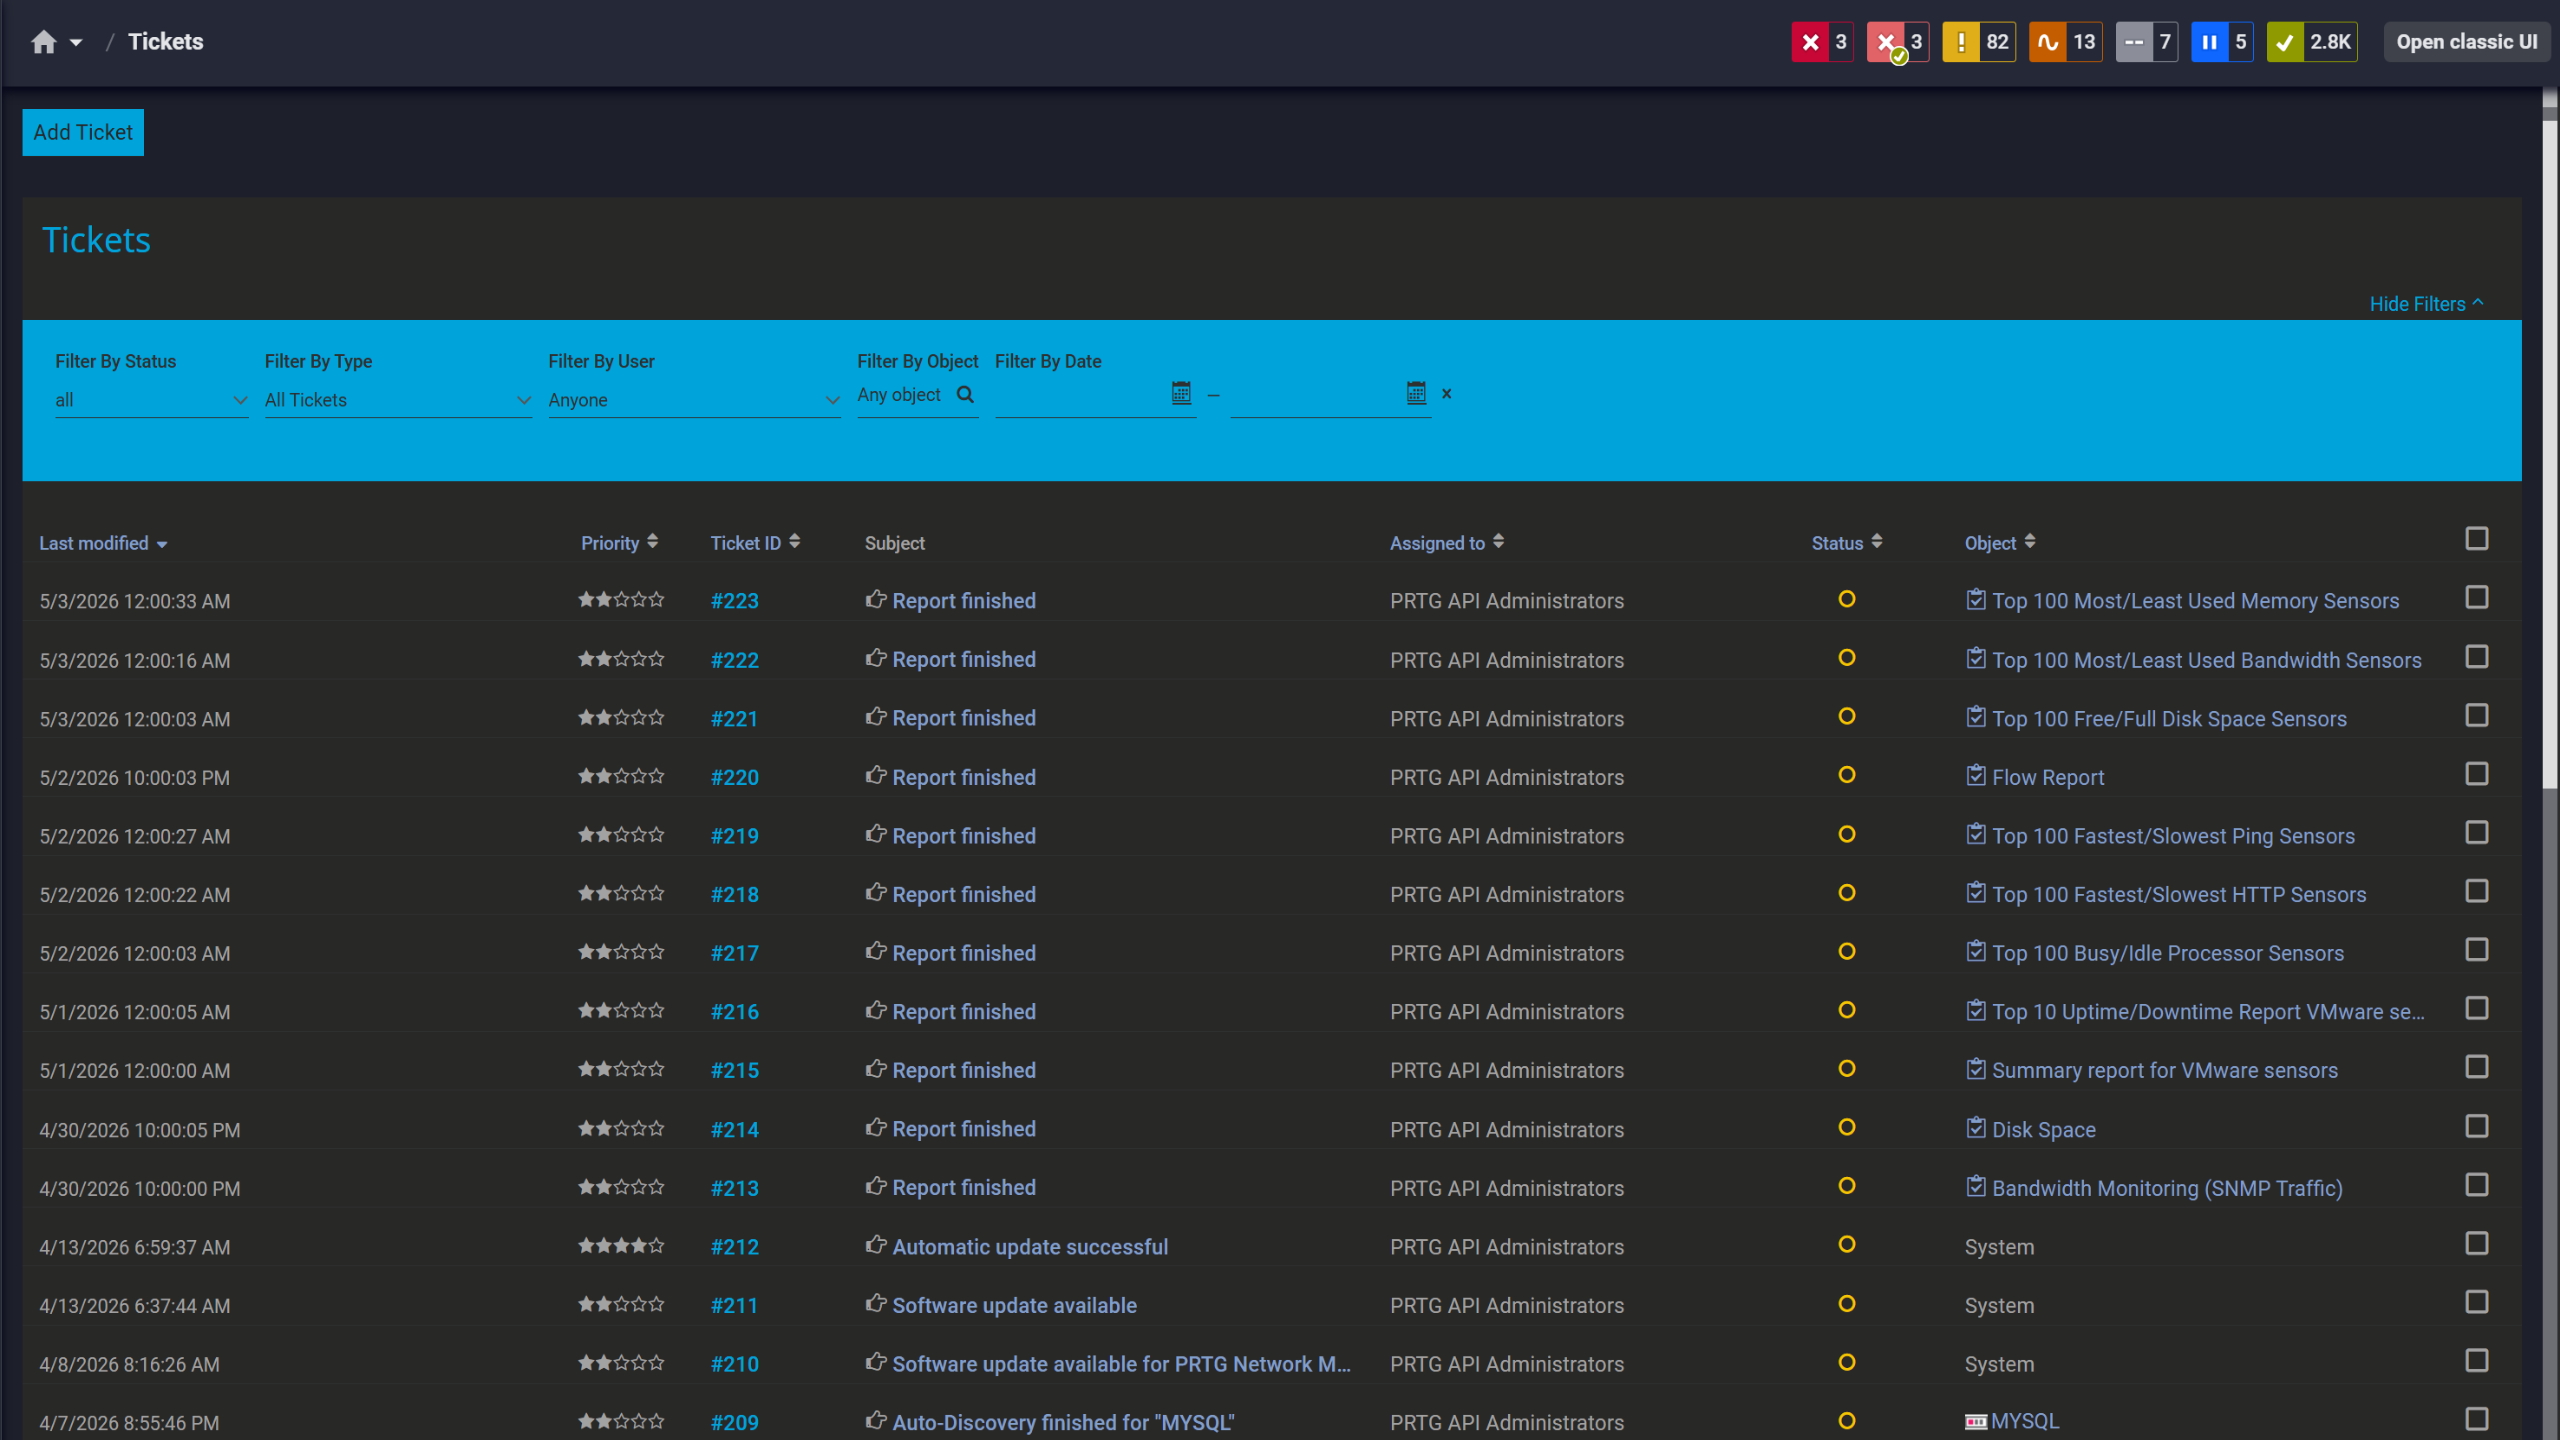
Tickets keep your team aligned
ESG reporting and corporate sustainability initiatives demand accurate energy consumption metrics. Manual data collection is slow and error-prone. And when the numbers get questioned in a board meeting, "we estimated based on spot checks" is not a great answer.
PRTG collects energy data automatically from all monitored devices. Build dashboards that show consumption trends, generate reports for carbon footprint calculations, and export data directly into your sustainability platforms or energy management system.
PRTG uses multiple monitoring methods to track energy usage and power infrastructure health across your environment. No vendor lock-in. It works with whatever hardware you already have, using industry-standard protocols.
Feature | Without PRTG Without PRTG | With PRTG With PRTG |
|---|---|---|
Continuous energy use visibility | Without PRTG Periodic meter readings, delayed reporting | With PRTG Continuous monitoring with instant dashboards |
Automated threshold alerts | Without PRTG Reactive discovery after equipment failure | With PRTG Proactive alerts that improve operational efficiency and prevent outages |
Historical trend analysis for decision-making | Without PRTG Spreadsheet tracking with manual data entry | With PRTG Automated historical reports and trend visualization |
Multi-device consolidation | Without PRTG Multiple vendor tools, separate logins, fragmented data | With PRTG Single platform for PDUs, UPS, servers, and environmental sensors |
Energy efficiency and cost reduction metrics | Without PRTG Calculated manually from utility bills | With PRTG Real-time kWh consumption and cost tracking, with PUE calculation via sensor math possible when appropriate power/energy data is available from external meters |
Choose the PRTG Network Monitor subscription that's best for you.
| License Name | License description | Price | License Details | Get started | Pricing Details | |
|---|---|---|---|---|---|---|
| PRTG 500 | $200 | per month paid annually | Buy nowBuy now | Enough to monitor multiple aspects of 50 devices | ||
| PRTG 1000 | $358 | per month paid annually | Buy nowBuy now | Enough to monitor multiple aspects of 100 devices | ||
| PRTG 2500 | $742 | per month paid annually | Buy nowBuy now | Enough to monitor multiple aspects of 250 devices | ||
| PRTG 5000 | $1,300 | per month paid annually | Buy nowBuy now | Enough to monitor multiple aspects of 500 devices | ||
| PRTG 10000 | $1,642 | per month paid annually | Buy nowBuy now | Enough to monitor multiple aspects of 1000 devices |

PDUs, UPS systems, servers, smart meters, environmental sensors. The protocol is what actually determines support, not the vendor. If your device speaks SNMP, Modbus TCP, IPMI, Redfish, or HTTP you're covered. APC, Eaton, Raritan, Vertiv on the PDU side. Eaton, CyberPower, Tripp Lite for UPS. Dell, HP, Lenovo, Supermicro via IPMI or Redfish for servers. Modbus TCP gets you most industrial gear.
Depends on the device. SNMP, Modbus TCP, OPC UA, and HTTP are supported.A lot of HVAC and refrigeration equipment doesn't expose any of those protocols natively, so you end up monitoring thermal impact indirectly through temperature and humidity sensors nearby. Not ideal but for spotting cooling inefficiencies it's often enough.
If the system publishes data via SNMP, Modbus TCP, or HTTP, yes. Solar inverters, wind systems, battery storage generation and consumption data all shows up in PRTG alongside everything else. Worth being clear though: PRTG reads the data. It doesn't send commands back. One direction only. Anything beyond monitoring needs to go through your energy management platform, which PRTG can feed via API or export.
It doesn't, directly. What it does is give you consumption data you can actually rely on, pulled automatically from monitored devices rather than estimated or manually collected. That's what feeds carbon footprint calculations, emissions reporting, sustainability platform exports. The reduction part is on your end. PRTG just makes sure the numbers going into those decisions aren't guesswork.
Yes. PRTG dashboards are customizable and update in real-time. Build views showing kWh usage, UPS battery status, PDU load distribution, temperature trends, cost tracking. Share them with management for sustainability reporting or keep them for daily ops. No separate tool needed.
Voltage, current, power factor, kWh consumption, UPS battery charge and runtime, server power draw, temperature, humidity, phase balance, and circuit load percentage. Also worth knowing: you can calculate custom metrics like PUE using PRTG's sensor math functionality to combine data from multiple sources. Takes some setup, but the functionality is there.
Three options. PRTG Hosted Monitor is the cloud-based version, no on-premises infrastructure required. PRTG Network Monitor runs on-premises with remote access. PRTG Enterprise Monitor handles distributed hybrid deployments. Pricing and feature differences between them are covered on the pricing page.
Network Monitoring Software – Version 26.3.124.1727 (September 16, 2026)
Download for Windows and cloud-based version PRTG Hosted Monitor available
English, German, Spanish, French, Portuguese, Dutch, Russian, Japanese, and Simplified Chinese
Network devices, bandwidth, servers, applications, virtual environments, remote systems, IoT, and more
Choose the PRTG Network Monitor subscription that's best for you



