![]()
All-in-one AWS monitoring for your cloud infrastructure
- Powerful, easy monitoring of your hybrid & cloud IT environment
- Use with CloudWatch to monitor any Amazon Web Services
- Link CloudWatch data to monitoring data from your entire IT
Our users give top ratings for monitoring with Paessler PRTG


PRTG AWS monitoring: What you’ll find on this page

- Get the most out of AWS cloud computing with PRTG AWS performance monitoring
- What Amazon Web Services monitoring looks like in PRTG
- 7 reasons to choose PRTG as your AWS monitoring tool
- How PRTG works with Amazon CloudWatch
- Discover our preconfigured sensors for AWS monitoring
- Monitor Amazon Web Services: FAQ
PRTG makes monitoring AWS easy
Custom alerts and data visualization make it easy to monitor, identify, and prevent AWS service performance and security issues.
Get the most out of AWS cloud computing with PRTG AWS performance monitoring
Ensure your infrastructure runs smoothly
Paessler PRTG is essential for AWS cloud computing since cloud access is contingent on the perfect functioning of your internet connection and corresponding network devices, such as routers and switches.
Sit back, relax, and let PRTG monitor your entire IT infrastructure for you. Amazon cloud monitoring with PRTG provides you with an overview of the utilization of your resources, the performance of applications, and the soundness of company processes.
Enjoy faster and easier troubleshooting
PRTG helps to reduce risks in the cloud and configure your local network to best adapt to the cloud integration. Time spent troubleshooting is therefore kept to a minimum. PRTG lets you intervene quickly, allowing you to bypass many problems entirely.
It shows you, for example, if your IT infrastructure is about to overload due to the large amount of data flowing across your lines and network devices while using the cloud. You can then take necessary steps to upgrade your system.
Expand Amazon CloudWatch possibilities with PRTG
PRTG uses Amazon CloudWatch data to monitor Amazon Web Services and help you get to the root of the problem if crashes occur. Does the error lie with the Amazon server or cloud service, or with a local router? To find out, you'll need monitoring data from both the cloud and the local network.
PRTG comes with a variety of built-in AWS sensors for a number of services which allow for Amazon CloudWatch data to be effortlessly integrated into your monitoring solution. With PRTG, you can monitor cloud data centrally along with the data from your local IT infrastructure to get the most out of AWS cloud computing.
What Amazon Web Services monitoring looks like in PRTG
Diagnose network issues by continuously monitoring the availability, performance, and cost of your AWS cloud applications. Show AWS alarms in real time and visualize data in graphic maps & dashboards to identify problems more easily. Gain the visibility you need to troubleshoot all kinds of issues with your cloud computing infrastructure as well as your entire network.

Device tree view of the complete monitoring setup
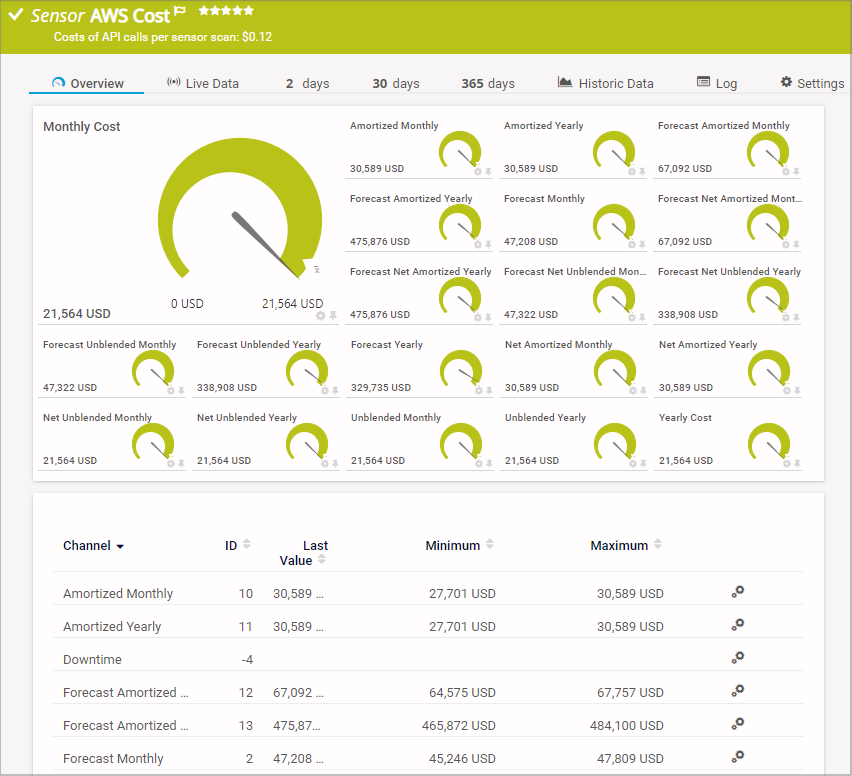
Preconfigured AWS Cost sensor in PRTG

Custom PRTG dashboard for keeping an eye on the entire IT infrastructure
Start AWS application monitoring with PRTG and see how it can make your network more reliable and your job easier.
“All-around winning “The real beauty of PRTG is the endless possibilities it offers” “PRTG Network MonitorIT experts agree: Paessler PRTG is a great solution for IT infrastructure monitoring

network monitor”

is very hard to beat”
7 reasons to choose PRTG as your AWS monitoring tool
Make decisions faster
Gather relevant performance and load data from your systems and applications. The newfound information will make it easier to make important decisions.
Monitor any operating system
By using our AWS sensors, you can monitor important system settings without having to pay attention to which operating system is running on the cloud server.
Enjoy enhanced security
With PRTG AWS monitoring, queries can be sent and data retrieved without the need to open a single port. You’ll also be promptly informed of error messages and capacity shortages.
Automatically detect fluctuations
Detect fluctuations and adjust capacities within minutes whether you’re using EC2, EBS, ELB, or RDS. With precise AWS tracking, you’ll stay in complete control.
Put freed-up resources to good use
With hardware maintenance completed on the Amazon side, your own resources can be dedicated to innovative IT processes that are beneficial to your business.
Be alerted immediately any way you want
PRTG informs you automatically of any errors or malfunctions. Simply define your threshold values and PRTG will alert you by SMS, email, push notification, and other means.
Keep a constant overview
PRTG monitors all cloud values on one centralized dashboard. And thanks to the fully customizable, automatic reporting feature, you can also keep coworkers and management in the know.
Easily find the source of the problem with our PRTG AWS network monitoring solution
Real-time alerts and custom notifications make it easy to solve issues with AWS cloud services as well as your entire IT infrastructure.
PRTG is compatible with all major vendors, products, and systems
![]()
How PRTG works with Amazon CloudWatch
Monitor and analyze all Amazon instances
PRTG works with Amazon CloudWatch to monitor the instances of: Amazon EC2, RDS databases, Amazon EBS data carriers, ElastiCache, and Elastic Load Balancing. SQS and SNS data is also retrieved, and the configured alarms are monitored.
Create data linkages for easier troubleshooting
PRTG extracts the CloudWatch data via the AWS API, enabling you to link it to other monitoring data such as the router status. As a result, you'll be able to identify correlations while troubleshooting that might not show up when only using CloudWatch.
Discover our preconfigured sensors for AWS monitoring
AWS Alarm v2
The AWS Alarm v2 sensor monitors the status of an alarm that is configured for a CloudWatch service. It can distinguish between composite and metric alarms and monitor them independently from each other.
AWS EBS v2
The AWS EBS v2 sensor monitors the performance of an Elastic Block Store volume and displays different read and write operation values, such as total time, speed, and count. There are also channels that show the volume state and the burst balance.
AWS EC2 v2
The AWS EC2 v2 sensor monitors the performance of an Elastic Compute Cloud instance in terms of CPU and network load, the read/write speed of hard disks, and EC2 status checks. If activated in your AWS account, it can also show the CPU credit balance and usage.
AWS ELB v2
The AWS ELB v2 sensor monitors the performance of an Elastic Load Balancing load balancer – the sensor supports application balancers and network load balancers. It displays different host count values, target 4xx counts, and more, and there are new channels that show, for example, processed bytes, rule evaluations, and consumed LCUs.
AWS RDS v2
The AWS RDS v2 sensor monitors the performance of the Amazon Relational Database Service (RDS) regarding CPU load, CPU credit usage, CPU credit balance, memory usage, incoming and outgoing database/network traffic, and storage information.
Your AWS monitor at a glance – even on the go
Set up PRTG in minutes and use it on almost any mobile device.


PRTG makes monitoring AWS easy
Custom alerts and data visualization make it easy to monitor, identify, and prevent AWS service performance and security issues.
“Excellent tool for detailed monitoring. Alarms and notifications work greatly. Equipment addition is straight forward and server initial setup is very easy. ...feel safe to purchase it if you intend to monitor a large networking landscape.”
Infrastructure and Operations Engineer in the Communications Industry, firm size 10B - 30B USD
Create innovative solutions with Paessler’s partners
Partnering with innovative vendors, Paessler unleashes synergies to create
new and additional benefits for joined customers.
Paessler is member of the mioty alliance, composed of companies that use mioty to create innovative IoT and IIoT solutions such as the retrofitting of industrial environments.
mioty alliance

Easily find the source of the problem with our PRTG AWS network monitoring solution
Real-time alerts and custom notifications make it easy to solve issues with AWS cloud services as well as your entire IT infrastructure.
Monitor Amazon Web Services: FAQ
What is Amazon CloudWatch?
Amazon CloudWatch is the monitoring service for AWS cloud resources that allows you to collect and analyze data, configurations, and metrics. PRTG connects to the Amazon CloudWatch API and uses CloudWatch data to monitor Amazon Web Services.
What is AWS monitoring?
AWS monitoring involves tracking and managing the performance, health, and availability of AWS resources and applications. It uses tools like Amazon CloudWatch and Paessler PRTG to collect and analyze metrics, logs, and events. Monitoring helps identify and resolve issues, optimize performance, and ensure the reliability of services. Alerts can be configured to notify administrators of potential problems. Overall, it ensures that AWS environments run efficiently and effectively.
How does PRTG monitor AWS?
PRTG comes with a variety of built-in AWS sensors which allow for Amazon CloudWatch data to be effortlessly integrated into your monitoring solution. These sensors have been developed for a number of services that are monitored by CloudWatch, for example, AWS EC2, AWS EBS, AWS ELB, and AWS RDS. What’s more: PRTG lets you receive AWS Alarms centrally and also checks the costs that come with using Amazon Web Services.
What AWS services can PRTG monitor?
AWS Alarms
In CloudWatch, you can set custom alarms for a variety of metrics, and receive notifications or define actions to be executed automatically in the event of an alarm, such as auto-scaling during EC2 instances. PRTG lets you integrate these alarms into your central monitoring, and therefore group all the data from your IT infrastructure into one place. Furthermore, thanks to free alerts of PRTG (e.g. push notifications), you’ll always stay in the know.
Amazon EC2
Amazon Elastic Compute Cloud (Amazon EC2) provides virtual servers for web-based computing with an elastic configuration. Choose from a variety of instance types, operating systems, and software packages, then create your own custom configuration based on RAM, CPU, instance memory, and boot volume size. A quick adjustment of capacities and you’ll be well prepared for fluctuations and load peaks. Within minutes, you can increase or reduce the capacity of your hosting, and thereby gain total control.
Amazon EBS
Amazon Elastic Block Store (Amazon EBS) is a service for Amazon EC2 instances. Volumes for persistent block storage ensure a high level of availability and protection in the event individual components break down. Amazon EBS volumes provide for consistently high performance and short latency. Use them to manage computer processing loads. The advantage of Amazon EBS: You can increase or reduce capacities within minutes.
Amazon ELB
The function of Amazon Elastic Load Balancing (Amazon ELB) is to automatically distribute incoming application traffic across several EC2 instances. The load distribution capacity that is required for this function adjusts seamlessly to the distribution of the application data. As a result, your network load is stabler and your applications are granted more room for error.
Amazon RDS
The Amazon Relational Database Service (Amazon RDS) helps you tailor the configuration, administration, and scaling of a relational database in Amazon cloud computing. It also allows for the automation of administrative tasks, such as hardware provisioning, database setup, and importing backups and patches.
What is a sensor in PRTG?
In PRTG, “sensors” are the basic monitoring elements. One sensor usually monitors one measured value in your network, for example the traffic of a switch port, the CPU load of a server, or the free space on a disk drive.
On average, you need about 5-10 sensors per device or one sensor per switch port.

PRTG: The multi-tool for sysadmins
Adapt PRTG individually and dynamically to your needs and rely on a strong API:- HTTP API: Access monitoring data and manipulate monitoring objects via HTTP requests
- Custom sensors: Create your own PRTG sensors for customized monitoring
- Custom notifications: Create your own notifications and send action triggers to external systems
- REST Custom sensor: Monitor almost everything that provides data in XML or JSON format
Paessler conducted trials in over 600 IT departments worldwide to tune its network monitoring software closer to the needs of sysadmins. We asked: would you recommend PRTG?
Over 95% of our customers say yes!
The result of the survey: over 95% of the participants would recommend PRTG – or already have.
Paessler PRTG is used by companies of all sizes. Sysadmins love PRTG because it makes their job a whole lot easier. Bandwidth, servers, virtual environments, websites, VoIP services – PRTG keeps an eye on your entire network. Everyone has different monitoring needs. That’s why we let you try PRTG for free.Still not convinced?
![]()
More than 500,000
sysadmins love PRTG![]()
Monitor your entire IT infrastructure
![]()
Try Paessler PRTG
for free
![]()
Start AWS application monitoring with PRTG and see how it can make your network more reliable and your job easier.
|
PRTG |
Network Monitoring Software - Version 24.2.96.1375 (June 26th, 2024) |
|
Hosting |
Download for Windows and cloud-based version PRTG Hosted Monitor available |
Languages |
English, German, Spanish, French, Portuguese, Dutch, Russian, Japanese, and Simplified Chinese |
Pricing |
Up to 100 sensors for free (Price List) |
Unified Monitoring |
Network devices, bandwidth, servers, applications, virtual environments, remote systems, IoT, and more |
Supported Vendors & Applications |
|