- English
- Deutsch
- Español
- Français
- Italiano
- Português
Amazon RDS takes the operational overhead of running databases off your plate, but performance visibility is still your responsibility. CPU spikes, connection exhaustion, storage running low, replication lag on read replicas: CloudWatch captures all of it, but pulling that data into something actionable across multiple instances and regions takes more work than it should.
PRTG connects to CloudWatch via the AWS API and collects RDS metrics directly, no agents and no manual console checks required. The AWS RDS v2 sensor surfaces CPU utilization, IOPS, storage consumption, database connections, and latency in real-time dashboards with threshold-based alerting. Setup needs IAM credentials with read access to CloudWatch and RDS; the exact required policy is documented in Paessler's Knowledge Base. Supported engines: MySQL, PostgreSQL, MariaDB, Oracle, Microsoft SQL Server, and Amazon Aurora in both MySQL-compatible and PostgreSQL-compatible versions.

When an Amazon RDS instance slows down, you're often the last to know. By the time users report application lag, the impact is already there. Without real-time visibility into CPU spikes, IOPS bottlenecks, or connection exhaustion, troubleshooting becomes a guessing game instead of a structured root cause analysis.
PRTG pulls rds metrics from CloudWatch and surfaces them in real-time dashboards. You define thresholds for CPU utilization, disk queue depth, or database connections, and PRTG fires a notification the moment metrics cross those limits, before application performance takes a hit.
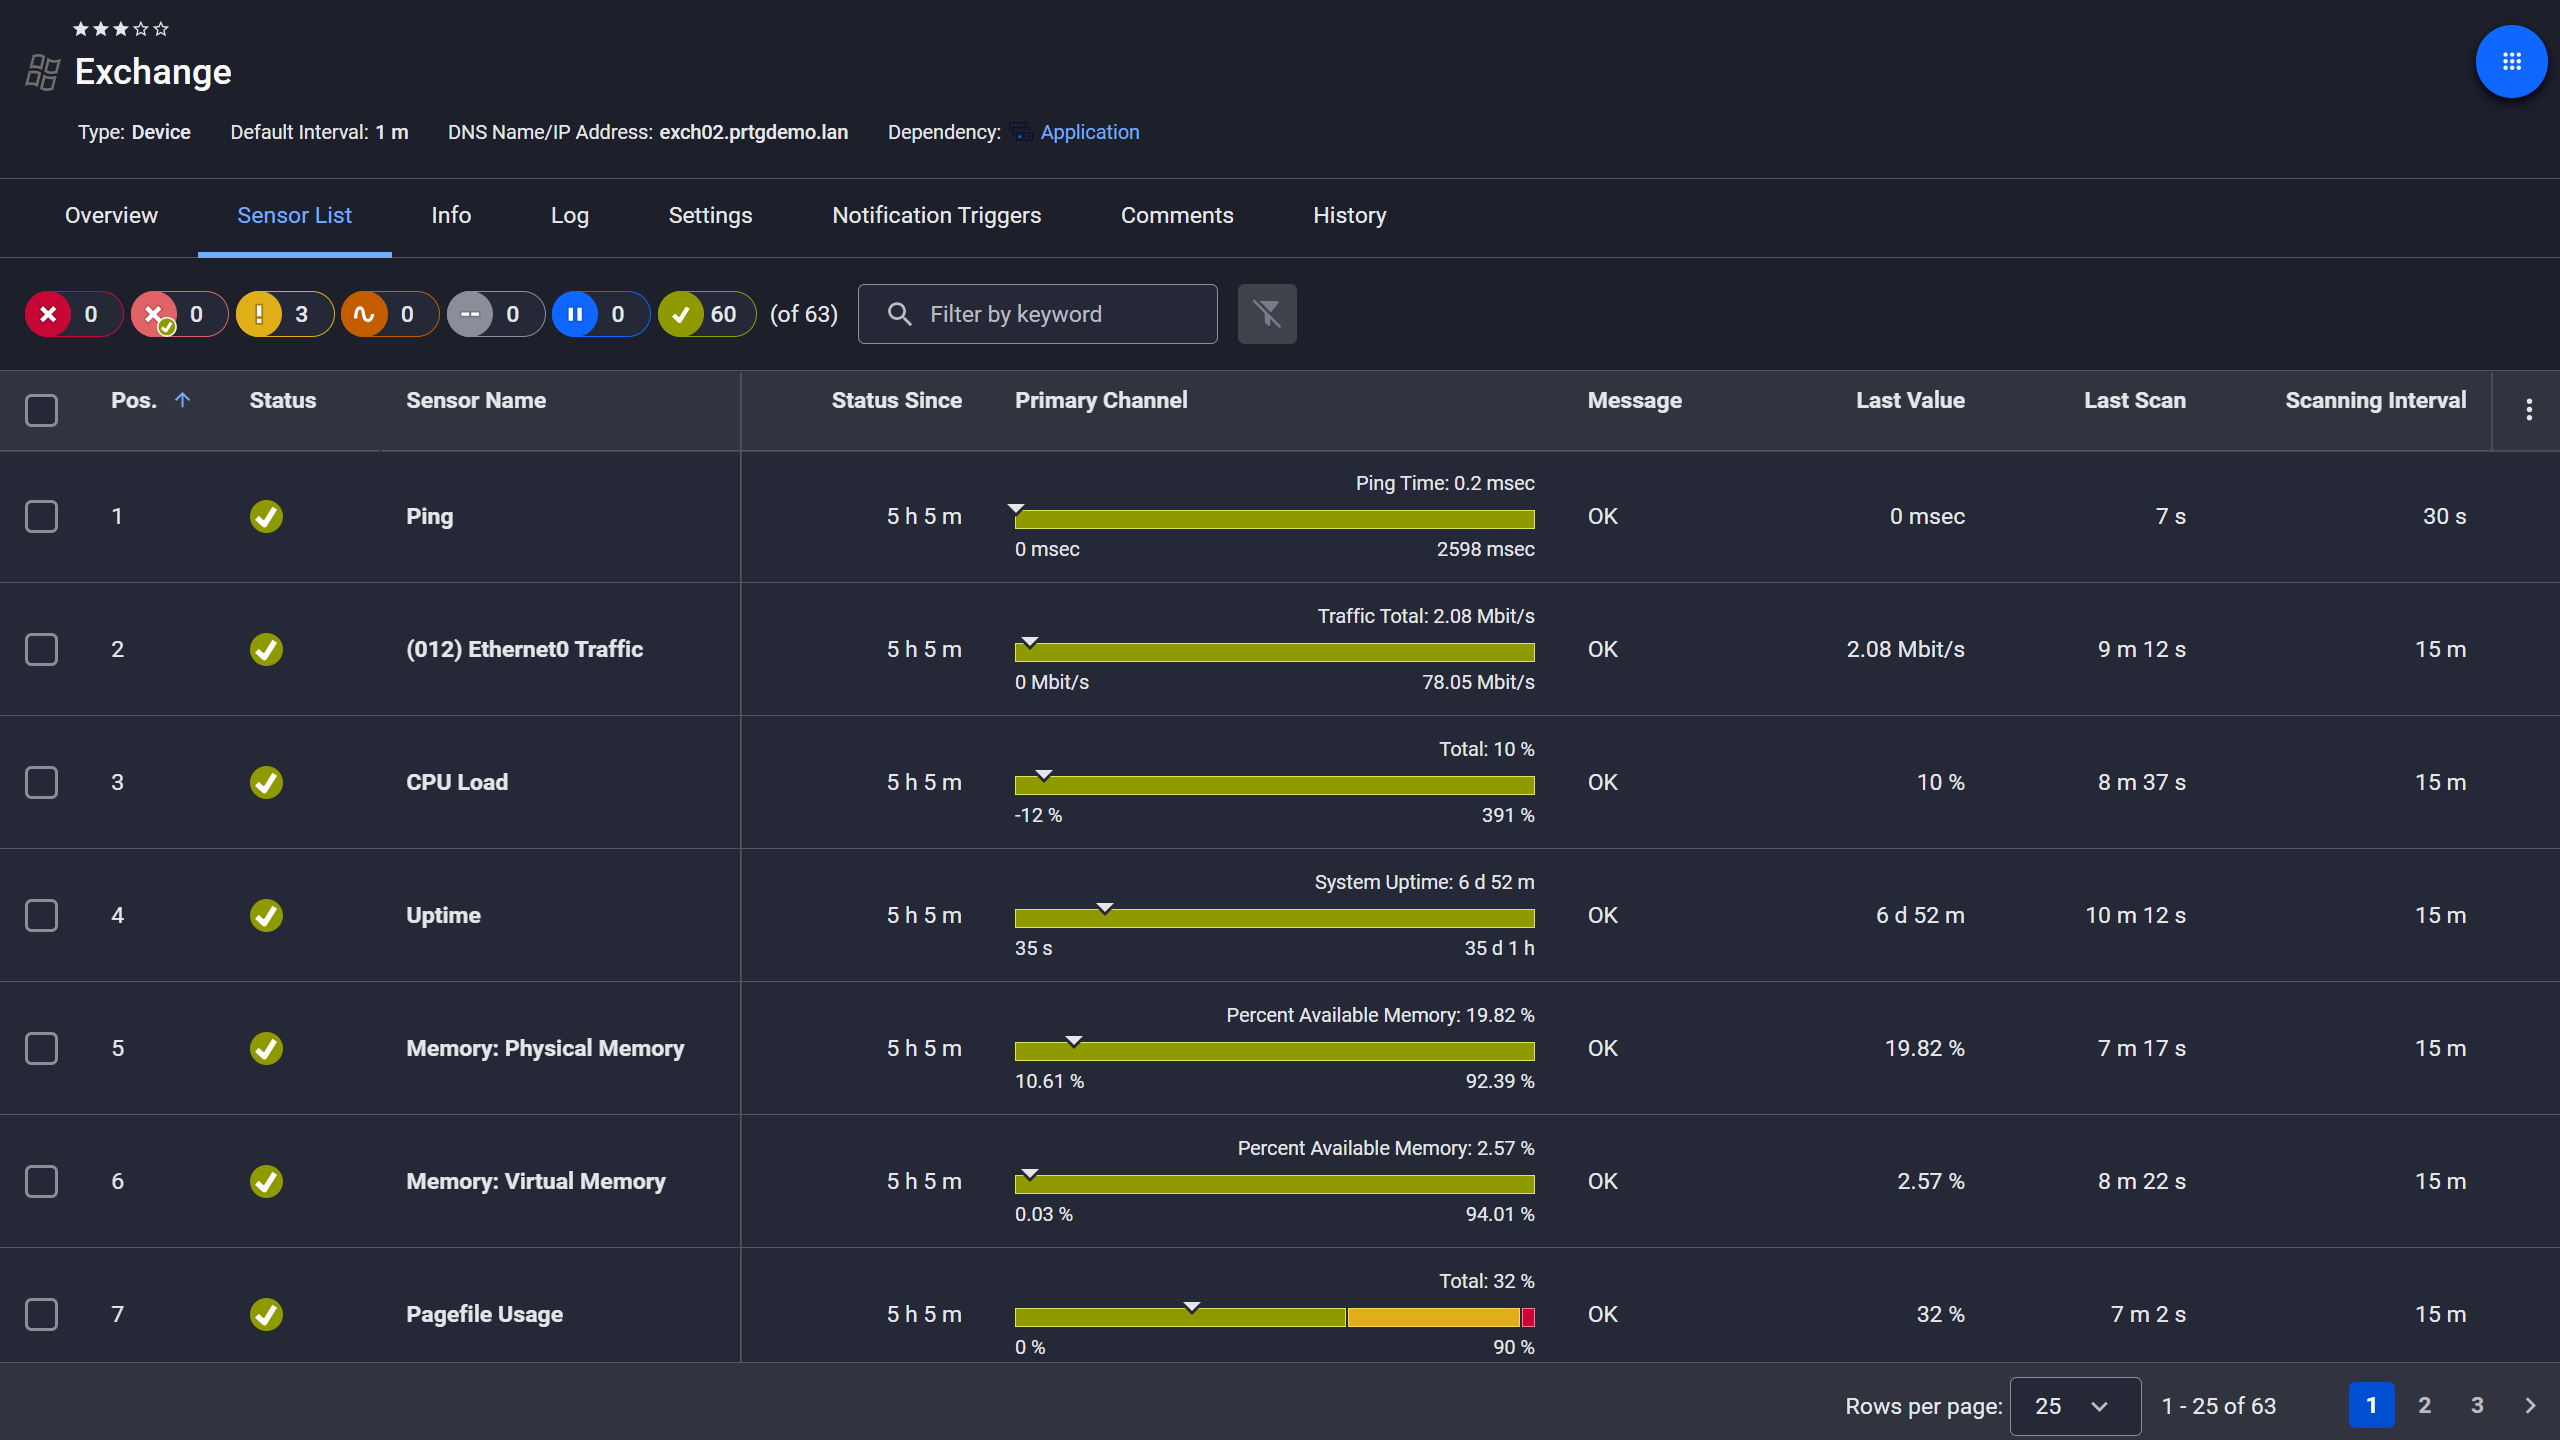
Exchange server, fully under control
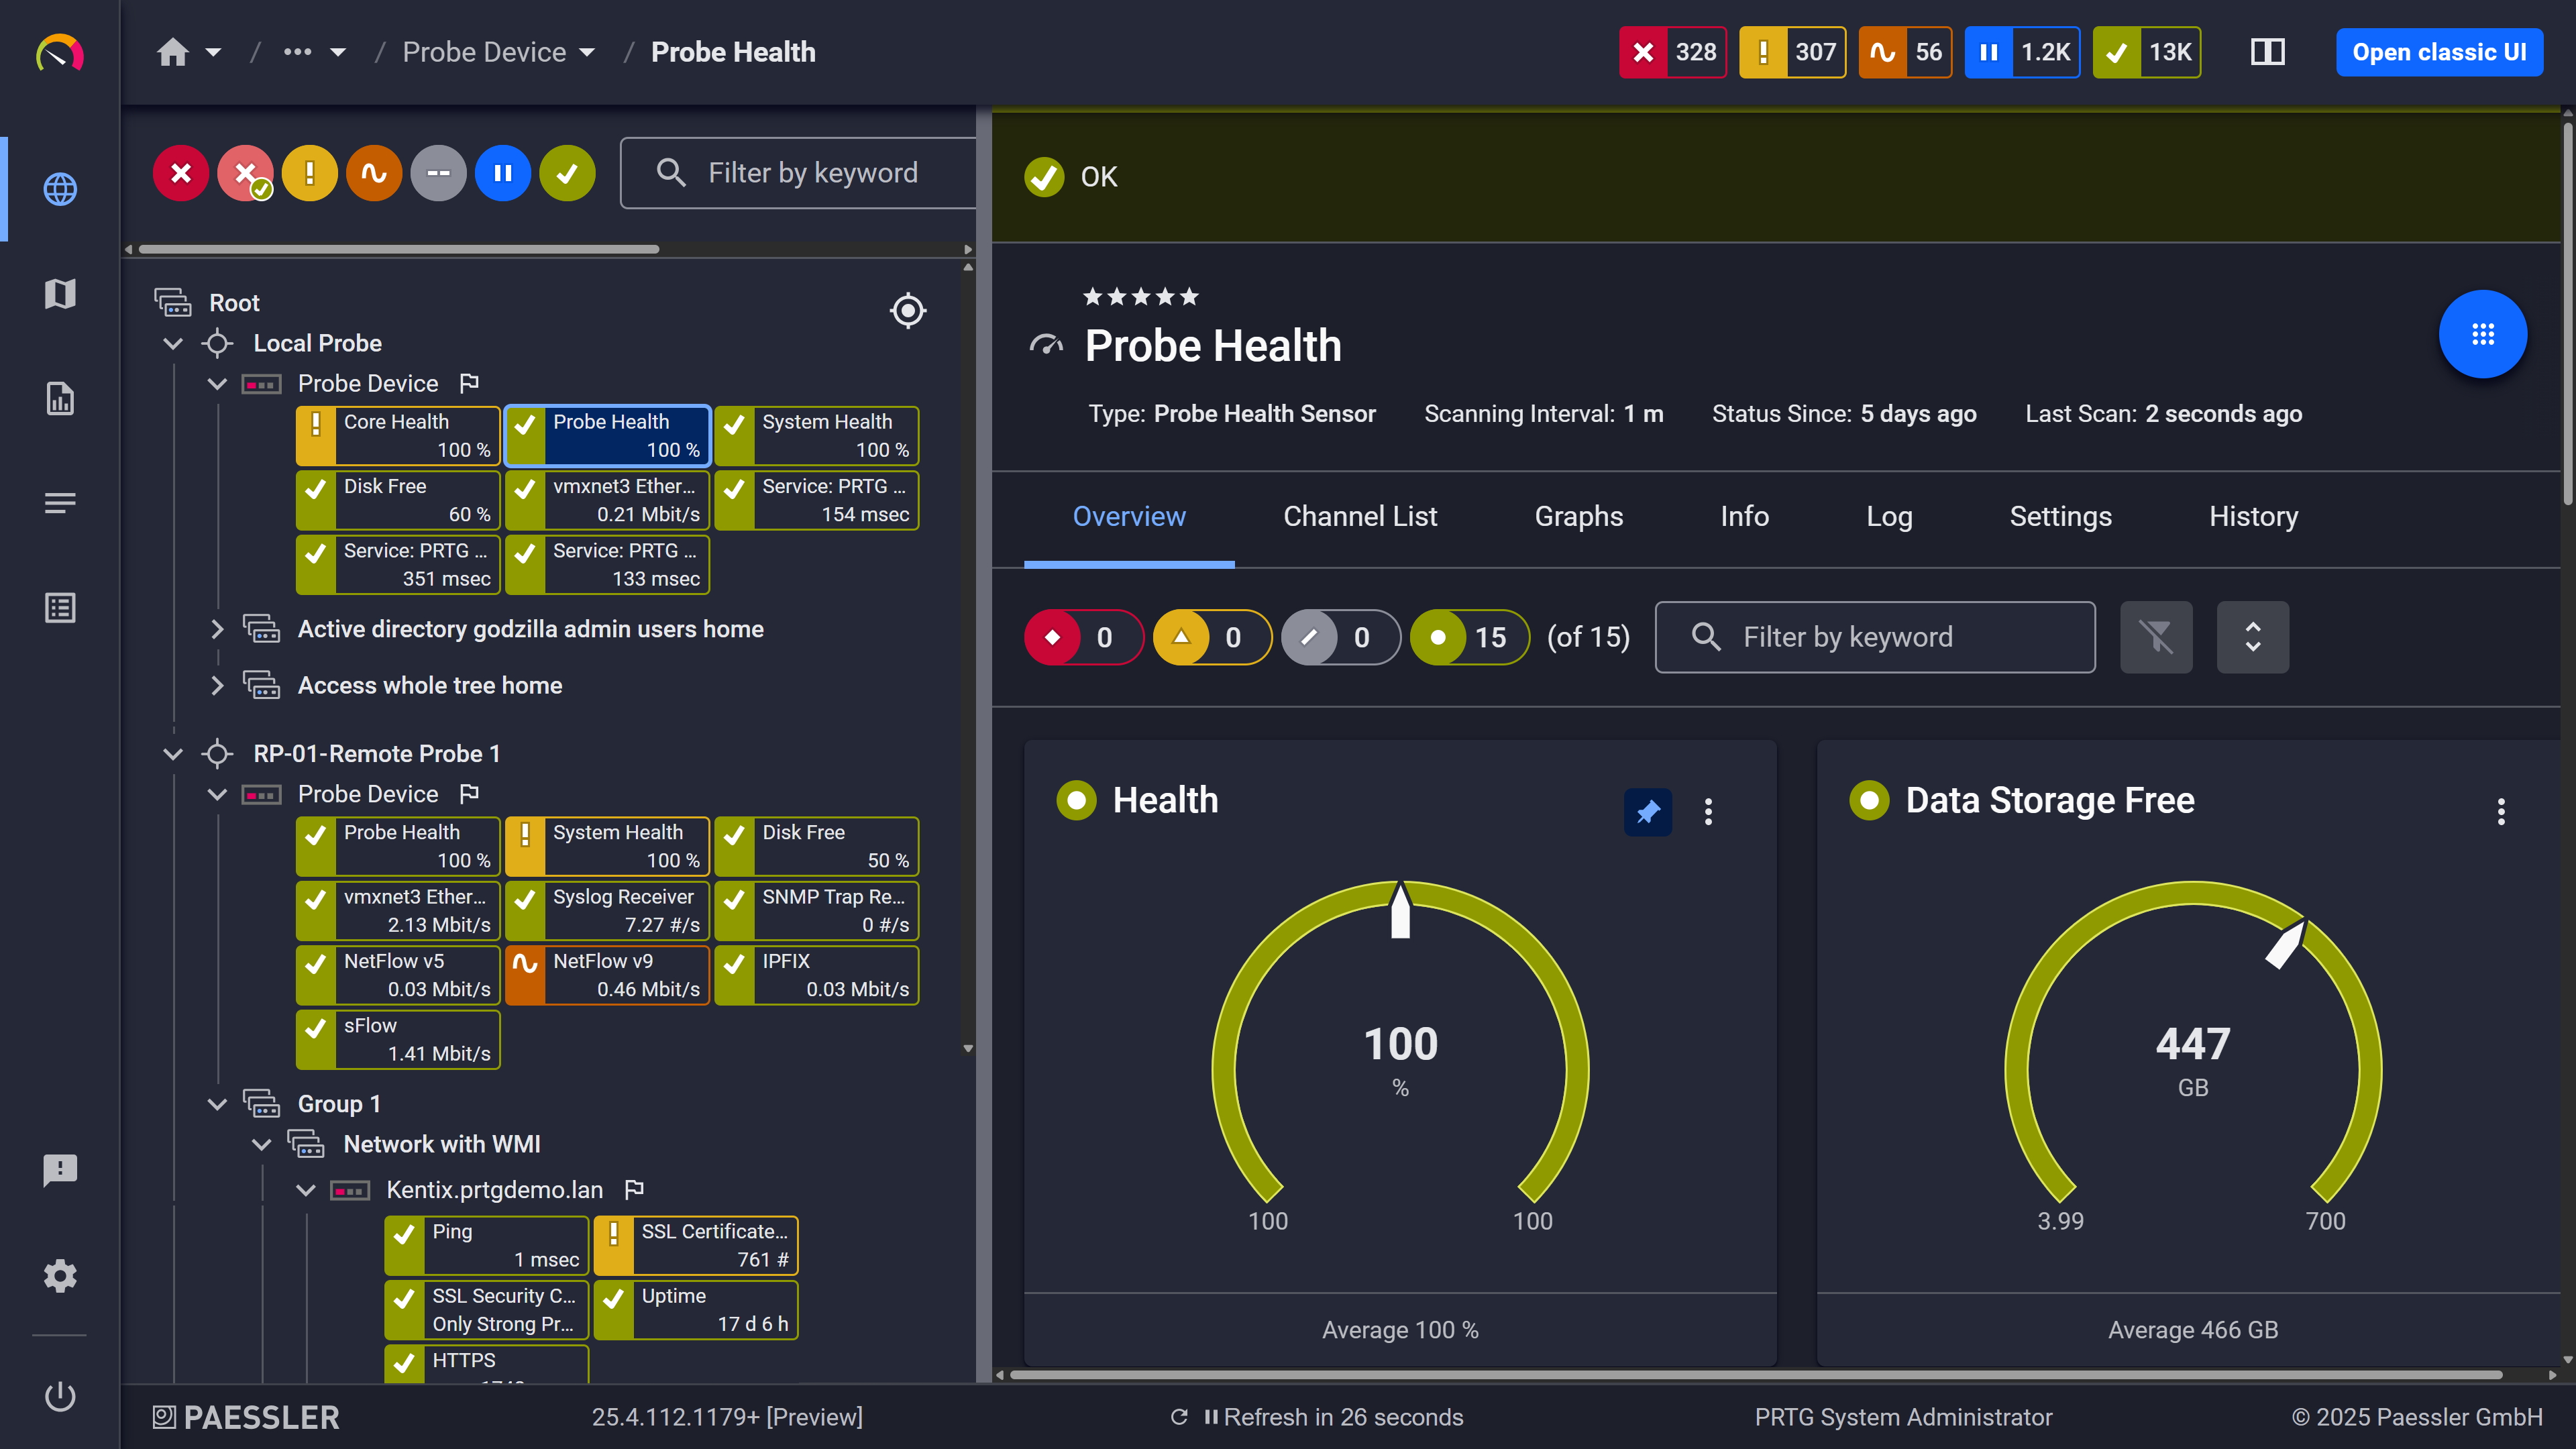
Probe health at a glance

Live graphs, real-time performance data
Running DB instances across multiple AWS regions, or mixing MySQL in one environment with PostgreSQL in another, means constantly switching between CloudWatch consoles. That context switching adds up. Also it creates gaps where things slip through unnoticed.
PRTG consolidates performance data from all your Amazon RDS instances into a single dashboard. One view covers MySQL, PostgreSQL, Oracle, SQL Server, MariaDB, and Amazon Aurora across every AWS region you're monitoring. You get cross-region RDS performance visibility without building anything custom.
Start monitoring your infrastructure in minutes. No professional services, no complex configuration, no risk.
Hitting a storage limit or exhausting available database connections causes outages. Manually checking free disk space, memory, or active connections across dozens of RDS instances isn't a workflow, it's a liability, especially when databases grow at different rates and on different schedules.
PRTG automatically collects storage, memory, and connection metrics from CloudWatch at regular intervals. When free storage drops toward a threshold or connection counts approach max_connections you get a notification with time to act. Not after writes start failing.
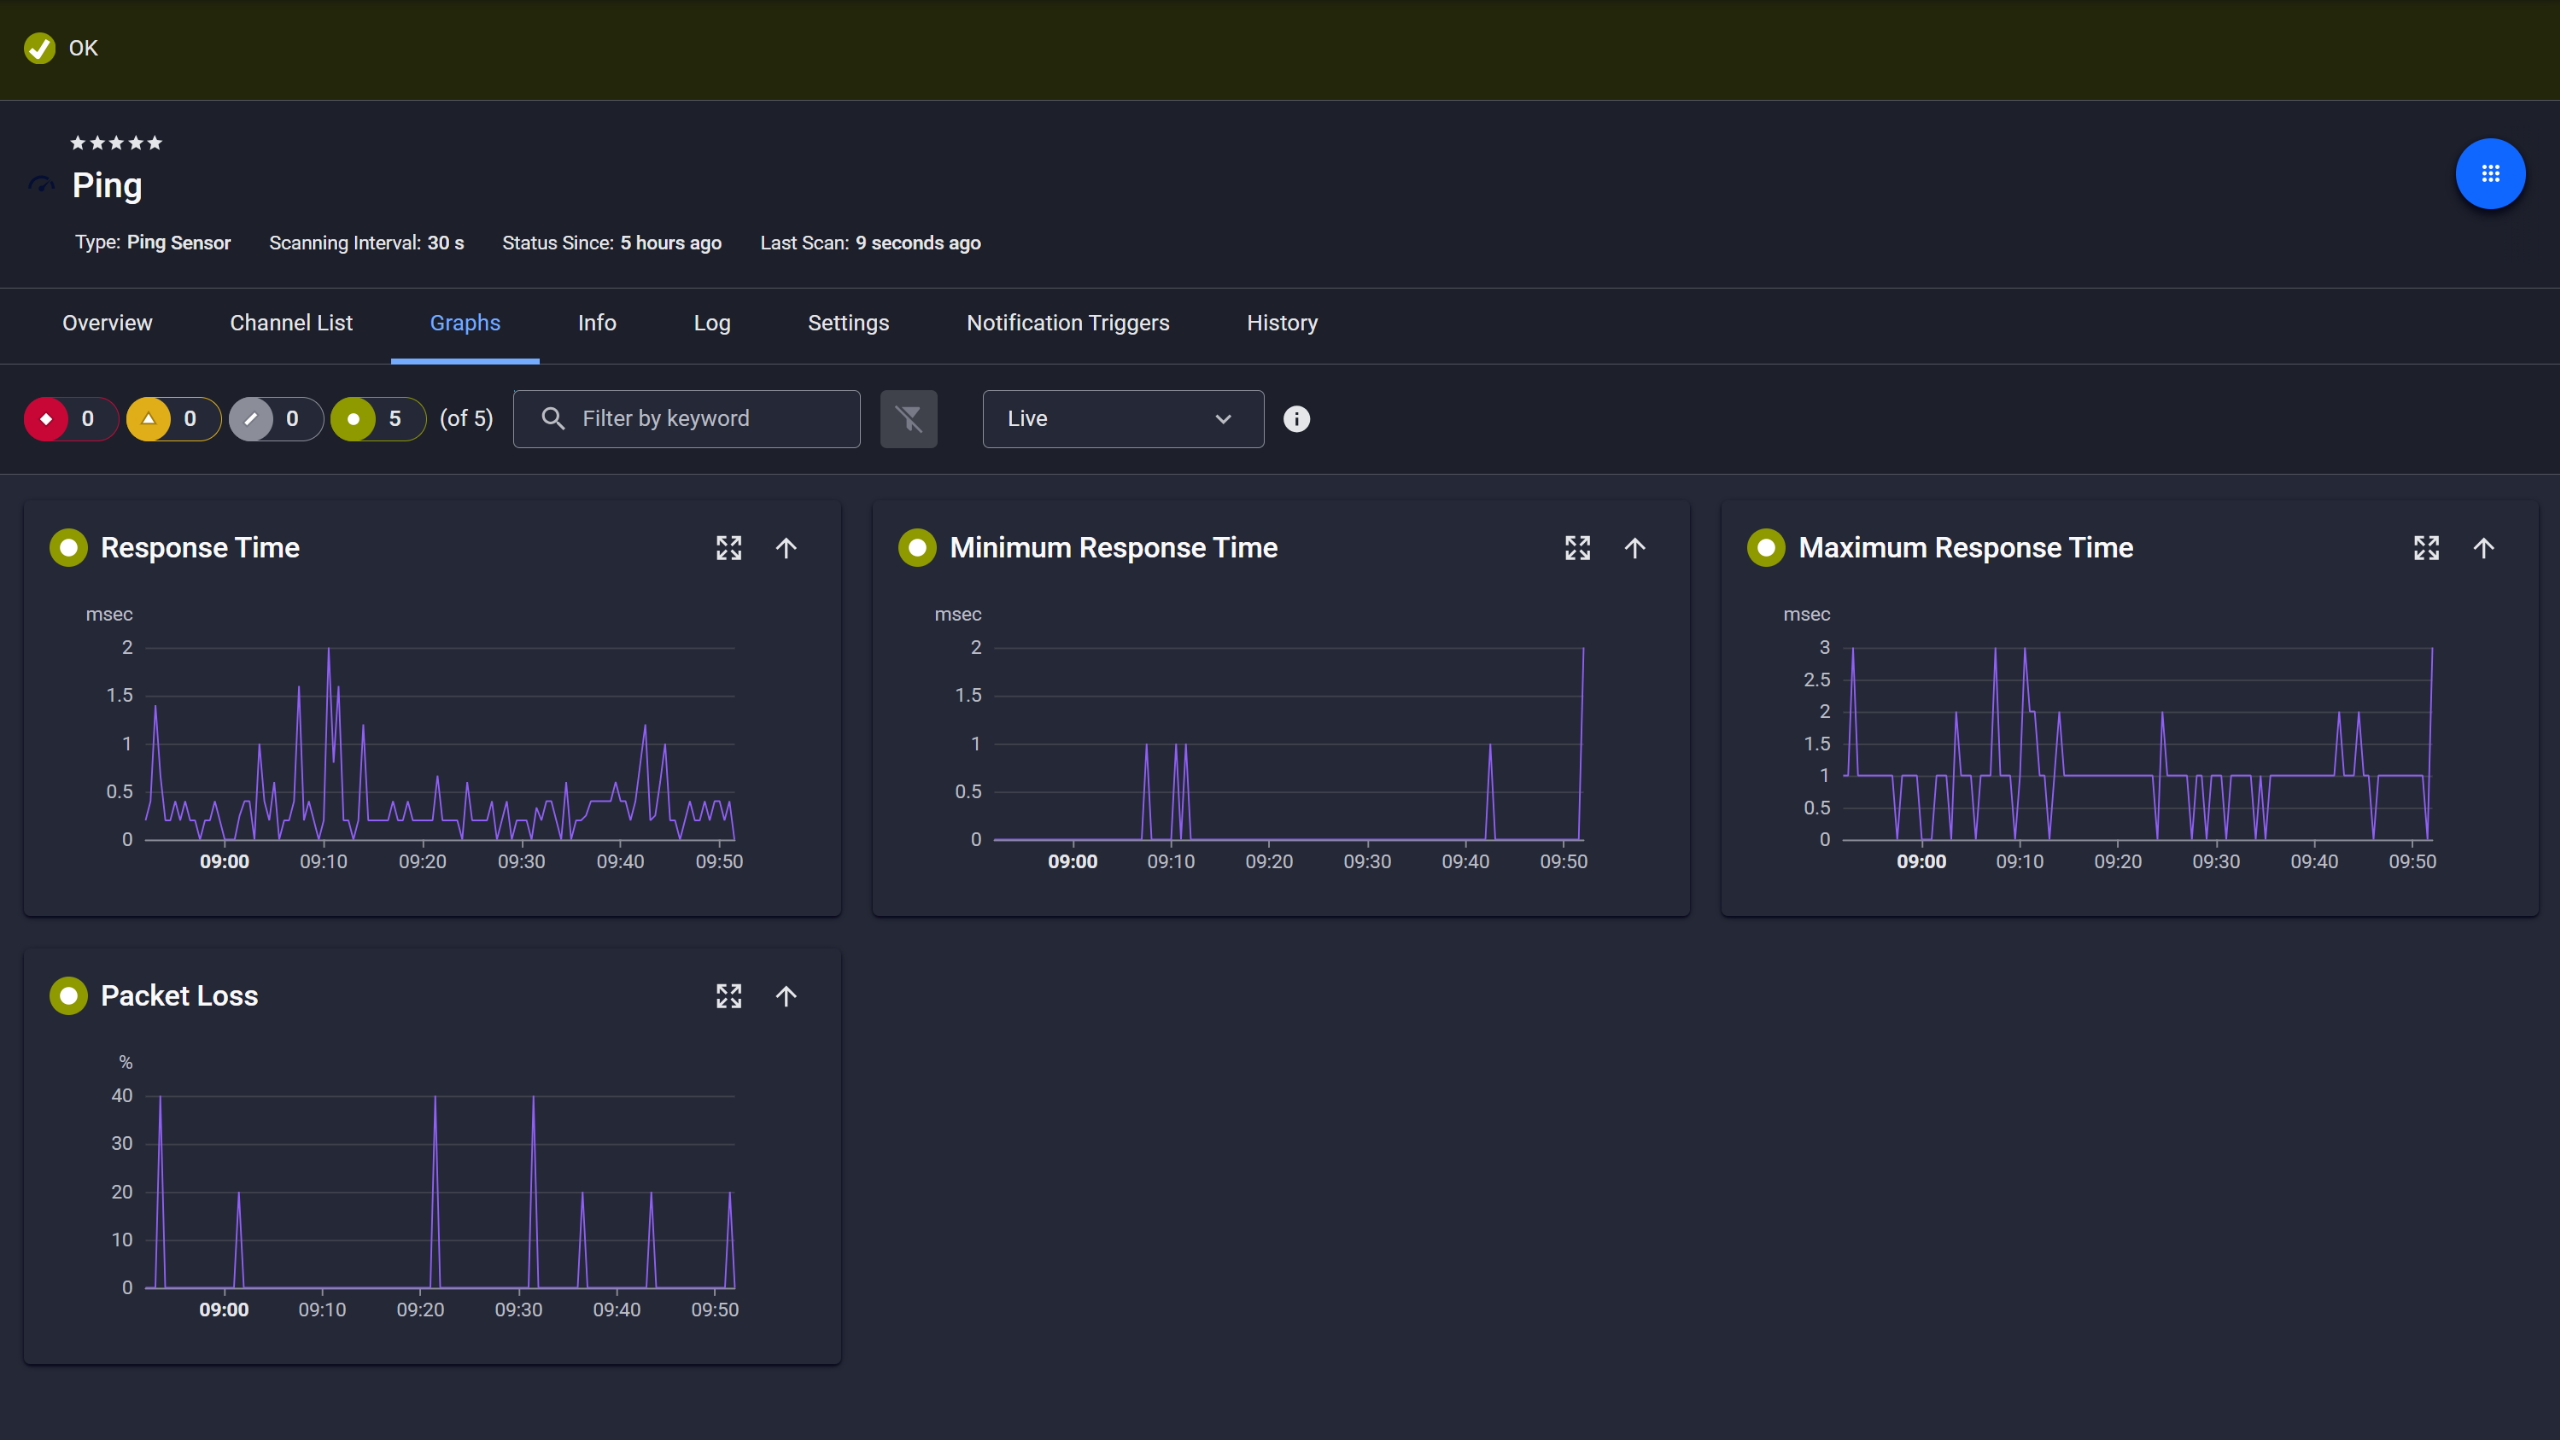
Ping response and packet loss
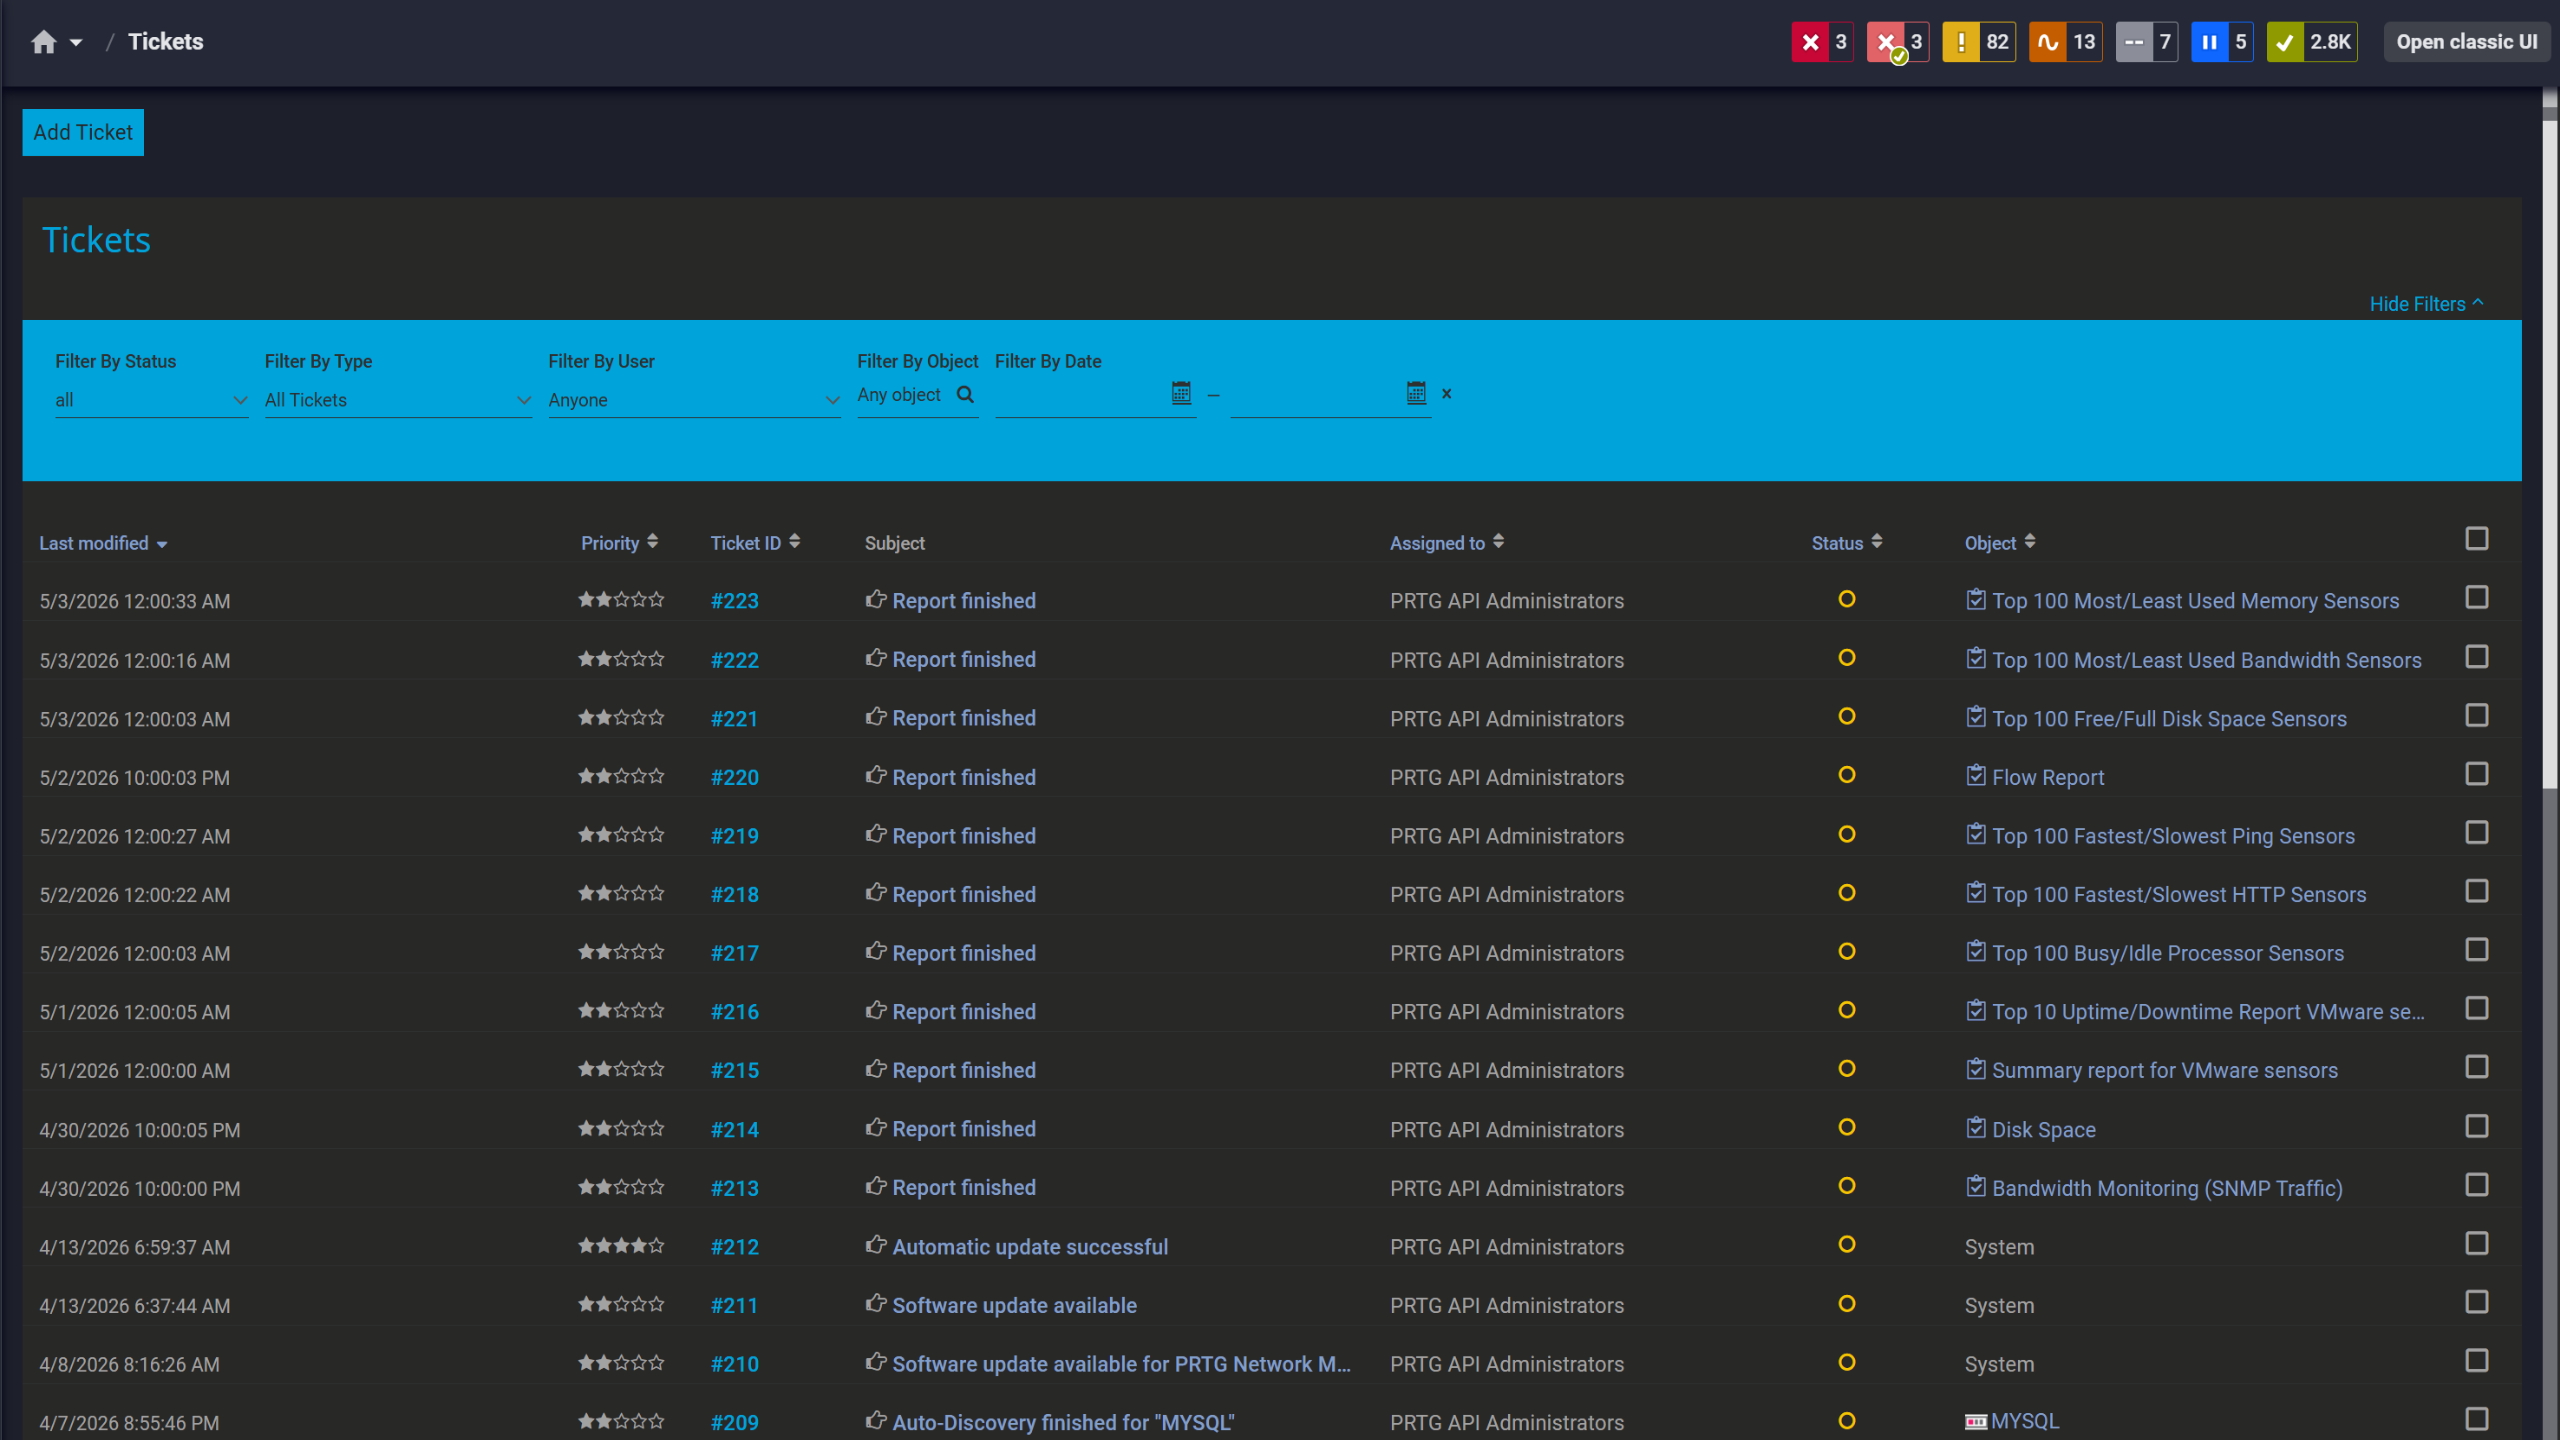
Tickets keep your team aligned

Full device list, instant overview
Network throughput issues or replication lag can degrade database performance without any obvious signal. Without monitoring network receive and transmit rates alongside read replica metrics, you won't spot bandwidth saturation or write latency spikes until applications start behaving strangely.
PRTG monitors network traffic and replication-related cloudwatch metrics, and surfaces changes in throughput patterns or unusual latency as soon as they appear. That visibility matters most in environments running read replicas across availability zones.
PRTG uses the AWS RDS v2 sensor to collect performance metrics from Amazon CloudWatch via the AWS API. Below is an overview of how that works technically.
Monitoring Task | Manual Approach Manual Approach | With PRTG With PRTG |
|---|---|---|
Multi-Region Visibility | Manual Approach Log into separate CloudWatch consoles per region. Build spreadsheets to consolidate data. | With PRTG One dashboard shows all Amazon RDS instances across regions. |
Performance Alerting and Root Cause | Manual Approach Check metrics manually or wait for user complaints. CloudWatch alarms flood your inbox without context for root cause analysis. | With PRTG Threshold-based alerts with historical context show you problems before users notice. |
Historical Trend Analysis | Manual Approach Export CloudWatch data to CSV. Build charts. Lose data when retention expires. | With PRTG Automatic data retention with trend analysis to optimize capacity planning. |
Storage and Connection Monitoring | Manual Approach Log into the AWS console per database instance. Check manually. Find out about problems when writes fail. | With PRTG Automated polling alerts you before you hit storage or connection limits. |
Setup and Configuration | Manual Approach Write Lambda functions and custom scripts using the AWS CLI. Configure alarms per db instance and per metric. | With PRTG Add credentials once, add sensors per instance, start monitoring. |
Choose the PRTG Network Monitor subscription that's best for you.
| License Name | License description | Price | License Details | Get started | Pricing Details | |
|---|---|---|---|---|---|---|
| PRTG 500 | $200 | per month paid annually | Buy nowBuy now | Enough to monitor multiple aspects of 50 devices | ||
| PRTG 1000 | $358 | per month paid annually | Buy nowBuy now | Enough to monitor multiple aspects of 100 devices | ||
| PRTG 2500 | $742 | per month paid annually | Buy nowBuy now | Enough to monitor multiple aspects of 250 devices | ||
| PRTG 5000 | $1,300 | per month paid annually | Buy nowBuy now | Enough to monitor multiple aspects of 500 devices | ||
| PRTG 10000 | $1,642 | per month paid annually | Buy nowBuy now | Enough to monitor multiple aspects of 1000 devices |

PRTG monitors all database engines supported by Amazon CloudWatch via the AWS RDS v2 sensor: MySQL, PostgreSQL (Postgres), MariaDB, Oracle, Microsoft SQL Server, and Amazon Aurora in both MySQL-compatible and PostgreSQL-compatible versions. The engine doesn't change how the sensor works. It pulls cloudwatch metrics the same way regardless.
No. PRTG monitors RDS instances through the CloudWatch API, which sits entirely outside your databases. No agents, no changes to the database instance itself. You need IAM credentials with read permissions for CloudWatch and RDS, that's it.
Yes. Add a separate AWS device in PRTG for each region, then add AWS RDS v2 sensors for the database instances in those regions. This covers us-east-1, eu-west-1, or any other region you're running, all from one PRTG dashboard. No console switching.
The AWS RDS v2 sensor has a fixed minimum scanning interval of 5 minutes. Can't go shorter, regardless of global PRTG scanning settings. Also keep in mind that AWS charges per CloudWatch API call, so balance monitoring frequency against cost. The default 5-minute interval works well for most environments.
No. PRTG collects infrastructure-level monitoring metrics from CloudWatch: CPU, IOPS, connections, latency, network throughput. It doesn't access RDS Performance Insights, Amazon CloudWatch Logs, or query-level log files. For slow query analysis, you'll need performance insights or query analysis tools alongside PRTG's infrastructure observability.
The sensor requires read permissions for CloudWatch and RDS via an AWS API key. Paessler documents the exact required IAM policy in their Knowledge Base article on AWS API key permissions. Check that before deploying, access errors during setup are an easy thing to avoid.
Network Monitoring Software – Version 26.1.116.1532 (February 9th, 2026)
Download for Windows and cloud-based version PRTG Hosted Monitor available
English, German, Spanish, French, Portuguese, Dutch, Russian, Japanese, and Simplified Chinese
Network devices, bandwidth, servers, applications, virtual environments, remote systems, IoT, and more
Choose the PRTG Network Monitor subscription that's best for you


