Custom alerts and data visualization let you quickly identify and prevent hard drive health, performance, and storage issues.
Is there anything more frustrating than thinking you've saved a document, only for your changes to disappear? Or waiting patiently for a critical update that aborts at the last minute?
Hard disk storage is important for all sorts of processes across your organization. But when you've got a million and one things to do, monitoring it can easily slip your mind.
With the Paessler PRTG hard disk check program, available system memory is one less thing on your plate.
Running unobtrusively in the background, PRTG regulates available hard disk space and alerts you when it's low, giving you the peace of mind that you won't get caught out and hard disk performance is always optimized.

PRTG automatically recognizes all existing hard drives, statuses, and free disk space. There's no need to fiddle about with system settings or hardware detection tools.
Set warning and error thresholds and get on with more important jobs. PRTG alerts you when disk space and other detailed information of any storage device goes below the defined value, so you can act before it's too late.
PRTG helps you quickly identify system issues or underperforming hardware, and prevent errors, system failures, and other costly technical problems. Even network file systems get checked.
Diagnose network issues by continuously tracking physical drives. Show hard disk space, disk utility, SSD and HDD health, drive performance, and other key metrics in real time. Visualize monitoring data in clear graphs and dashboards to identify problems more easily. Gain the overview you need to troubleshoot hard drive failures and degradations, as well as storage and data recovery issues.
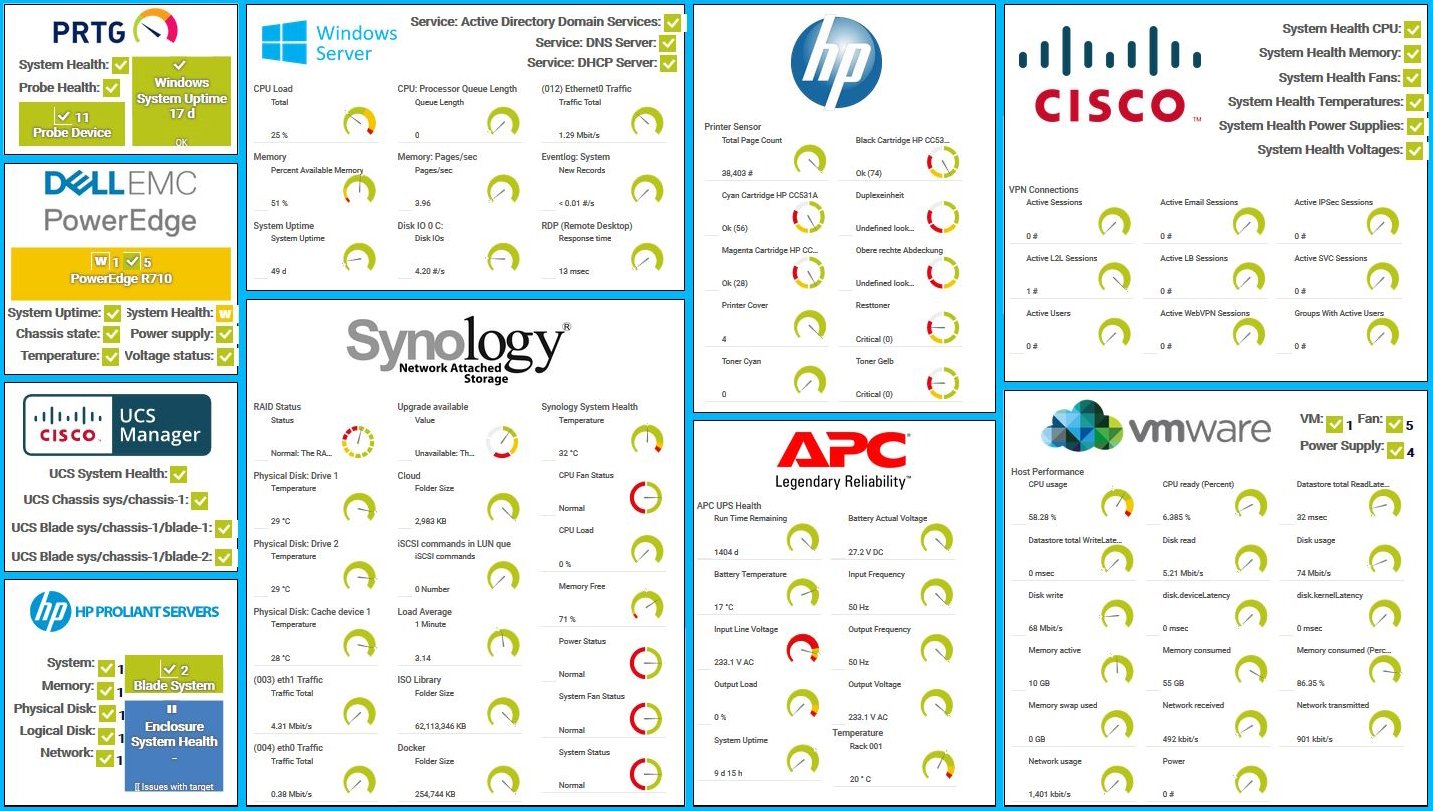
Custom PRTG dashboard for hardware monitoring

Device tree view of the complete monitoring setup

Custom PRTG dashboard for keeping an eye on the entire IT infrastructure
“All-around winning
network monitor”
“The real beauty of PRTG is the endless possibilities it offers”
“PRTG Network Monitor
is very hard to beat”
PRTG comes with sophisticated, preconfigured sensors to show available disk space on:
It also performs health checks and monitors performance, alerting you when there's a risk of errors. And it can even check if a specific file exists on your network, and log modifications to files you've flagged.
Each sensor operates 24/7 tracking values across your whole network, including:
PRTG comes with more than 250 native sensor types for monitoring your entire on-premises, cloud, and hybrid cloud environment out of the box. Check out some examples below!
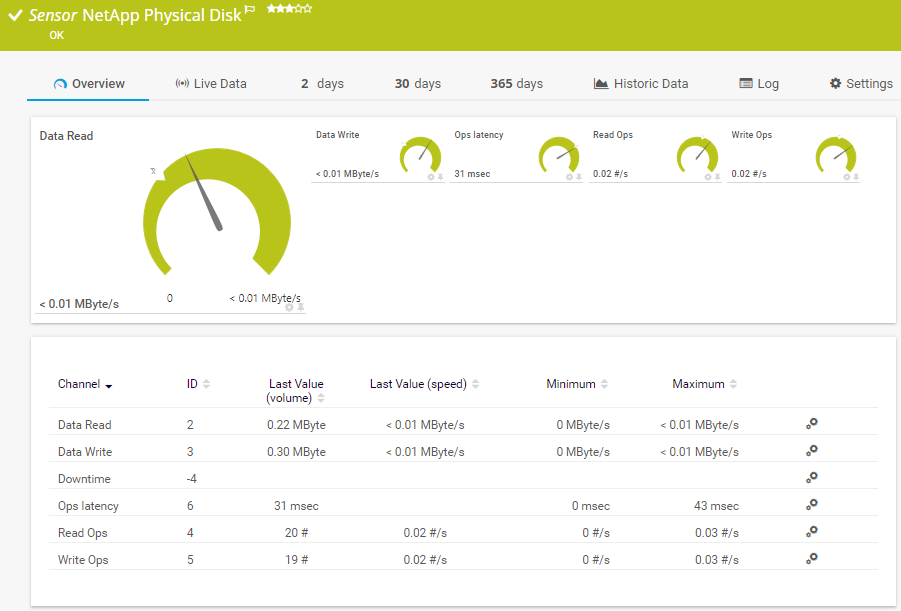
The NetApp Physical Disk v2 sensor monitors physical disks of a NetApp storage system using ONTAP. It can show the following:
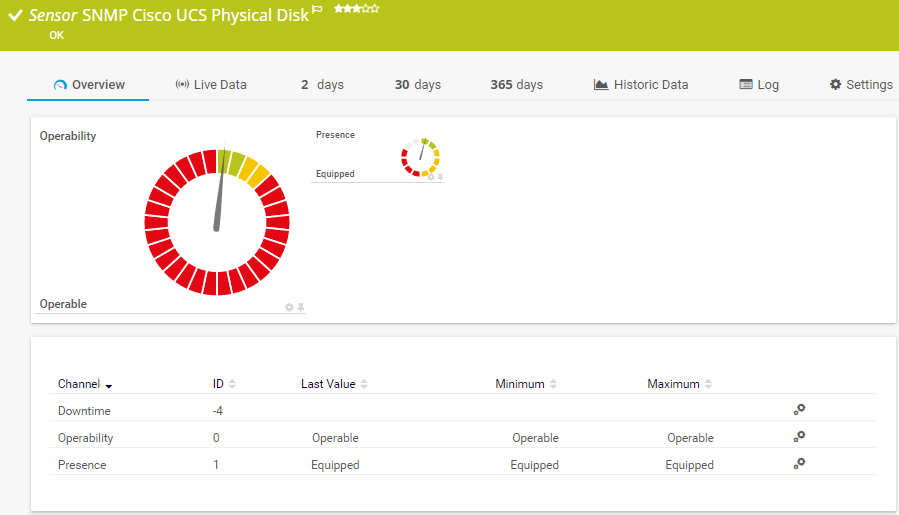
The SNMP Cisco UCS Physical Disk sensor monitors a physical disk of a Cisco Unified Computing System device. It can show the following:
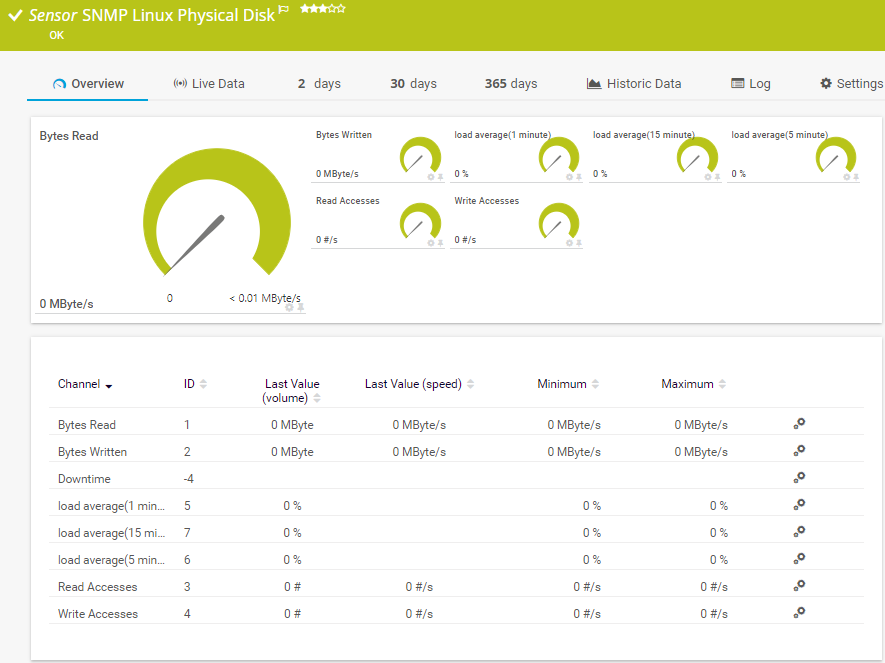
The SNMP Linux Physical Disk sensor monitors the input/output (I/O) on disks of a Linux/Unix system. It can show the following:
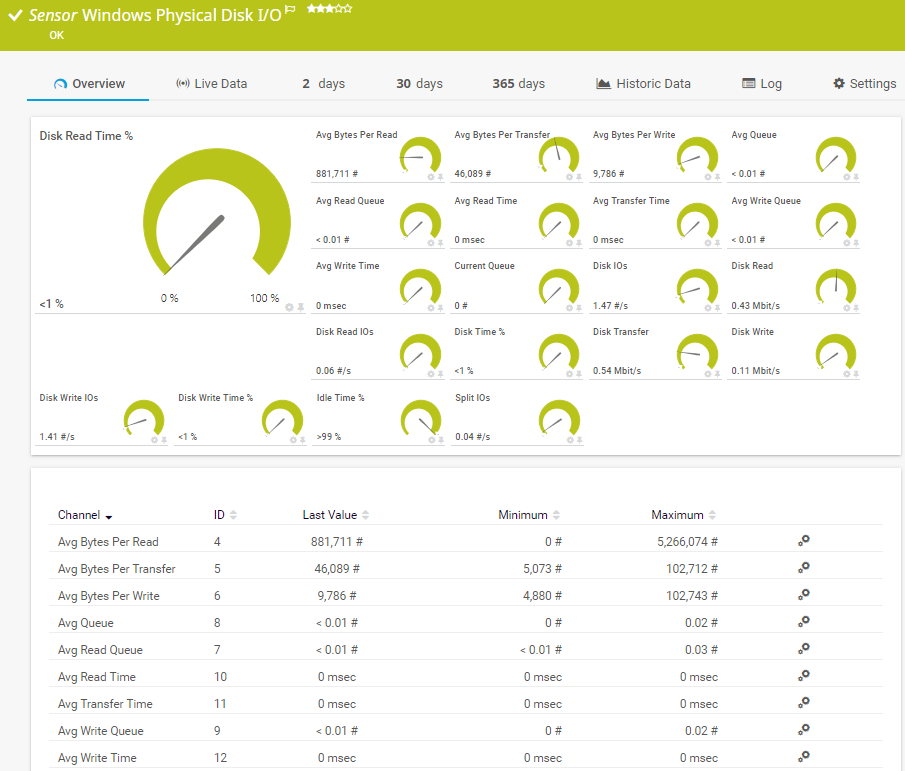
The Windows Physical Disk I/O sensor monitors the input/output (I/O) parameters of a hard disk on a Windows system via Windows Management Instrumentation (WMI) or Windows performance counters. It can show the following:
See the PRTG Manual for a list of all available sensor types.

Custom alerts and data visualization let you quickly identify and prevent hard drive health, performance, and storage issues.
PRTG is set up in a matter of minutes and can be used on a wide variety of mobile devices.

For NetApp, Paessler has proven to be one of the qualified, best-of-breed infrastructure and application providers whose products have been tested to expertly integrate with NetApp storage systems.
What does this mean for you?
Partnering with innovative IT vendors, Paessler unleashes synergies to create
new and additional benefits for joined customers.
baramundi and PRTG create a secure, reliable and powerful IT infrastructure where you have everything under control - from the traffic in your firewall to the configuration of your clients.
With ScriptRunner Paessler integrates a powerful event automation platform into PRTG Network Monitor.
UVexplorer integrates tightly with PRTG to bring fast and accurate network discovery, detailed device inventory, and automatic network mapping to the PRTG platform.
Real-time notifications mean faster troubleshooting so that you can act before more serious issues occur.
Network Monitoring Software – Version 26.1.116.1532 (February 9th, 2026)
Download for Windows and cloud-based version PRTG Hosted Monitor available
English, German, Spanish, French, Portuguese, Dutch, Russian, Japanese, and Simplified Chinese
Network devices, bandwidth, servers, applications, virtual environments, remote systems, IoT, and more
Choose the PRTG Network Monitor subscription that's best for you

PRTG is a proprietary software tool that takes the effort out of ensuring you always have optimal disk space. Available for Windows-based on-premises servers or as a cloud-hosted solution, it's capable of monitoring unlimited devices, bringing critical system data together in one simple, intuitive interface you can access from anywhere: at the office, at home, or on the go.
Put simply, because it saves you time, money, and frustration. Think of it as an eagle-eyed guardian who doesn't miss a thing (and never sleeps), constantly checking memory levels and your hardware's performance so you don't have to. Warning you of potential issues like data loss before they slow everyone down or crash the system.
Windows-based physical drives are monitored via WMI. Hard drives on Linux and Unix systems are monitored using SSH. Other servers, including SMB network file systems, are monitored via SNMP.
We're so confident you'll love PRTG that it comes with a free, no-obligation 30-day trial. Should you decide to keep using it, you can find our pricing list here.
In PRTG, “sensors” are the basic monitoring elements. One sensor usually monitors one measured value in your network, for example the traffic of a switch port, the CPU load of a server, or the free space on a disk drive. On average, you need about 5-10 sensors per device or one sensor per switch port.
Paessler conducted trials in over 600 IT departments worldwide to tune its network monitoring software closer to the needs of sysadmins. The result of the survey: over 95% of the participants would recommend PRTG – or already have.

Paessler PRTG is used by companies of all sizes. Sysadmins love PRTG because it makes their job a whole lot easier.
Bandwidth, servers, virtual environments, websites, VoIP services – PRTG keeps an eye on your entire network.
Everyone has different monitoring needs. That’s why we let you try PRTG for free.