• Company
    • About Us
    • Case Studies
    • Press Center
    • Careers
    • Blog
    • Contact us
  • Contact us
  • Login
 
  • English
    • Deutsch
    • Español
    • Français
    • Italiano
    • Português
Paessler
                    - The Monitoring Experts
  • Products
    • Paessler PRTG
      Paessler PRTGMonitor your whole IT infrastructure
      • PRTG Network Monitor
      • PRTG Enterprise Monitor
      • PRTG Hosted Monitor
      • PRTG UVexplorer
      • PRTG extensionsExtensions for Paessler PRTGExtend your monitoring to a new level
    • Icon Features
      FeaturesExplore all monitoring features
      • Maps & dashboards
      • Alerts & notifications
      • Multiple user interfaces
      • Distributed monitoring
      • Customizable reporting
  • Solutions
    • Industries
      IndustriesMonitor various industry sectors
      • Industrial
      • Healthcare
      • Data Center
      • Education
      • Finance
      • Government
    • IT Topics
      IT TopicsMonitor all areas of IT
      • Network Monitoring
      • Bandwidth Monitoring
      • SNMP Monitor
      • Network Mapping
      • WiFi Monitoring
      • Server Monitoring
  • Pricing
  • Resources
    • Getting Started
      Getting StartedModules for self-paced learning
    • How-to Guides
      How-to GuidesGet the most out of PRTG
    • Videos & Webinars
      Videos & WebinarsLearn from Paessler experts
    • IT  Knowledge
      IT KnowledgeExpand your IT knowledge
    • PRTG Manual
      PRTG ManualFull documentation
    • Knowledge Base
      Knowledge BaseShare community knowledge
    • PRTG Sensor Hub
      PRTG Sensor HubGet sensors, scripts & templates
    • Trainings
      PRTG TrainingLearn how to work with PRTG
  • Partners
    • Icon Handshake
      Become a PartnerFor resellers and channel partners
    • Icon MSP
      Become an MSPDeliver monitoring as a managed service
    • icon partner
      Partner PortalLog in to your partner account
    • Deal Registration
      Deal RegistrationRegister your sales opportunities
    • icon search
      Find a PartnerFind partners selling Paessler products
    • icon technology
      Technology AlliancesSee Paessler technology partnerships
    • Partner HubTools for Your Success
  • Company
    • About Us
    • Case Studies
    • Press Center
    • Careers
    • Blog
    • Contact us
  • Contact us
  • Login
  • English
    • Deutsch
    • Español
    • Français
    • Italiano
    • Português
  • Get a quote
  • Free trial

Automated Network Reporting 

Stop compiling reports manually. PRTG schedules, generates, and delivers network data. On your terms. 

Free download
PRODUCT OVERVIEW

What Should a Network Reporting Tool Actually Show You?  

Real network reporting means continuous, measured data, not numbers pulled together after the fact. Interface status, bandwidth utilization, uptime, CPU and memory load, response times: all stored historically, reportable on demand or on a schedule.

Configurable templates define what goes into each report and how granular the output is. The same data can feed a technical deep-dive or a clean management summary. Paessler PRTG covers routers, switches, firewalls, servers, and endpoints across vendors and protocols in one network monitoring and reporting platform.

Supported technologies: Routers, switches, firewalls, servers, and endpoints, monitored via SNMP (v1/v2c/v3), WMI, NetFlow, IPFIX, sFlow, jFlow v5, Packet Sniffing, and API-based monitoring (where devices/services provide an HTTP/REST interface). Supports Cisco, Juniper, HP, Dell, and other major vendors.

Download PRTG Trial

What you will find on this page

  • How Network Reporting Helps You
  • How to Collect Network Data
  • Manual Network Reporting vs. PRTG
  • FAQs

PRTG is compatible with all major vendors, products, and systems

compatible with all major vendors, products, and systems

Network Reporting That Works the Way Your Team Does

Network Reports That Generate Easily

Regular network reporting has real value for IT teams and stakeholders alike. The challenge is keeping it consistent without it consuming recurring engineering time. PRTG handles it. Define the scope, the time window, and the output format once. From there, custom reports generate and land in inboxes automatically: daily, weekly, monthly, or on whatever schedule fits your team. No recurring effort required.

  • Schedule reports daily, weekly, monthly, or at custom intervals
  • Automatic email delivery to configured recipients
  • Output as HTML, CSV, or XML: match the format to the audience
  • Configurable report templates: define scope, time range, and output format once, then reuse

Availability Data, Ready When You Need It

Availability data is most useful when it's already there, continuous and structured, before anyone requests it. PRTG tracks sensor status (up, down, warning) and stores it. When you need availability data, you pull a report. Yesterday, last month, last quarter, custom range: it's there. Downtime incidents, timestamps, threshold breaches: all included alongside availability percentages per device or interface. End-users and stakeholders get the numbers they need without your team spending an afternoon finding them.

  • Per-sensor and per-device availability tracked continuously
  • Configurable time windows including custom date ranges
  • Downtime events logged with timestamps per interface and device
  • Threshold breach history included alongside availability data
PRTG reports list showing scheduled monitoring reports with run times and sensor counts

Scheduled reports, always on time

PRTG web interface showing live performance graphs for a Probe Health sensor

Live graphs, real-time performance data
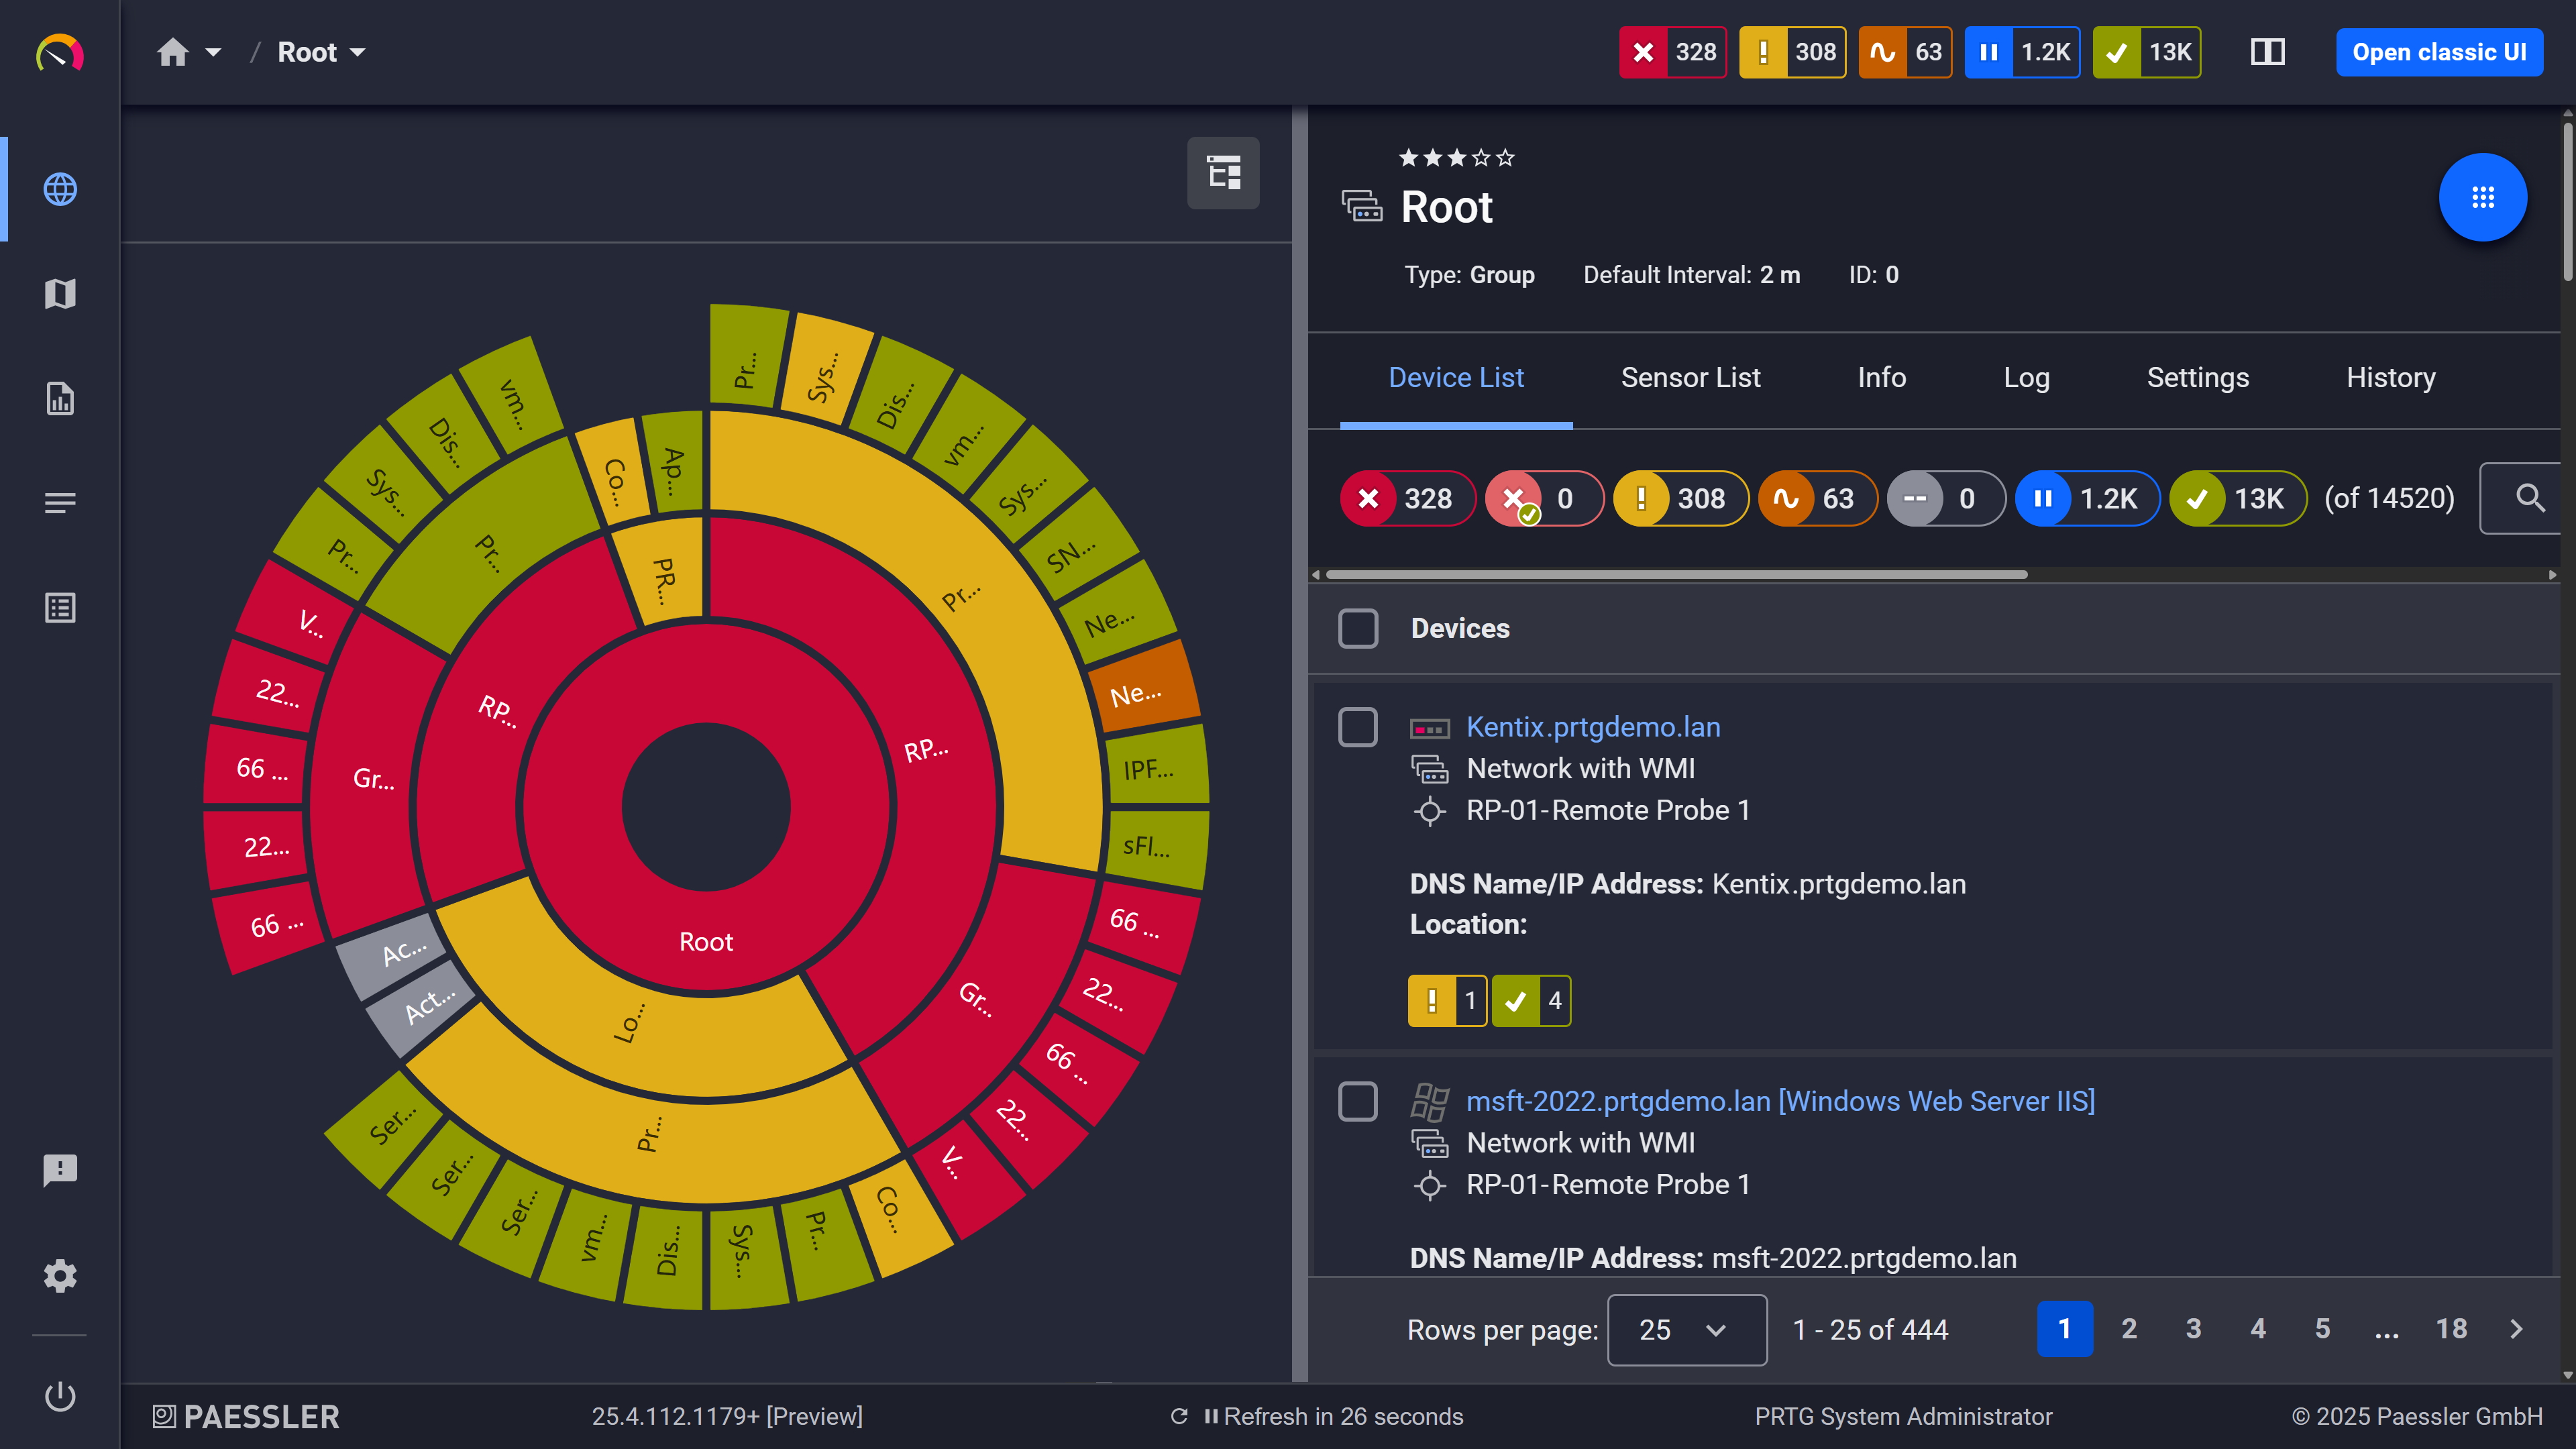
PRTG sunburst chart visualizing the full network hierarchy with color-coded sensor status

Your entire network, visualized instantly

Turn Six Months of Utilization Data Into a Budget Argument

Capacity planning and budget decisions land better when they're backed by measured data. Six months of utilization trends, sustained peaks, and interface load history give stakeholders something concrete to act on. PRTG retains historical monitoring data across all sensors. Bandwidth per interface, CPU and memory load, disk usage: all reportable across any time window you define. Longer periods are automatically averaged, so the output stays readable without losing trend visibility. Export to CSV or XML to pull data into external tools: Excel, a BI platform, or a SQL-based reporting environment.

  • Interface throughput history: peaks, averages, and sustained load over time
  • CPU, memory, and disk utilization trends per device
  • Report any time window: days, weeks, months, or custom
  • Export as CSV or XML for further analysis in external tools, including SQL-based environments

See Why IT Professionals Trust PRTG

Start monitoring your infrastructure in minutes. No professional services, no complex configuration, no risk.

Free download
PRODUCT OVERVIEW

The Right Report Format for Every Audience

A raw sensor value table works for a network engineer during troubleshooting, not for a department head in a monthly review. Most teams default to one format, and it fits at least one audience poorly. PRTG report templates control scope and granularity: each recipient gets a report relevant to them, from detailed per-sensor data for technical teams to graph-based summaries for management. Role-based access controls keep dashboards and reports visible only to authorized users. The Map Designer lets you build visual infrastructure views alongside formal reports by placing map objects onto a configurable layout, no scripting required.
  • Adjustable granularity: raw sensor data tables or graph-only views
  • Report scope selectable per sensor, group, or entire device tree
  • Role-based access controls: reports and dashboards visible only to authorized users
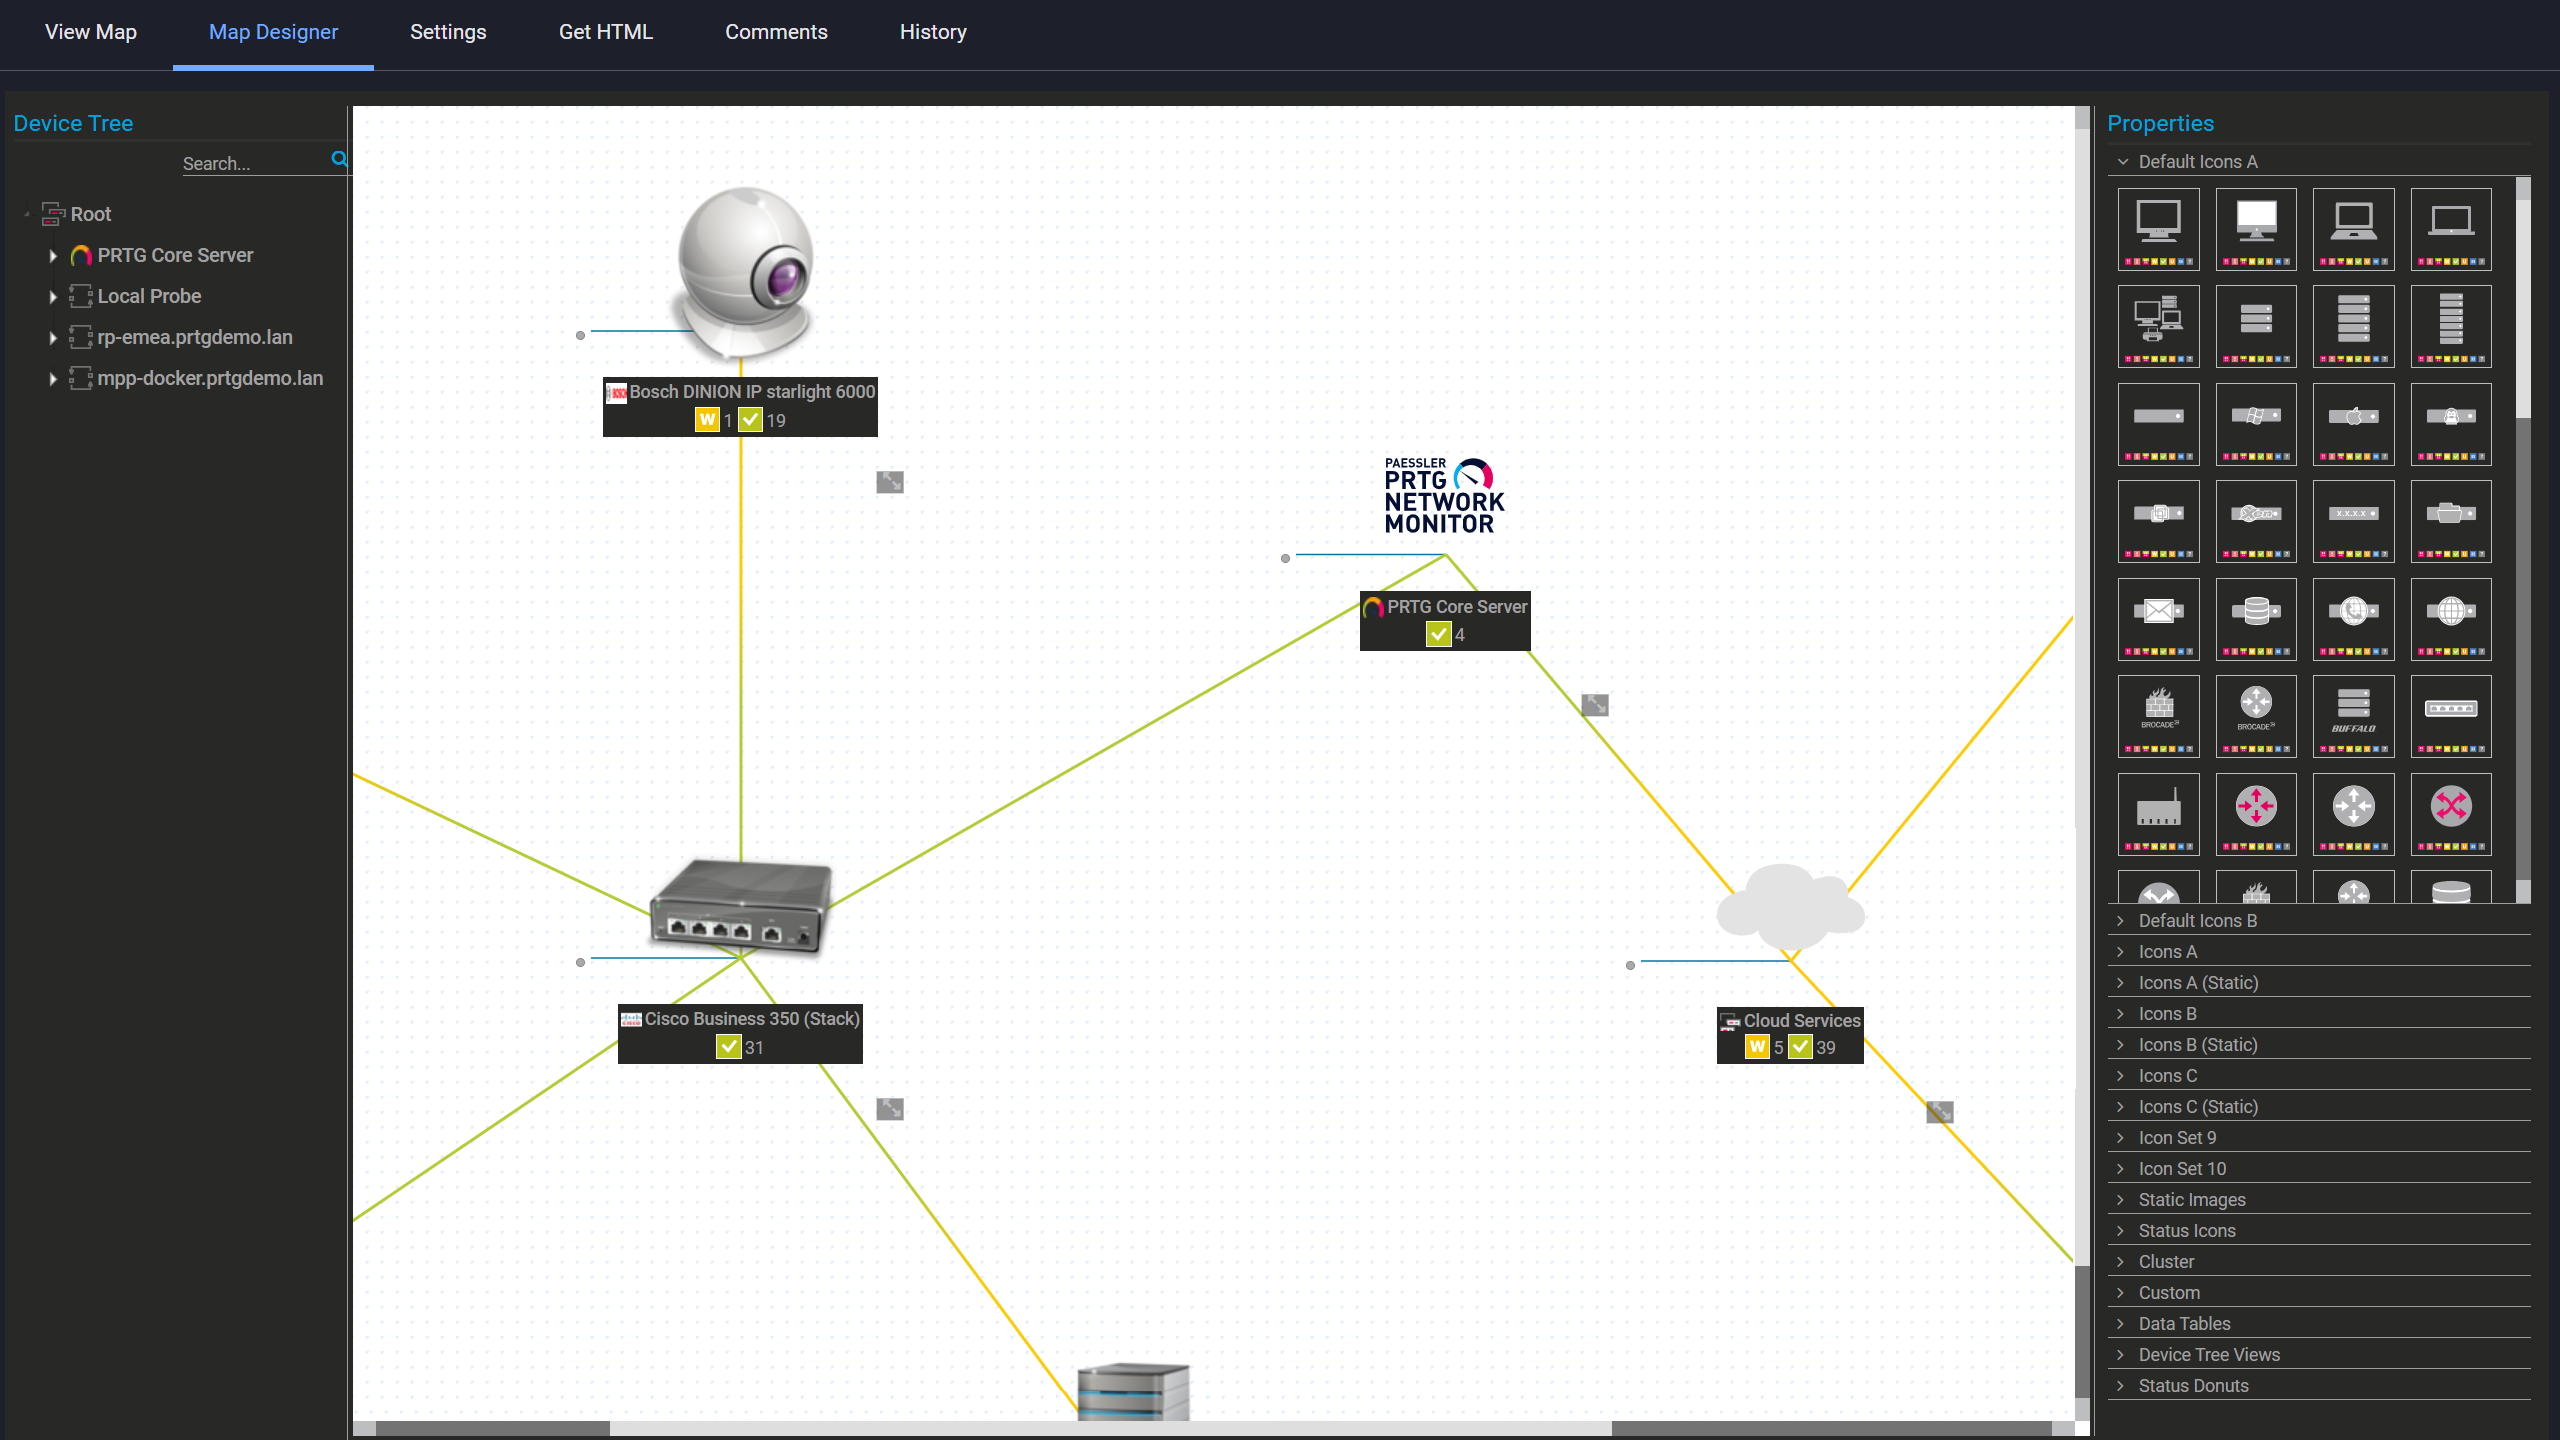
  • Map Designer for building visual infrastructure views alongside formal reports
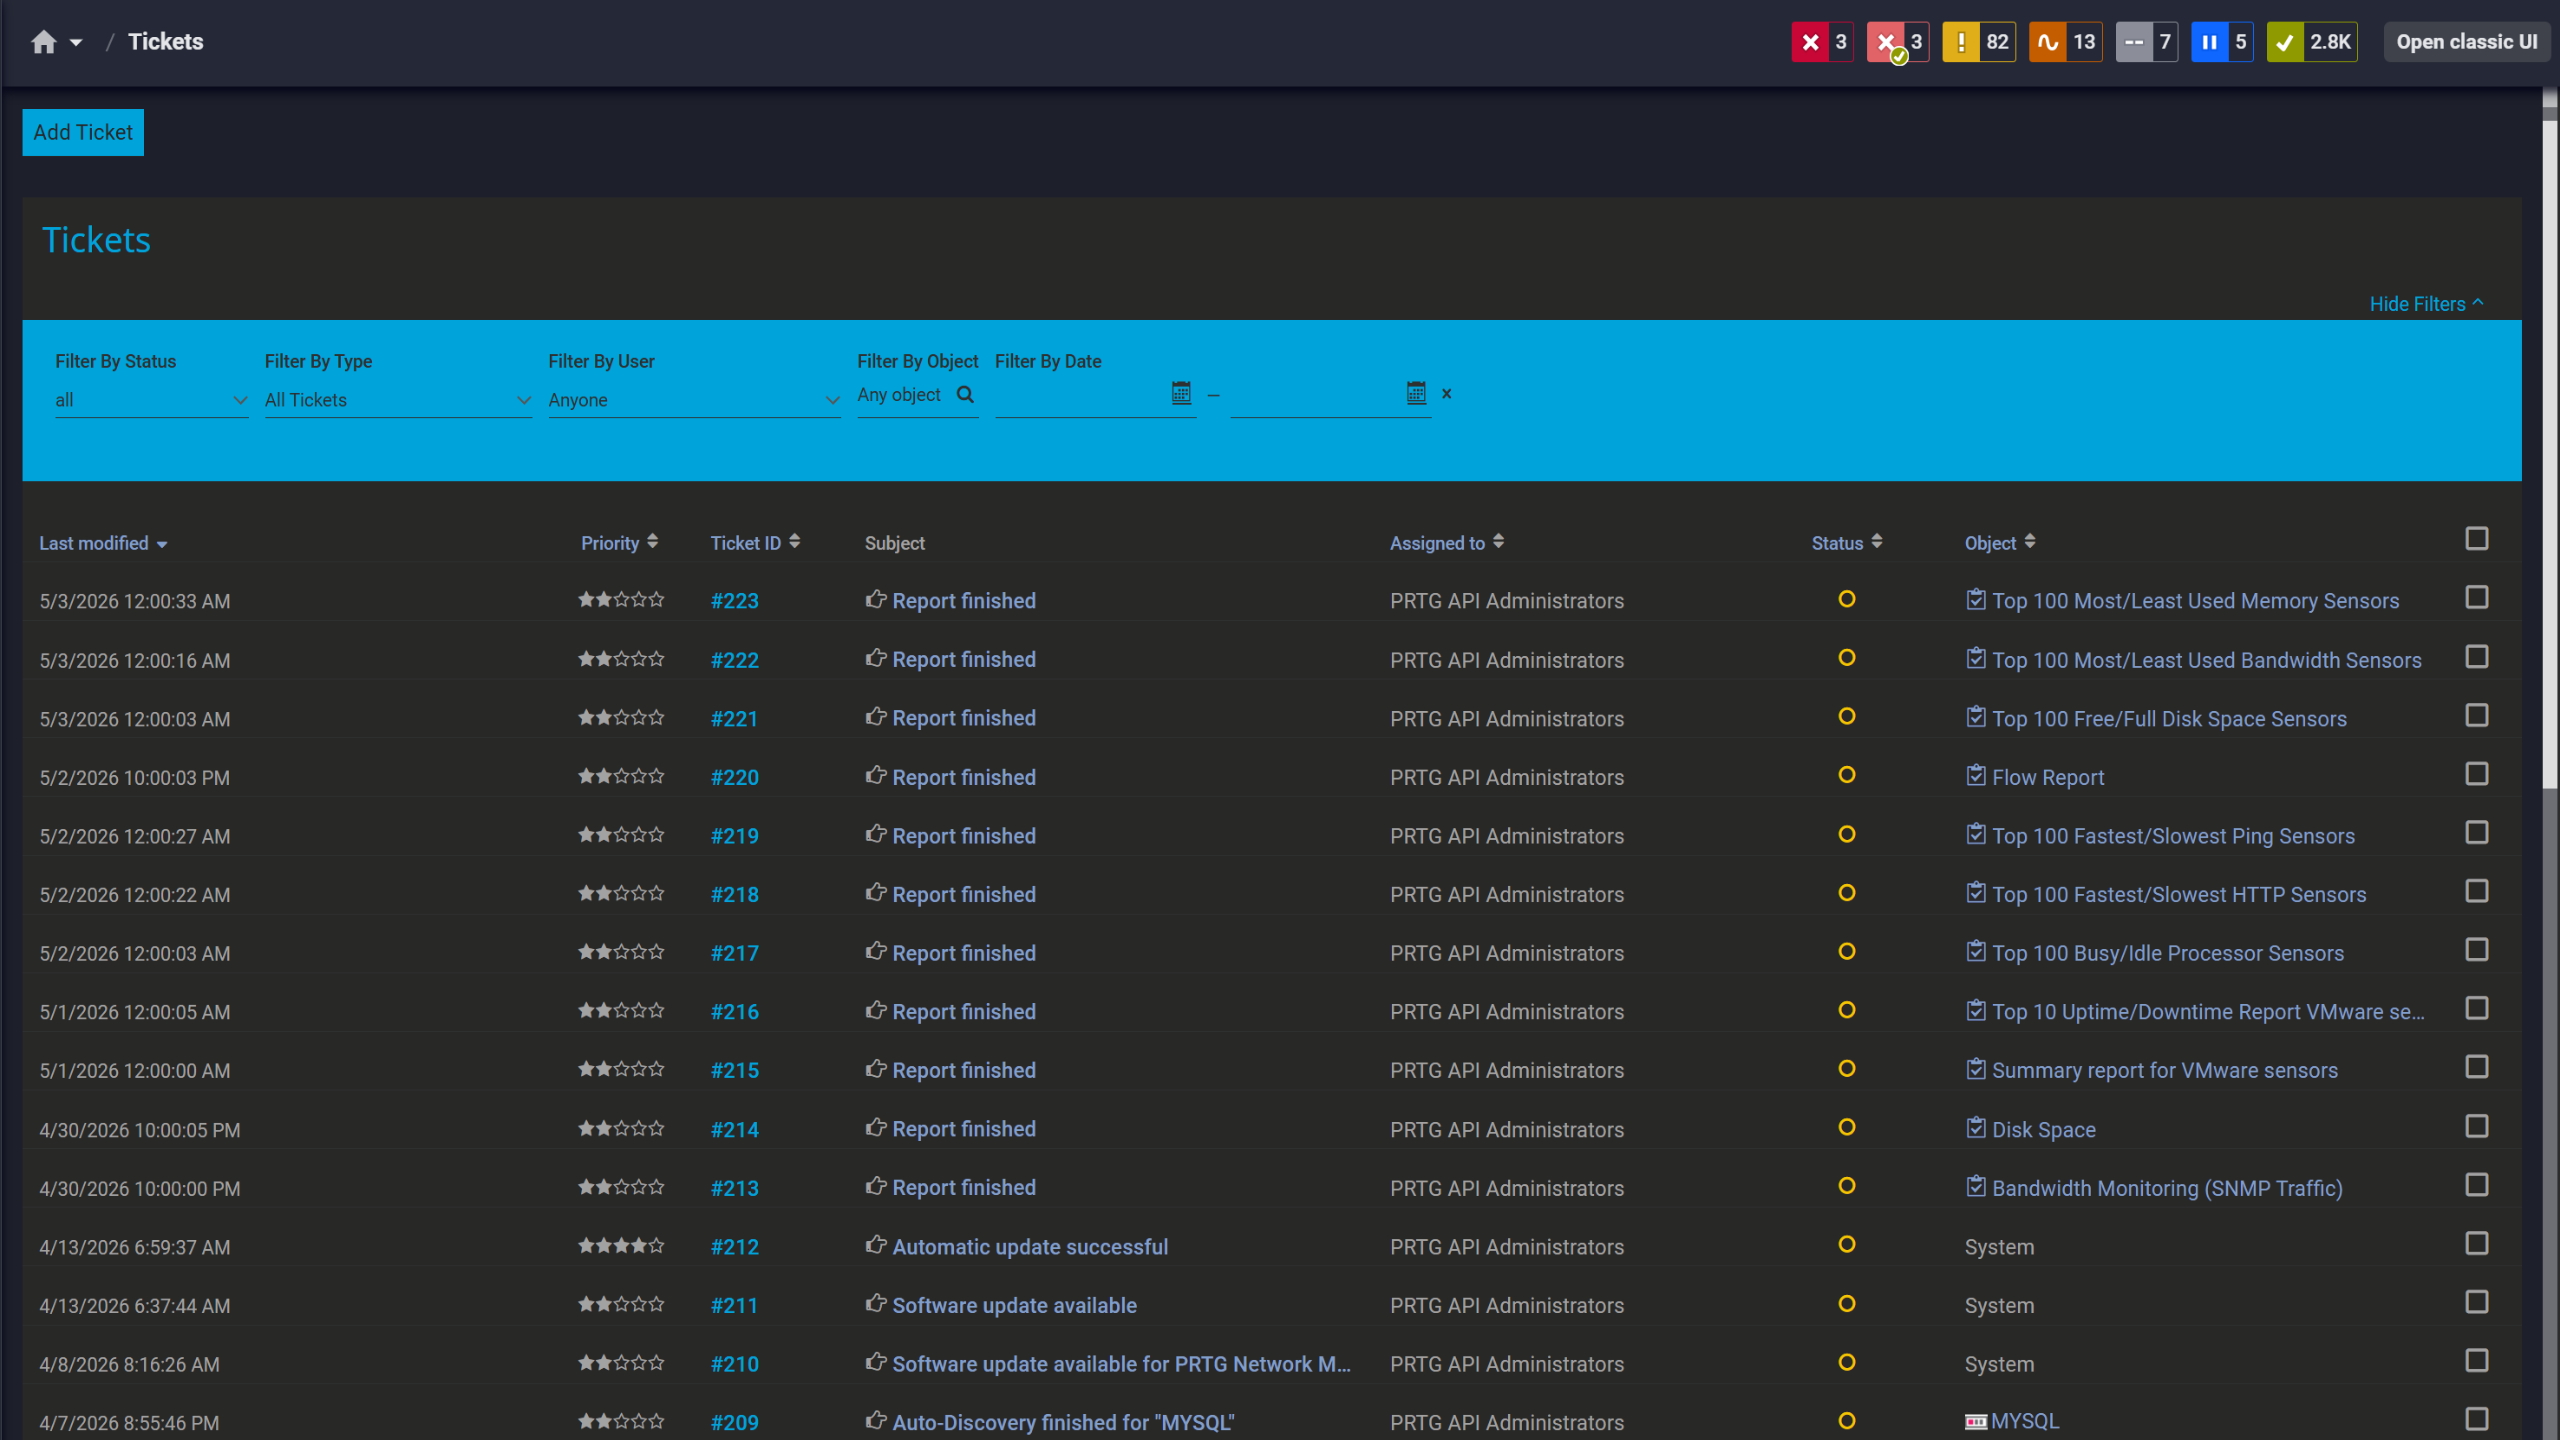
PRTG tickets list showing system notifications, report completions, and update alerts

Tickets keep your team aligned

PRTG web interface showing device tree and full device list with sensor status badges

Full device list, instant overview

PRTG Map Designer showing a custom network map with live device status and vendor icons

Custom maps with live status

One Reporting View Across All Your Sites

Distributed infrastructure doesn't have to mean fragmented reporting. Branch offices, remote sites, and regional data centers all generate monitoring data, and consolidating it manually across locations adds up fast. PRTG's remote probe architecture collects data locally at each site and feeds everything back to a single central core. Reports can span all locations at once, or filter by device group or tag for site-specific output, with no separate login per location. Geo Maps add a status-coded geographic overview of your full monitoring coverage, and PRTG Enterprise Monitor scales the architecture further for larger multi-instance environments.

  • Remote probes collect data locally, report to a central PRTG core
  • Filter reports by site, device group, or custom tags
  • Geo Maps provide a visual multi-site overview alongside formal reports
  • PRTG Enterprise Monitor available for larger multi-instance environments

How PRTG Collects Network Data for Reporting 

A report is only as good as what's being measured. Here's what's running underneath every report PRTG generates.

SNMP 

PRTG supports SNMP v1, v2c, and v3, polling routers, switches, firewalls, and other network devices at configurable intervals. Interface status, traffic counters, error rates, and device-level health metrics are collected per OID and stored. Covers most network device types across vendors including Cisco, Juniper, HP, and Dell. No agents required on monitored devices.

Flow Data Collection

For bandwidth reporting, PRTG receives flow data directly from routers and switches: NetFlow v5/v9, IPFIX, sFlow, and jFlow v5. This gives you per-connection traffic detail: Top Talkers, Top Connections, and Top Protocols. It goes deeper than what SNMP interface counters provide and is the right data source for bandwidth trend and utilization reports.

WMI Queries 

Windows servers are queried via WMI for CPU load, memory usage, disk utilization, and service availability. These metrics slot into PRTG reports alongside network device data. One report, both infrastructure layers, no separate monitoring stack needed for server-side visibility.

Historical Monitoring Data

PRTG keeps raw monitoring values and averages them automatically as time windows extend: full resolution for recent data, averaged intervals for older data to keep reports fast and file sizes manageable. Reports can't retrieve data from before the monitoring start date or after a data deletion event. Everything else is built on continuously stored sensor values.

free downLoad

Network Reporting: Manual Process vs. PRTG

FEATURE

Without PRTG

Without PRTG

With PRTG

With PRTG

Regular Reporting

Without PRTG
not included

Manually pull data, format, distribute

With PRTG
included

Scheduled and delivered automatically

Availability data

Without PRTG
not included

Reconstructed from logs after the fact

With PRTG
included

Continuously tracked, retrievable at any time

Multi-audience output

Without PRTG
not included

One format that fits no one well

With PRTG
included

Configurable templates, granularity per report

Historical trend analysis

Without PRTG
not included

Spreadsheets, estimates, and gaps

With PRTG
included

Stored sensor data across any time window

Multi-site coverage

Without PRTG
not included

Separate exports per location, stitched manually

With PRTG
included

Remote probes feed one central reporting view

free downLoad

”GESAC increasingly focuses on innovation to improve the quality of services offered and the experience of passengers handled every day by Naples Airport. Thanks to PRTG, we finally have unified, automatic, and continuous monitoring of the airport network and can guarantee quick and timely interventions.”

Domenico Ciervo, GESAC ICT Manager
Naples International Airport

Adopting PRTG has been like going from being in the dark to being in the light. Before, we had limited visibility into what was happening in the infrastructure and in the network. Now, however, thanks to the comprehensive dashboard and real-time notifications, we receive constant updates on the status of facilities and services, and our way of working has gone from passive to proactive.

Luca Meneghesso, senior IT infrastructure and security specialist
Banca Profilo

Ultimately, people do better when they focus on the solution, not the tool. This is the mantra we live by at Skyscanner. Without PRTG, we’d still be spending half a day or more on monitoring our internal tools.

Barry Kelly, Systems Engineer
Skyscanner

Paessler PRTG Network Monitor licenses & pricing

Choose the PRTG Network Monitor subscription that's best for you.

License NameLicense descriptionPriceLicense DetailsGet startedPricing Details
PRTG 500$200per month paid annuallyBuy nowBuy now

Enough to monitor multiple aspects of 50 devices

PRTG 1000$358per month paid annuallyBuy nowBuy now

Enough to monitor multiple aspects of 100 devices

PRTG 2500$742per month paid annuallyBuy nowBuy now

Enough to monitor multiple aspects of 250 devices

PRTG 5000$1,300per month paid annuallyBuy nowBuy now

Enough to monitor multiple aspects of 500 devices

PRTG 10000$1,642per month paid annuallyBuy nowBuy now

Enough to monitor multiple aspects of 1000 devices

Over 100,000 Customers Worldwide Love Paessler  

customer success stories

Network Reporting with PRTG: Frequently Asked Questions


What network metrics can PRTG include in a report?

PRTG can report on interface throughput, bandwidth utilization, packet loss, error rates, CPU and memory load, disk usage, service availability, uptime percentages, and threshold breach history, across routers, switches, firewalls, servers, and endpoints. SNMP-polled network health data and flow-based traffic metrics can both be included, depending on which sensors you're running.

In what formats can PRTG export reports?

PRTG generates custom reports as HTML, CSV, or XML. CSV is well-suited for import into Excel or external analysis tools. HTML works for browser-based viewing or direct email delivery. XML is available for further processing or integration with other reporting software.

Can PRTG send reports automatically, or do I trigger them manually?

Both. You can trigger a report manually at any time, or configure automated report generation on a schedule: daily, weekly, monthly, or custom intervals, with automatic email delivery to defined recipients. Once set up, it runs without intervention. Notifications can also be configured separately to alert on threshold breaches in real time.

How does PRTG handle reporting across multiple sites?

PRTG uses a remote probe architecture: probes at each site collect data locally and send it to a central PRTG core. From there, you can run reports that aggregate data across all sites, or filter by device group or tag to get site-specific output. This works for branch offices, regional data centers, and distributed service provider environments. No manual data stitching required.

Does PRTG support reporting on Cisco devices?

Yes. Cisco routers, switches, and firewalls are monitored via SNMP (v1/v2c/v3), and flow data is supported via NetFlow v5 and v9, both commonly used in Cisco environments. PRTG also supports REST API-based monitoring for devices and services that expose an API. Cisco is one of the most common vendor environments PRTG runs in.

How far back can PRTG report on historical data?

As far back as your stored data goes. PRTG retains historical sensor values continuously and averages them over longer time windows to keep storage and report generation manageable. The practical limit is your data retention settings and storage capacity, not a fixed system cap. Reports can't pull data from before monitoring started or from periods where data was deleted, but everything within your retention window is available for baselines and troubleshooting reviews.

What's the difference between PRTG's built-in reports and the PRTG SLA Reporter?

PRTG's built-in reporting covers historical data across any sensor or group: availability, utilization, threshold history, and more, delivered as HTML, CSV, or XML on a schedule or on demand. It's general-purpose network monitoring and reporting software built into the platform.

The PRTG SLA Reporter is a separate tool focused specifically on SLA documentation, generating structured availability reports against defined service levels, with output tailored for formal SLA reviews and customer-facing reporting services. If your use case involves contractual uptime commitments or regular SLA reporting to stakeholders, the SLA Reporter is the purpose-built option.

Paessler PRTG

Paessler PRTG

Network Monitoring Software – Version 26.1.116.1532 (February 9th, 2026)

Hosting icon

Hosting

Download for Windows and cloud-based version PRTG Hosted Monitor available

Languages icon

Languages

English, German, Spanish, French, Portuguese, Dutch, Russian, Japanese, and Simplified Chinese

test

Monitor everything

Network devices, bandwidth, servers, applications, virtual environments, remote systems, IoT, and more

test

Pricing

Choose the PRTG Network Monitor subscription that's best for you

Discover more monitoring insights and stories

Content illustration

Powerful stories from the monitoring world

  • How to Secure Backups and Improve Reporting for Your Veeam
  • NetFlow Reporting Beyond PRTG - Paessler Blog
  • C-Level IT Reporting with PRTG - Paessler Blog
Support illustration

Resources to master your monitoring challenges

  • How can I move or migrate a PRTG installation to a different system or server?
  • How can I speed up PRTG—especially for large installations?
  • Device and Sensor Setup
Solution illustration

Solutions for all your monitoring needs

  • Network Reporting
  • Free Network Monitoring
  • Monitoring Networks
PRTG Logo

Start Monitoring with PRTG and see how it can make your network more reliable and your job easier.

Free download
PRODUCT OVERVIEW

Products

  • Paessler PRTG
    Paessler PRTGMonitor your whole IT infrastructure
    • PRTG Network Monitor
    • PRTG Enterprise Monitor
    • PRTG Hosted Monitor
    • PRTG UVexplorer
    • PRTG extensions
      Extensions for Paessler PRTGExtend your monitoring to a new level
  • Icon Features
    FeaturesExplore all monitoring features

Monitoring with PRTG

  • Network monitoring
  • Bandwidth monitoring
  • SNMP monitoring
  • Network mapping
  • Wi-Fi monitoring
  • Server monitoring
  • Network traffic analyzer
  • NetFlow monitoring
  • Syslog server

Useful Links

  • PRTG Manual
  • Knowledge Base
  • Customer Success Stories
  • About Paessler
  • Subscribe to newsletter
  • PRTG Support
  • PRTG Consulting
  • PRTG Feedback & Roadmap

Contact

Paessler GmbH
Thurn-und-Taxis-Str. 14, 
90411 Nuremberg 
Germany

[email protected]

+49 911 93775-0

  • Contact us
©2026 Paessler GmbHTerms & ConditionsPrivacy PolicyImprintReport VulnerabilityDownload & InstallSitemap
Paessler PRTG Paessler PRTG Paessler PRTG