
- English
- Deutsch
- Español
- Français
- Italiano
- Português
Jitter is the variation in packet delay: how consistently (or inconsistently) data packets arrive over time, measured in milliseconds. A proper jitter test captures more than just jitter: it also tracks latency, round-trip time, packet loss, and depending on the sensor, MOS scores for VoIP call quality assessment. Achieving low latency and consistent packet delivery is what real-time applications depend on. PRTG measures both continuously on a configurable polling cycle, not just when someone thinks to run a manual test. That means you get a running record of network performance metrics over time, not isolated snapshots you have to piece together afterwards.
For vendor-agnostic environments, Paessler PRTG offers the Ping Jitter sensor (ICMP), QoS (Quality of Service) One Way sensor (UDP), and QoS (Quality of Service) Round Trip sensor (UDP), compatible with any IP-reachable device from Cisco, Juniper, HP, and others. For Cisco IOS-based infrastructure specifically, the Cisco IP SLA sensor and SNMP Cisco CBQoS sensor are also available.

Jitter problems are often intermittent. They show up during peak traffic, network congestion, or at times nobody's actively watching, and they're gone by the time someone opens a terminal to check. A one-off ping or speed test gives you a single data point in time. That's rarely enough to act on.
PRTG runs jitter tests automatically on a configurable polling cycle and stores every reading. Trend graphs show how values behave over hours, days, or weeks. You move from "we had a complaint and ran a test" to "here's what high jitter looked like, reading by reading, over the past 30 days."
The typical manual setup (ping for basic delay, iperf for UDP throughput, Wireshark for packet inspection) gets the job done for a one-time check. But it requires setup every time, produces no alerts, and retains nothing between sessions. There's nothing to look back at.
PRTG's dedicated jitter sensors run without manual intervention and store everything in one place. Ping Jitter (ICMP) handles lightweight, vendor-agnostic tests with response time reporting. QoS One Way and Round Trip (UDP) measure between two probe locations for directional accuracy. Cisco IP SLA taps into Cisco IOS infrastructure directly. All the test results land in one dashboard.
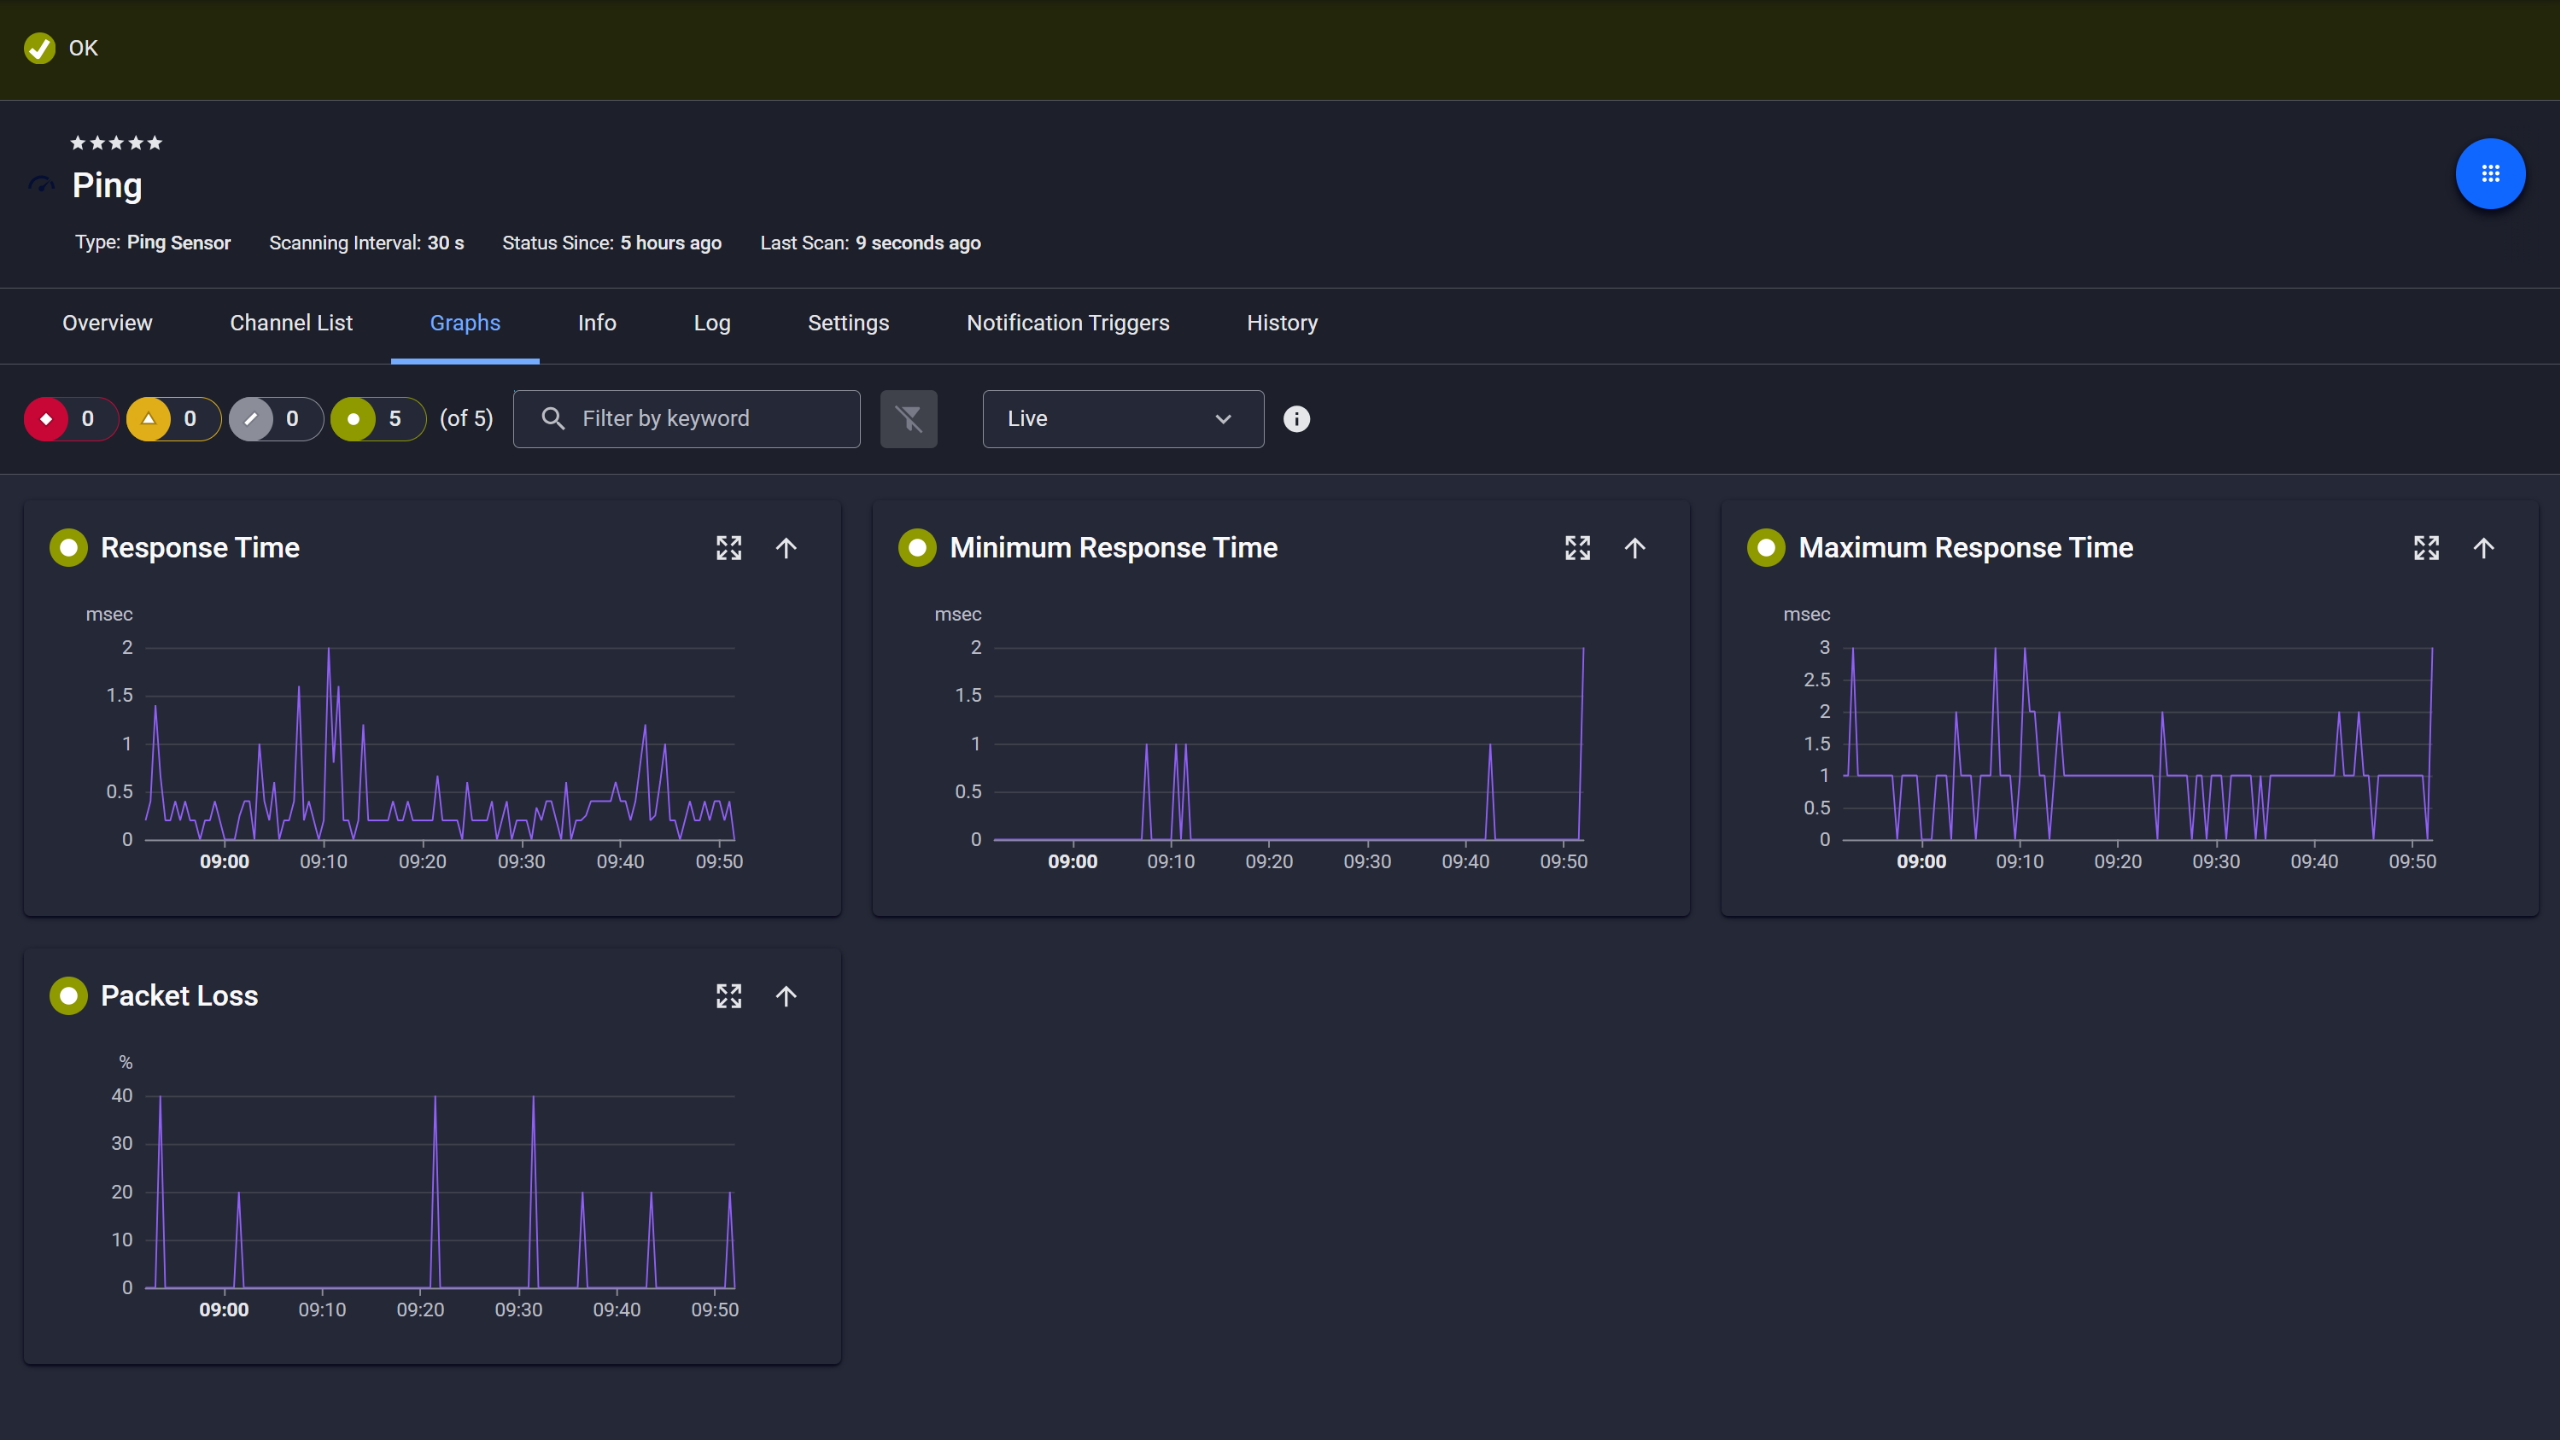
Ping response and packet loss

Live graphs, real-time performance data

Scheduled reports, always on time
Start monitoring your infrastructure in minutes. No professional services, no complex configuration, no risk.
Timestamped measurement history gives you an objective starting point for any provider conversation about call quality or network degradation. Per-path data tells you which link the issue is on before the conversation even starts. When choppy audio hits a VoIP call, video conferencing drops, or network quality degrades, the data from that window is already there. You don't have to reconstruct what happened, and the metrics speak for themselves.
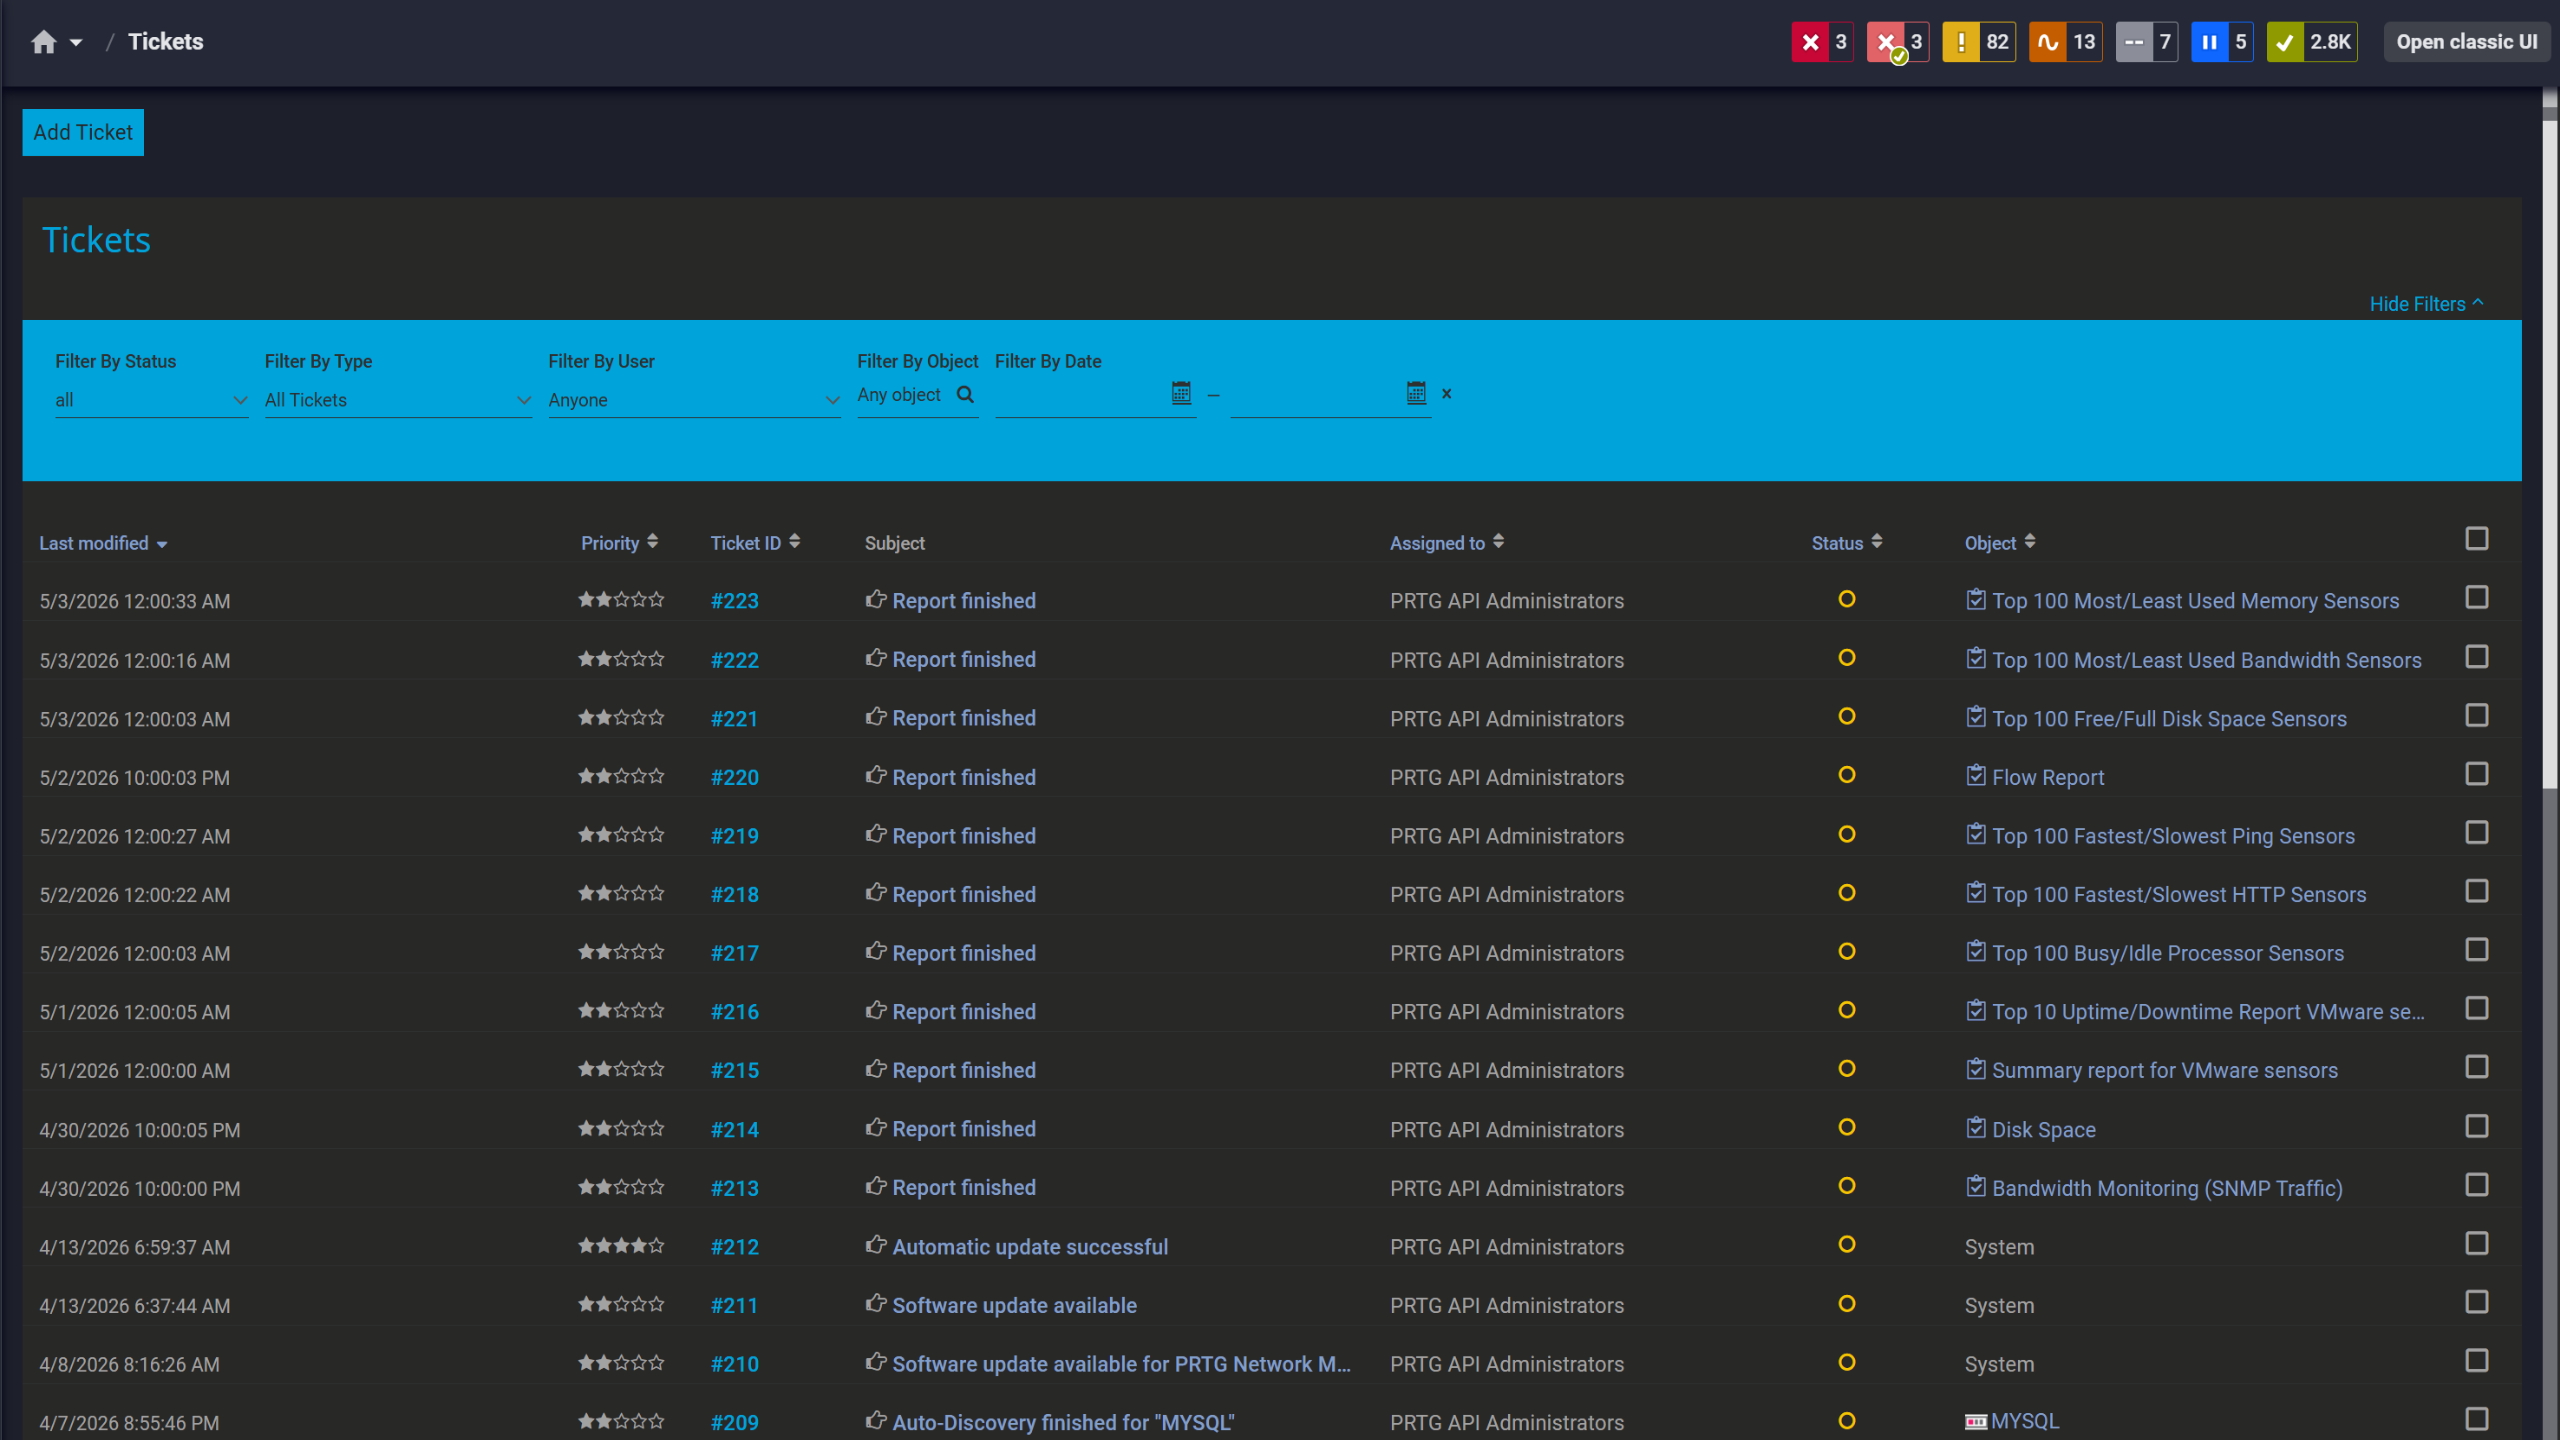
Tickets keep your team aligned

Full device list, instant overview
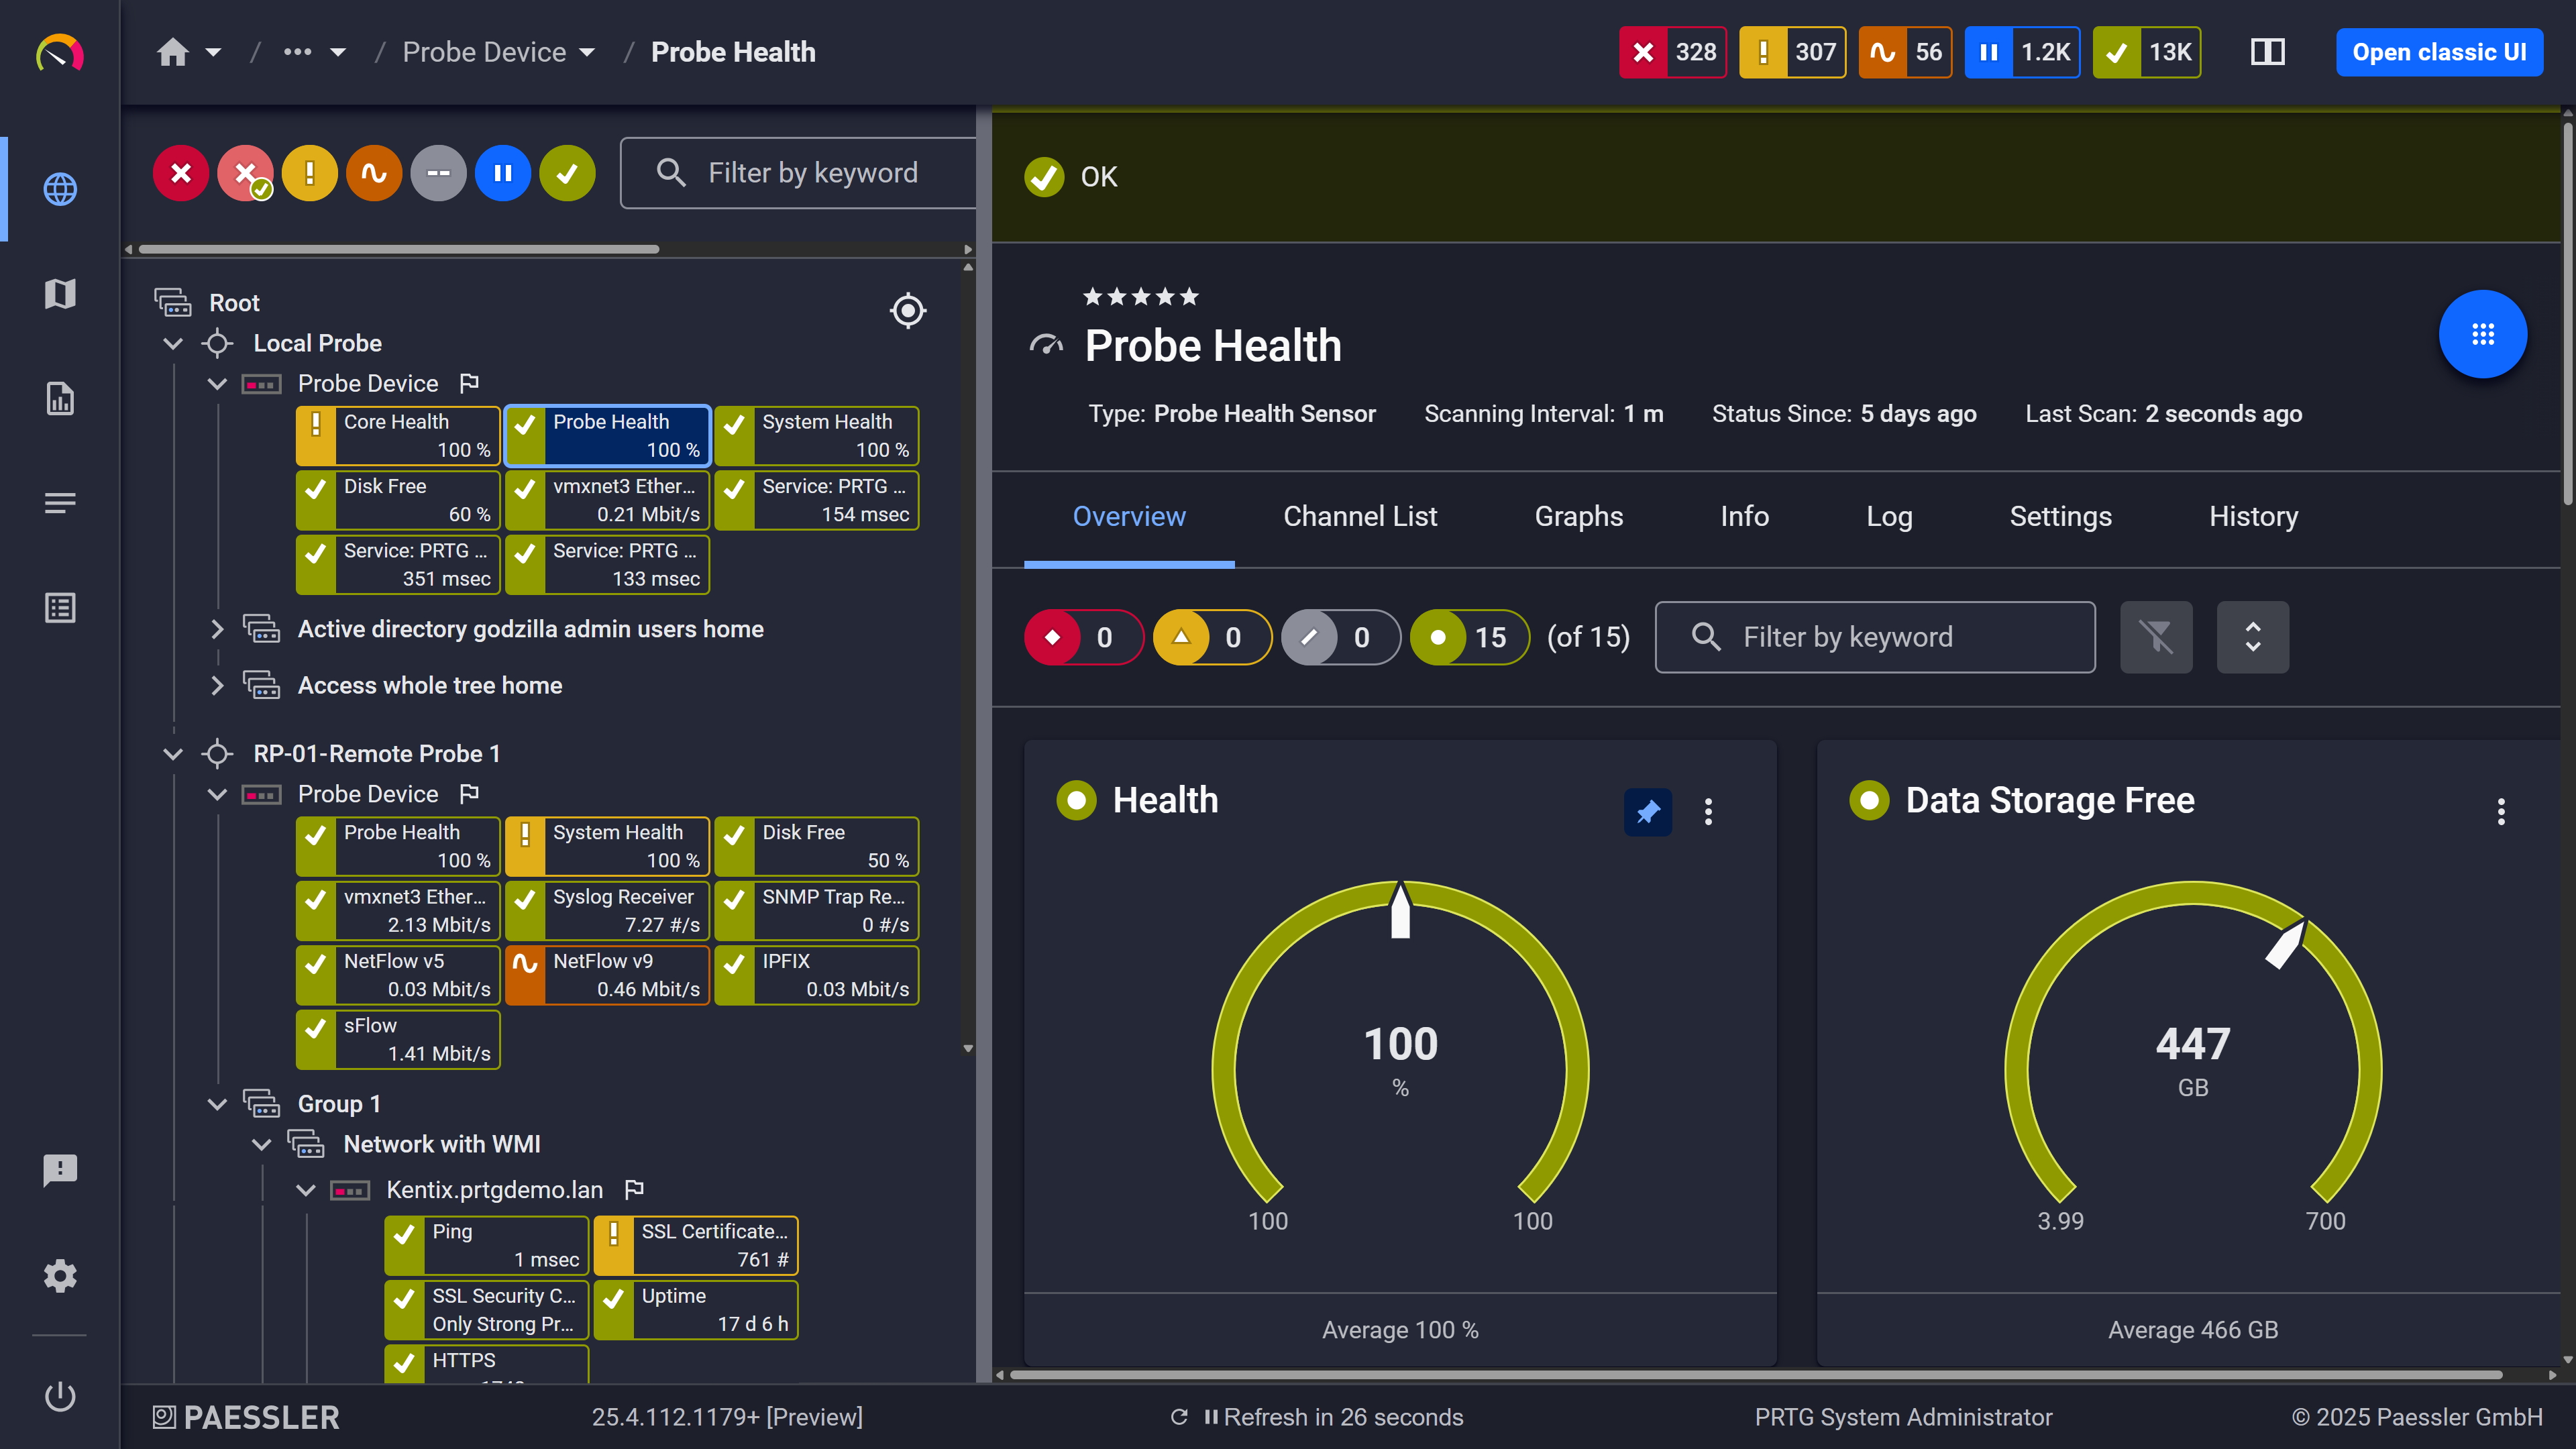
Probe health at a glance
A network-wide view tells you something's wrong, but it often doesn't tell you where. When one office, one WAN link, or one wi-fi segment has elevated jitter, a global health status isn't enough. You need per-path visibility to optimize your troubleshooting and avoid changes that don't fix anything.
Deploy a remote probe at the branch or remote site, and PRTG's QoS sensors measure that specific internet connection directly, whether over ethernet cable, VPN, or wireless infrastructure. This is a one-time setup step. Once the probe is in place, measurement runs continuously. Cisco IP SLA handles the same for Cisco IOS-based branch infrastructure. You narrow the problem to a specific link before touching anything else, saving time and avoiding blind infrastructure changes.
PRTG uses different measurement methods depending on your environment and the level of detail you need. Here's what each approach covers technically: the protocol, what's measured, and what output you get.
Capability | Manual spot-checking (ping / iperf / Wireshark) Manual spot-checking (ping / iperf / Wireshark) | Continuous monitoring with PRTG Continuous monitoring with PRTG |
|---|---|---|
Ongoing jitter measurement | Manual spot-checking (ping / iperf / Wireshark) Runs only when triggered | Continuous monitoring with PRTG 24/7, configurable polling interval |
Historical trend data | Manual spot-checking (ping / iperf / Wireshark) No retention between sessions | Continuous monitoring with PRTG Full history, exportable |
Alerting on threshold breaches | Manual spot-checking (ping / iperf / Wireshark) Manual check required | Continuous monitoring with PRTG Email, SMS, push notifications |
Per-path measurement | Manual spot-checking (ping / iperf / Wireshark) Manual probe setup each time | Continuous monitoring with PRTG Persistent remote probe per location |
MOS score for VoIP quality | Manual spot-checking (ping / iperf / Wireshark) Not available in ping/iperf | Continuous monitoring with PRTG Via Cisco IP SLA sensor (Cisco devices) |
Unified dashboard across paths | Manual spot-checking (ping / iperf / Wireshark) Separate output per tool | Continuous monitoring with PRTG All paths in one view |
Choose the PRTG Network Monitor subscription that's best for you.
| License Name | License description | Price | License Details | Get started | Pricing Details | |
|---|---|---|---|---|---|---|
| PRTG 500 | $200 | per month paid annually | Buy nowBuy now | Enough to monitor multiple aspects of 50 devices | ||
| PRTG 1000 | $358 | per month paid annually | Buy nowBuy now | Enough to monitor multiple aspects of 100 devices | ||
| PRTG 2500 | $742 | per month paid annually | Buy nowBuy now | Enough to monitor multiple aspects of 250 devices | ||
| PRTG 5000 | $1,300 | per month paid annually | Buy nowBuy now | Enough to monitor multiple aspects of 500 devices | ||
| PRTG 10000 | $1,642 | per month paid annually | Buy nowBuy now | Enough to monitor multiple aspects of 1000 devices |

Jitter is the variation in how long it takes packets to travel from one point to another, measured in milliseconds. In applications like VoIP calls or video conferencing, packets need to arrive in a consistent, steady stream. When they don't, the result is choppy audio, dropped words, or video that freezes and catches up. Unlike file transfers or web browsing, real-time communication has no tolerance for irregular delivery.
A commonly referenced threshold for VoIP calls and video calls is below 30ms. Above that, quality tends to degrade noticeably. What counts as acceptable depends on your environment and the applications in use. PRTG lets you define your own thresholds per sensor and alerts when values exceed them. It doesn't prescribe what your limit should be.
An internet speed test gives you a snapshot: download speed, upload speed, and latency at a single point in time. A continuous jitter monitoring tool like PRTG runs measurements on a recurring schedule, stores every reading, and alerts you when something exceeds your thresholds. The difference is visibility over time vs. a number that's already stale by the time you see it.
No. The Ping Jitter (ICMP) and QoS One Way/Round Trip (UDP) sensors work with any IP-reachable device: routers, switches, or endpoints from any vendor, connected via ethernet cable or wi-fi. The Cisco IP SLA and SNMP Cisco CBQoS sensors require Cisco IOS-based hardware. They rely on Cisco-specific IOS functionality (IP SLA operations and CBQoS MIBs) that isn't available on non-Cisco devices.
They measure different things. Latency (or network latency, average latency) is how long a single packet takes to reach its destination. Jitter is how much that delay varies from packet to packet. Packet loss is how many packets don't arrive at all. Bandwidth (measured in Mbps) is how much data the connection can carry. High latency, high jitter, and packet loss all degrade real-time application quality, but in different ways. Bandwidth alone doesn't tell the full story: a high-bandwidth connection with high jitter will still produce poor VoIP call quality.
Per-path measurement helps narrow it down. If PRTG's QoS sensors show elevated jitter on the path between your internal probe and an external endpoint, and the same pattern appears in timestamped history, you have objective data to bring to the conversation with your internet service provider. It won't automatically root-cause the issue, but it gives you a starting point grounded in measurement rather than assumption.
Yes. Online gaming is particularly sensitive to jitter — inconsistent packet delivery translates directly to lag and poor responsiveness. Video streaming can also be affected: buffering behavior is partly a response to irregular data delivery. Any real-time application that relies on a steady data flow can be impacted by high jitter, not just VoIP calls.
Network Monitoring Software – Version 26.3.124.1727 (September 16, 2026)
Download for Windows and cloud-based version PRTG Hosted Monitor available
English, German, Spanish, French, Portuguese, Dutch, Russian, Japanese, and Simplified Chinese
Network devices, bandwidth, servers, applications, virtual environments, remote systems, IoT, and more
Choose the PRTG Network Monitor subscription that's best for you



