• Company
    • About Us
    • Case Studies
    • Press Center
    • Careers
    • Blog
    • Contact us
  • Contact us
  • Login
 
  • English
    • Deutsch
    • Español
    • Français
    • Italiano
    • Português
Paessler
                    - The Monitoring Experts
  • Products
    • Paessler PRTG
      Paessler PRTGMonitor your whole IT infrastructure
      • PRTG Network Monitor
      • PRTG Enterprise Monitor
      • PRTG Hosted Monitor
      • PRTG UVexplorer
      • PRTG extensionsExtensions for Paessler PRTGExtend your monitoring to a new level
    • Icon Features
      FeaturesExplore all monitoring features
      • Maps & dashboards
      • Alerts & notifications
      • Multiple user interfaces
      • Distributed monitoring
      • Customizable reporting
  • Solutions
    • Industries
      IndustriesMonitor various industry sectors
      • Industrial
      • Healthcare
      • Data Center
      • Education
      • Finance
      • Government
    • IT Topics
      IT TopicsMonitor all areas of IT
      • Network Monitoring
      • Bandwidth Monitoring
      • SNMP Monitor
      • Network Mapping
      • WiFi Monitoring
      • Server Monitoring
  • Pricing
  • Resources
    • Getting Started
      Getting StartedModules for self-paced learning
    • How-to Guides
      How-to GuidesGet the most out of PRTG
    • Videos & Webinars
      Videos & WebinarsLearn from Paessler experts
    • IT  Knowledge
      IT KnowledgeExpand your IT knowledge
    • PRTG Manual
      PRTG ManualFull documentation
    • Knowledge Base
      Knowledge BaseShare community knowledge
    • PRTG Sensor Hub
      PRTG Sensor HubGet sensors, scripts & templates
    • Trainings
      PRTG TrainingLearn how to work with PRTG
  • Partners
    • Icon Handshake
      Become a PartnerFor resellers and channel partners
    • Icon MSP
      Become an MSPDeliver monitoring as a managed service
    • icon partner
      Partner PortalLog in to your partner account
    • Deal Registration
      Deal RegistrationRegister your sales opportunities
    • icon search
      Find a PartnerFind partners selling Paessler products
    • icon technology
      Technology AlliancesSee Paessler technology partnerships
    • Partner HubTools for Your Success
  • Company
    • About Us
    • Case Studies
    • Press Center
    • Careers
    • Blog
    • Contact us
  • Contact us
  • Login
  • English
    • Deutsch
    • Español
    • Français
    • Italiano
    • Português
  • Get a quote
  • Free trial
  1. Home>
  2. IT Topics>
  3. Network>
  4. Network Activity Monitor

Enhance Network Performance with PRTG's Network Activity Monitor

Have the clarity you need to identify network issues before they escalate

  • Get real-time insights into every corner of your network
  • Identify, troubleshoot, and fix bottlenecks before users notice
  • Automate alerts and reclaim your downtime
Free download
PRODUCT OVERVIEW

Our Users Give Top Ratings for Monitoring With Paessler PRTG

Gartner peer insights
spiceworks
G2
Capterra

PRTG network activity monitor: What you will find on this page

Table of content

    PRTG makes network activity monitoring as easy as it gets

    Custom alerts and data visualization let you quickly identify and prevent security and performance issues.

    Free download
    PRODUCT OVERVIEW

    Solve network invisibility with PRTG’s network activity monitoring

    Network invisibility. It’s the #1 frustration of sysadmins everywhere. Why is your bandwidth so spotty? How do you ensure uptime across remote network devices and locations? Paessler PRTG is your all-in-one network monitoring solution, giving you immediate observability into every aspect of your network.

    Stop losing sleep over traffic blind spots

    Identify hidden traffic patterns, rogue devices, or silent bandwidth hogs before they become major problems. PRTG eliminates the guesswork by giving you a clear view of every router, switch, firewall, and other endpoint on your network.

    Bandwidth usage, databases, applications, VPNs – even physical server rooms – are all made visible with PRTG. Stop the nightmares and rest easy knowing PRTG is keeping your network in check.

    Take network monitoring to the next level

    Your IT team needs an easy way to identify trends, manage network connections, and optimize bandwidth allocation. Whether troubleshooting TCP issues, digging into a misbehaving server, or analyzing real-time network data, PRTG ensures you’re always ahead of potential disruptions.

    With support for NetFlow, sFlow, packet sniffing, SNMP, WMI, and more, PRTG provides deep insights into network traffic patterns and performance.

    Stay informed of network processes

    Never miss another network issue. A program is hogging bandwidth, network latency spikes at certain times, or a printer has gone offline – PRTG makes sure you know what’s happening and when.

    Dive into your network’s data at any time to confirm its health or to enjoy the satisfaction of seeing that error-free report. Whether looking for a root cause or just keeping your finger on the pulse of network traffic, PRTG has you covered.

    Monitor every environment with ease

    Modern networks extend beyond the office, often spanning remote locations, cloud services, and hybrid setups.

    PRTG’s network monitoring tools ensure comprehensive visibility across these environments, tracking network connections, device health, and traffic patterns no matter where your infrastructure resides. Keep remote teams and systems running smoothly with a single, unified view.

    Detect and prevent security threats

    Network invisibility can leave you vulnerable to attacks and unauthorized access. PRTG actively monitors traffic flow, firewall activity, and unusual network access, alerting the appropriate team for potential security threats.

    PRTG also helps monitor and identify suspicious changes in IP addresses to catch unauthorized devices before they become a problem. Strengthen your defenses and minimize downtime with PRTG – proactively.

    What network activity monitoring looks like in PRTG

    Diagnose network issues by continuously tracking network activity across your entire IT infrastructure. Show network speed, hardware health parameters, network traffic data, bandwidth usage, and other key metrics in real time. Visualize monitoring data in clear graphs and dashboards to identify problems more easily. Gain the overview you need to troubleshoot security and performance issues in your network.

    PRTG Screenshot device tree view

    Device tree view of the complete monitoring setup

    PRTG screenshot map entire it infrastructure

    Custom PRTG dashboard for keeping an eye on the entire IT infrastructure

    PRTG screenshot graph live data traffic

    Live traffic data graph in PRTG

    Start monitoring network activity with PRTG and see how it can make your network more reliable and your job easier.

    Free download
    PRODUCT OVERVIEW

    IT experts agree: Paessler PRTG is a great solution for IT infrastructure monitoring

    PCMag

    “All-around winning
     network monitor”

    IT Brief

    “The real beauty of PRTG is the endless possibilities it offers”

    ITPro

    “PRTG Network Monitor 
    is very hard to beat”

    3 reasons to choose PRTG as your network activity monitor

    Icon Connection

    Get vendor-agnostic network monitoring

    PRTG offers robust compatibility across platforms and providers, letting you monitor network devices, servers, operating systems, and applications without worrying about compatibility.

    Cisco, Dell, HPE, NetApp. Microsoft Windows, Linux, or Mac operating systems. Wireless networks or LAN, WiFi or Ethernet. PRTG has your back.

    Icon Time

    Start monitoring in hours, not days

    Getting started with PRTG is fast and hassle-free. An intuitive setup process, preconfigured sensors, and a user-friendly interface mean you can begin monitoring your network usage within hours.

    Whether you're managing a small office, a few remote locations, or a global infrastructure, PRTG minimizes the learning curve and lets you focus on what matters – keeping your network running smoothly. No PhD in rocket science required.

    Icon Settings

    Customize your entire monitoring setup

    Customization is a paramount feature for network monitoring tools. Out-of-the-box functionality is all well and good, but you also need the ability to tweak settings for your unique IT environment.

    Take control of your network with customizable dashboards, notifications, and monitoring templates. Define thresholds for critical network events, visualize trends with detailed graphs, and ensure your team stays focused on what matters most.

    Explore our preconfigured PRTG sensors for network activity monitoring

    PRTG comes with more than 250 native sensor types for monitoring your entire on-premises, cloud, and hybrid cloud environment out of the box. Check out some examples below!

    Packet Sniffer

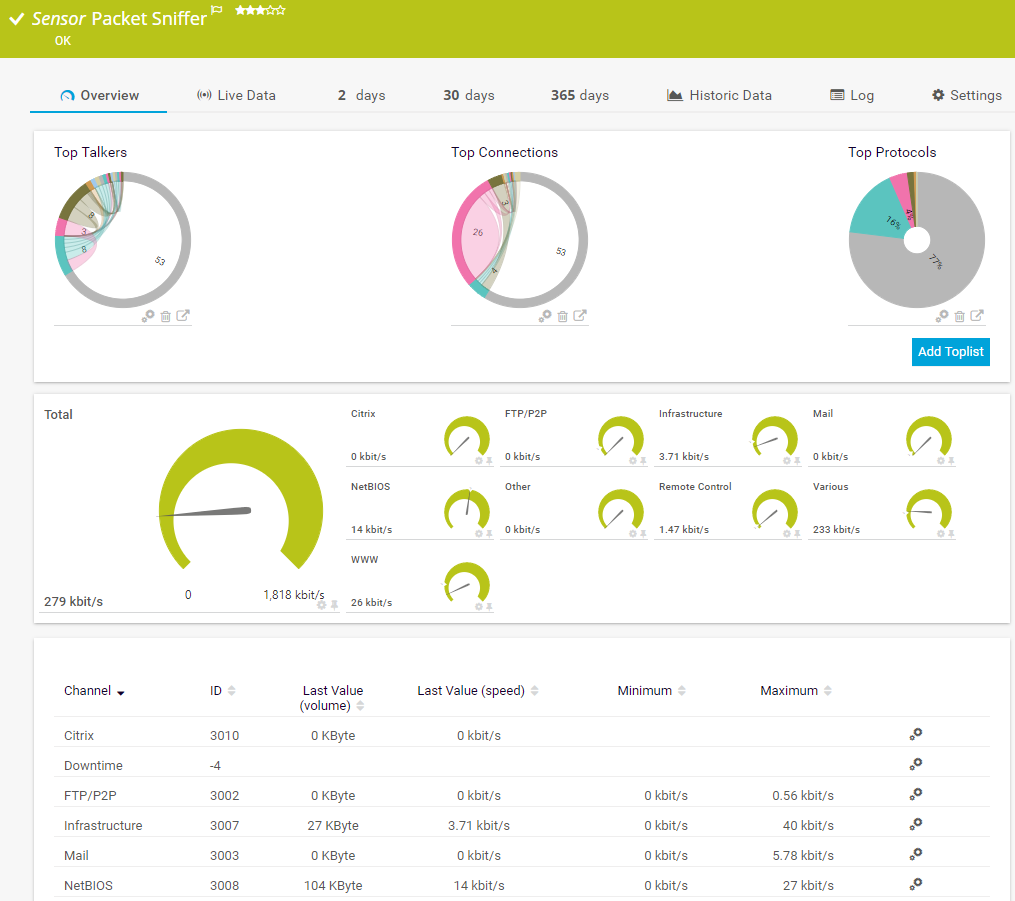
    The Packet Sniffer sensor monitors the headers of data packets that pass a local network card using a built-in packet sniffer. You can choose from predefined channels. It can show the following and more:

    • Traffic from Citrix applications
    • Traffic from file transfer (FTP/P2P) and various other protocols (UDP, TCP)
    • Traffic from network services (DHCP, DNS, Ident, ICMP, SNMP)
    • Internet mail traffic (IMAP, POP3, SMTP)
    • Traffic from remote control applications (RDP, SSH, Telnet, Virtual Network Computing (VNC))
    Packet Sniffer
    Packet Sniffer

    SNMP Traffic v2

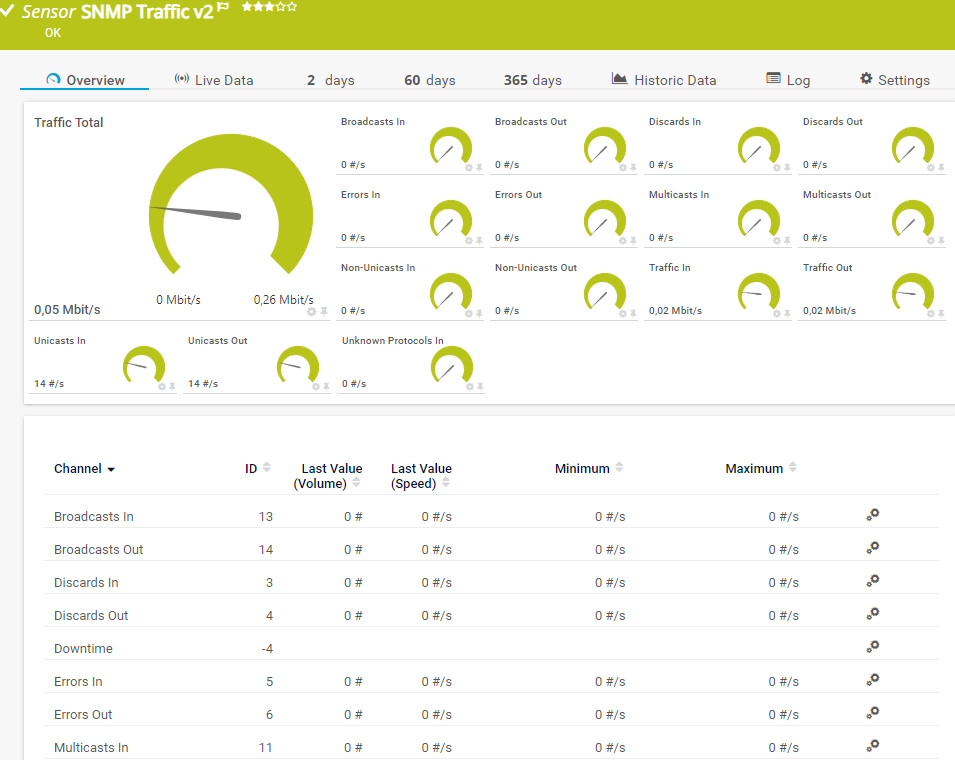
    The SNMP Traffic v2 sensor monitors bandwidth and traffic on a device. It can show the following:

    • Number of incoming and outgoing broadcast, multicast, unicast, and non-unicast packets
    • Number of incoming and outgoing discards and errors
    • Total, incoming, and outgoing traffic
    • Number of incoming, unknown protocols
    SNMP Traffic v2
    SNMP Traffic v2

    Ping v2

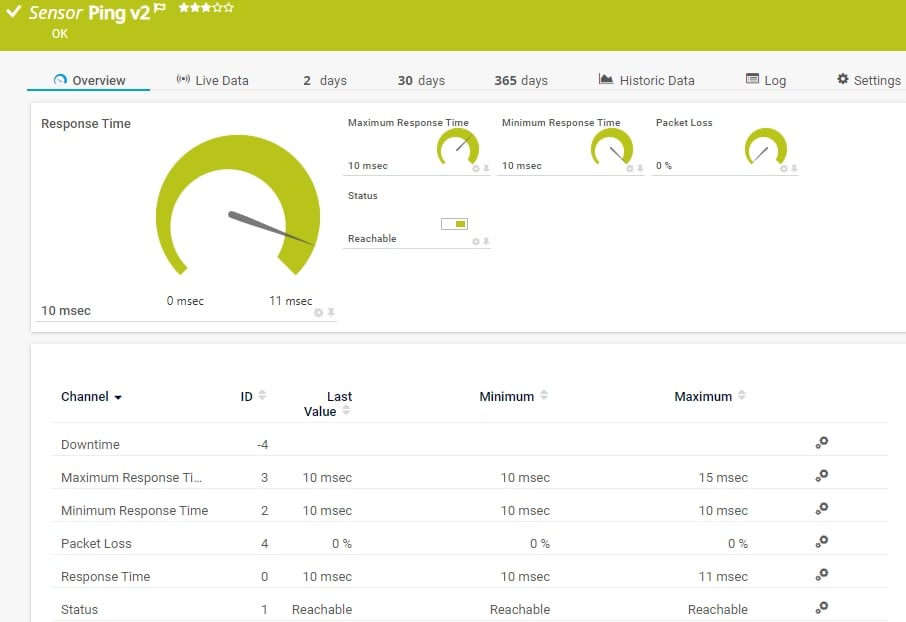
    The Ping v2 sensor sends an Internet Control Message Protocol (ICMP) echo request ("ping") from the probe system to the parent device to monitor its availability. It can show the following:

    • Response time

    • Packet loss

    • Target status

    • Minimum and maximum ping time

    Ping v2
    Ping v2

    Port v2

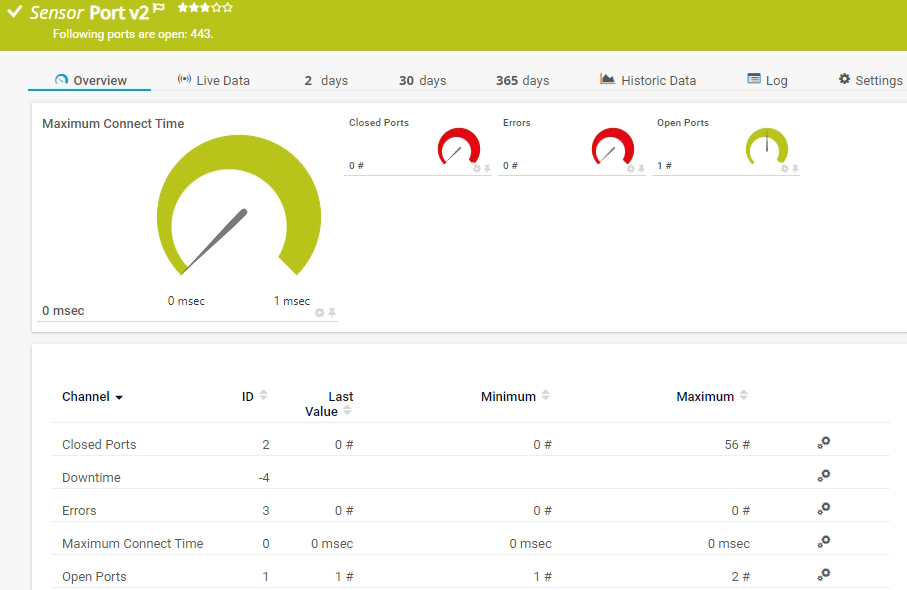
    The Port v2 sensor monitors a network service by connecting to one or more of its TCP/IP ports. It can show the following:

    • Number of open and closed ports
    • Number of errors
    • Maximum time until a request to connect to a port was accepted
    Port v2
    Port v2

    See the PRTG Manual for a list of all available sensor types.

    PRTG Is Compatible With All Major Vendors, Products, and Systems

    compatible with all major vendors, products, and systems

    Find the root cause of the problem with our PRTG network activity monitoring solution

    Real-time notifications mean faster troubleshooting so that you can act before more serious issues occur.

    Free download
    PRODUCT OVERVIEW

    ”Adopting PRTG has been like going from being in the dark to being in the light. Before, we had limited visibility into what was happening in the infrastructure and in the network. Now, however, thanks to the comprehensive dashboard and real-time notifications, we receive constant updates on the status of facilities and services, and our way of working has gone from passive to proactive.”

    Luca Meneghesso, Senior IT infrastructure and Security Specialist
    Banca Profilo

    ”GESAC increasingly focuses on innovation to improve the quality of services offered and the experience of passengers handled every day by Naples Airport. Thanks to PRTG, we finally have unified, automatic, and continuous monitoring of the airport network and can guarantee quick and timely interventions.”

    Domenico Ciervo, GESAC ICT Manager
    Naples International Airport

    ”As an international company, PRTG is ideal for us. If something went down half way across the world, we wouldn’t be woken up – we can rely on PRTG to identify the problem and alert us before it occurs – enabling the right person, in the right time zone to resolve the problem. At the end of the day, if we’re to provide an internal network experience for our employees that meets expectations, we need a tool like PRTG to be successful.”

    Barry Kelly, Systems Engineer
    Skyscanner

    “I would recommend PRTG because it has helped us significantly improve service uptime by highlighting important alerts that would otherwise result in a system failure or service disruption if action was not taken. Thanks to PRTG, we can ensure that The Ritz London’s network and IT systems are five-star, just like the hotel.”

    Richard Isted, IT Manager
    The Ritz London

    Your network performance monitor at a glance – even on the go

    PRTG is set up in a matter of minutes and can be used on a wide variety of mobile devices.

    device overview
    Gartner peer insights

    “Excellent tool for detailed monitoring. Alarms and notifications work greatly. Equipment addition is straight forward and server initial setup is very easy. ...feel safe to purchase it if you intend to monitor a large networking landscape.”

    Read the complete review at Gartner Peer Insights

    Create innovative solutions with Paessler’s IT partners

    Partnering with innovative IT vendors, Paessler unleashes synergies to create
    new and additional benefits for joined customers.

    Plixer

    Plixer

    Paessler and Plixer provide a complete solution adding flow and metadata analysis to a powerful network monitoring tool.

    Read more
    Rittal

    Rittal

    IT that works constitutes a business-critical basis for a company's success. Availability and security must be defined for the respective purpose and closely monitored – by OT and IT alike.

    Read more
    Siemon

    Siemon

    Siemon and Paessler bring together intelligent building technology and advanced monitoring and make your vision of intelligent buildings and data centers become reality.

    Read more


    PRTG makes network activity monitoring as easy as it gets

    Custom alerts and data visualization let you quickly identify and prevent security and performance issues.

    Free download
    PRODUCT OVERVIEW
    Paessler PRTG

    Paessler PRTG

    Network Monitoring Software – Version 26.1.116.1532 (February 9th, 2026)

    Hosting icon

    Hosting

    Download for Windows and cloud-based version PRTG Hosted Monitor available

    Languages icon

    Languages

    English, German, Spanish, French, Portuguese, Dutch, Russian, Japanese, and Simplified Chinese

    test

    Monitor everything

    Network devices, bandwidth, servers, applications, virtual environments, remote systems, IoT, and more

    test

    Pricing

    Choose the PRTG Network Monitor subscription that's best for you

    Discover more monitoring insights and stories

    Content illustration

    Powerful stories from the monitoring world

    • Monitoring Basics: How to Check Network Traffic - Paessler Blog
    • How to Look at Network Traffic: Essential Tools and Methods for ...
    • Your Switch Doesn't Support Flow? We Show How You Can Monitor ...
    Support illustration

    Resources to master your monitoring challenges

    • PRTG Manual: SNMP Traffic Sensor - Paessler
    • XBox network Internet Traffic Monitoring
    • how can I monitor all my network traffic in a real-time graph
    Solution illustration

    Solutions for all your monitoring needs

    • Network Mapping
    • LAN Monitoring
    • Database Monitoring

     Network Activity Monitor: FAQ


    What is a network activity monitor?

    A network activity monitor is a tool that tracks and analyzes all activity within a network. PRTG’s network activity monitor collects data using protocols like SNMP, WMI, SSH, NetFlow, sFlow, and packet sniffing. With visibility into bandwidth utilization, traffic patterns, data usage, device health, and performance metrics, IT teams can maintain network efficiency and security more effectively.

    Why do I need a network activity monitor?

    Without a network activity monitor, you risk downtime, bottlenecks, and security threats caused by blind spots in your infrastructure. A network activity monitor identifies those bottlenecks, tracks bandwidth hogs, analyzes traffic patterns, and monitors the health of devices, database metrics, and applications. It proactively sends alerts when issues arise, so your team can quickly resolve problems. PRTG ensures full visibility, enabling you to optimize bandwidth, troubleshoot efficiently, and maintain uptime.

    How easy is it to set up PRTG, really?

    PRTG is designed for simplicity and speed. Its intuitive interface, preconfigured sensors, and automated network discovery mean you can start monitoring within hours – not days – without needing extensive training or resources.

    Can PRTG monitor multiple locations and highly complex networks?

    Yes! PRTG supports multi-location monitoring with remote probes and is built to handle complex networks. Whether you’re managing cloud environments, hybrid setups, or global infrastructure, PRTG scales to meet your needs.

    How does PRTG send notifications?

    PRTG sends real-time notifications via email, SMS, push notification, and other methods, based on thresholds you set. You can also trigger command-line actions or integrate notifications into third-party systems for custom workflows.

    How can I monitor specific interfaces on my network devices?

    Monitor specific interfaces easily with the network interface monitor capabilities in PRTG. The auto-discovery feature identifies all available interfaces and suggests appropriate sensors. You can select which interfaces require monitoring based on their importance. The system collects detailed metrics including traffic volume, errors, and status for each monitored interface.


    What makes PRTG's network activity monitor different from other monitoring solutions?

    The network activity monitor in PRTG provides comprehensive visibility across your entire IT infrastructure in one unified interface. Unlike other solutions, this network activity monitor integrates monitoring for devices, applications, and bandwidth in a single platform. The system automatically discovers network components and applies appropriate sensors, eliminating complex manual configuration.

    What is a sensor in PRTG?

    In PRTG, “sensors” are the basic monitoring elements. One sensor usually monitors one measured value in your network, for example the traffic of a switch port, the CPU load of a server, or the free space on a disk drive. On average, you need about 5-10 sensors per device or one sensor per switch port.

    We asked: would you recommend PRTG? Over 95% of our customers say yes!

    Paessler conducted trials in over 600 IT departments worldwide to tune its network monitoring software closer to the needs of sysadmins. The result of the survey: over 95% of the participants would recommend PRTG – or already have.

    recommendation

    Still not convinced?

    Love

    More than 500,000 sysadmins love PRTG

    Paessler PRTG is used by companies of all sizes. Sysadmins love PRTG because it makes their job a whole lot easier.

    PRTG

    Monitor your entire IT infrastructure

    Bandwidth, servers, virtual environments, websites, VoIP services – PRTG keeps an eye on your entire network.

    test

    Try Paessler PRTG for free

    Everyone has different monitoring needs. That’s why we let you try PRTG for free.

    PRTG Logo

    Start monitoring network activity with PRTG and see how it can make your network more reliable and your job easier.

    Free download
    PRODUCT OVERVIEW

    Products

    • Paessler PRTG
      Paessler PRTGMonitor your whole IT infrastructure
      • PRTG Network Monitor
      • PRTG Enterprise Monitor
      • PRTG Hosted Monitor
      • PRTG UVexplorer
      • PRTG extensions
        Extensions for Paessler PRTGExtend your monitoring to a new level
    • Icon Features
      FeaturesExplore all monitoring features

    Monitoring with PRTG

    • Network monitoring
    • Bandwidth monitoring
    • SNMP monitoring
    • Network mapping
    • Wi-Fi monitoring
    • Server monitoring
    • Network traffic analyzer
    • NetFlow monitoring
    • Syslog server

    Useful Links

    • PRTG Manual
    • Knowledge Base
    • Customer Success Stories
    • About Paessler
    • Subscribe to newsletter
    • PRTG Support
    • PRTG Consulting
    • PRTG Feedback & Roadmap

    Contact

    Paessler GmbH
    Thurn-und-Taxis-Str. 14, 
    90411 Nuremberg 
    Germany

    [email protected]

    +49 911 93775-0

    • Contact us
    ©2026 Paessler GmbHTerms & ConditionsPrivacy PolicyImprintReport VulnerabilityDownload & InstallSitemap
    Finance Finance Finance