• Company
    • About Us
    • Case Studies
    • Press Center
    • Careers
    • Blog
    • Contact us
  • Contact us
  • Login
 
  • English
    • Deutsch
    • Español
    • Français
    • Italiano
    • Português
Paessler
                    - The Monitoring Experts
  • Products
    • Paessler PRTG
      Paessler PRTGMonitor your whole IT infrastructure
      • PRTG Network Monitor
      • PRTG Enterprise Monitor
      • PRTG Hosted Monitor
      • PRTG UVexplorer
      • PRTG extensionsExtensions for Paessler PRTGExtend your monitoring to a new level
    • Icon Features
      FeaturesExplore all monitoring features
      • Maps & dashboards
      • Alerts & notifications
      • Multiple user interfaces
      • Distributed monitoring
      • Customizable reporting
  • Solutions
    • Industries
      IndustriesMonitor various industry sectors
      • Industrial
      • Healthcare
      • Data Center
      • Education
      • Finance
      • Government
    • IT Topics
      IT TopicsMonitor all areas of IT
      • Network Monitoring
      • Bandwidth Monitoring
      • SNMP Monitor
      • Network Mapping
      • WiFi Monitoring
      • Server Monitoring
  • Pricing
  • Resources
    • Getting Started
      Getting StartedModules for self-paced learning
    • How-to Guides
      How-to GuidesGet the most out of PRTG
    • Videos & Webinars
      Videos & WebinarsLearn from Paessler experts
    • IT  Knowledge
      IT KnowledgeExpand your IT knowledge
    • PRTG Manual
      PRTG ManualFull documentation
    • Knowledge Base
      Knowledge BaseShare community knowledge
    • PRTG Sensor Hub
      PRTG Sensor HubGet sensors, scripts & templates
    • Trainings
      PRTG TrainingLearn how to work with PRTG
  • Partners
    • Icon Handshake
      Become a PartnerFor resellers and channel partners
    • Icon MSP
      Become an MSPDeliver monitoring as a managed service
    • icon partner
      Partner PortalLog in to your partner account
    • Deal Registration
      Deal RegistrationRegister your sales opportunities
    • icon search
      Find a PartnerFind partners selling Paessler products
    • icon technology
      Technology AlliancesSee Paessler technology partnerships
    • Partner HubTools for Your Success
  • Company
    • About Us
    • Case Studies
    • Press Center
    • Careers
    • Blog
    • Contact us
  • Contact us
  • Login
  • English
    • Deutsch
    • Español
    • Français
    • Italiano
    • Português
  • Get a quote
  • Free trial
  1. Home>
  2. IT Topics>
  3. Technology>
  4. Ping Monitoring

Enhance Network Performance Using Ping Monitoring with PRTG

Get a free ping tool and all-in-one network monitoring in a single pane of glass

  • Monitor the availability of all network devices and other endpoints
  • Get customizable real-time alerts and notifications
  • Create custom overviews, network maps, and dashboards
Free download
PRODUCT OVERVIEW

Our Users Give Top Ratings for Monitoring With Paessler PRTG

Gartner peer insights
spiceworks
G2
Capterra

PRTG ping monitoring: What you will find on this page

Table of content

    PRTG makes ping monitoring as easy as it gets

    Custom alerts and data visualization let you quickly identify and prevent low availability and unplanned downtime.

    Free download
    PRODUCT OVERVIEW

    5 reasons why to choose PRTG as your ping monitoring tool

    One tool for everything

    With PRTG, you get a powerful tool for your entire network. Whether servers, routers, switches, uptime, or cloud connectivity: PRTG keeps an eye on everything and saves you administrative hassle. In addition to Ping sensors, SNMP, NetFlow, Packet Sniffing sensors and DHCP monitoring capabilities, PRTG uses many more sensors so that you can always keep an eye on your network availability and performance.

    Real-time notifications

    PRTG comes with a customizable alerting system that immediately notifies you via SMS, push, or email notifications if there is an network issue, like downtime or network performance problems. The Ping sensor is set as the master sensor for your network devices. If this sensor shows an error, all other sensors on a device go into sleep mode. This means that you’ll receive just this one important notification – and that you won't be flooded by alerts.

    Your network at a glance

    The easy-to-read PRTG dashboard provides a quick overview of your network. PRTG uses a clear color coding system so that you can see at one glance if everything is alright. Dashboards and maps in PRTG are customizable to meet all your specific needs. And if you're away from your desk – for example, when you work in the server room – you can always access PRTG via our PRTG apps for iOS or Android so that you never miss a beat.

    Easy setup & configuration

    PRTG uses an intelligent auto-discovery feature that automatically scans your network for available devices and adds suitable sensors for monitoring. This way, PRTG is installed and set up in minutes so that you can immediately start with your initial monitoring. Our smart setup assistant helps you with further configuration steps and makes sure that you'll never feel left alone during your first steps in PRTG.

    Transparent licensing & upgrades

    Licensing in PRTG is always transparent and fair: You can test PRTG for free for 30 days to check if our monitoring tool suits your needs. For small networks, there is even a freeware version available that includes up to 100 sensors. And if you prefer monitoring from the cloud, choose PRTG Hosted Monitor, which is subscription based and hosted by Paessler. What's more: all licenses and subscriptions are easily upgradeable should your IT infrastructure grow.

    What ping monitoring looks like in PRTG

    Diagnose network issues and outages by continuously tracking all your network devices including servers, routers, workstations, and DHCP scope monitoring. Show ping response times and other key metrics in real time. Visualize monitoring data in clear graphs and dashboards to identify problems more easily. Gain the overview you need to troubleshoot network connection issues.

    PRTG Screenshot device tree view

    Device tree view of the complete monitoring setup

    PRTG screenshot map entire it infrastructure

    Custom PRTG dashboard for keeping an eye on the entire IT infrastructure

    PRTG screenshot graph live data traffic

    Live traffic data graph in PRTG

    Start ping monitoring with PRTG and see how it can make your network more reliable and your job easier.

    Free download
    PRODUCT OVERVIEW

    IT experts agree: Paessler PRTG is a great solution for IT infrastructure monitoring

    PCMag

    “All-around winning
     network monitor”

    IT Brief

    “The real beauty of PRTG is the endless possibilities it offers”

    ITPro

    “PRTG Network Monitor 
    is very hard to beat”

    Ping monitoring tools at a glance

    check

    Ping via the command line

    The command line is still a commonly used way to execute a ping query, particularly when a malfunction or urgent issue occurs and you need to quickly an IP address or a service check for availability.

    check

    Round-the-clock monitoring tools

    Our network monitoring software monitors the availability and reachability of all your network devices and connections 24/7. Gone are the days of manual monitoring - PRTG runs in the background and automatically alerts you if there is an issue in your network. Ping monitoring is one of the core functionalities of PRTG; but with our software, you can also comprehensively monitor your entire network, your applications, your traffic, and more.

    check

    Specialized tools vs. all-in-one monitoring tools

    Some ping monitoring tools do nothing more than running ping tests. These tools are often free of charge. Other tools, such as PRTG, are comprehensive network monitoring solutions. The advantage of an all-in-one monitoring solution: all your monitoring tasks are performed in one central tool. Although, if you have an extremely small network, it is sufficient to start with a simple ping tool.

    check

    Open-source vs. proprietary software

    Network monitoring tools include open-source applications like Nagios and proprietary software like PRTG. Our software is easy to set up, can be easily upgraded, and comes with outstanding technical support. As a result, many companies switch from their open-source tools to PRTG. See for example our comparison of Nagios and PRTG.

    The complete solution: What else does PRTG monitor?

    Network monitoring

    Network monitoring, network analysis, network diagnosis, network traffic or DHCP monitoring? Whatever the issue you're currently facing – PRTG will be able to help. Find out more about our PRTG network monitoring tool.

    Server monitoring

    Mail servers, web servers, database servers and DHCP monitoring: PRTG offers an extensive range of server monitoring features. Of course, you can also monitor virtual servers with PRTG – for example, we are a certified VMware Technology Alliance Partner. Find out more about our PRTG server monitoring software.

    Uptime monitoring

    With PRTG, you'll always know if your network or a part of your network is up or down. Thanks to our comprehensive monitoring, you are immediately notified if there is an issue so that you can start troubleshooting right away. PRTG measures the availability of your servers, CDNs, individual network devices, websites, and more. Find out more about our PRTG uptime monitoring tool.

    VPN monitoring

    PRTG monitors VPN connections and measures network traffic, bandwidth, load, and the number of logged-in users. Identify connection problems and suspicious traffic at one glance. Find out more about VPN monitoring with PRTG.

    VoIP monitoring

    Monitor the quality of your VoIP connections with PRTG to prevent malfunctions and make sure that you comply with service level agreements (IP SLA). This way, you will not only save a lot of time, but also a huge sum of money. Find out more about VoIP monitoring with PRTG.

    Explore our preconfigured PRTG sensors for ping monitoring

    PRTG comes with more than 250 native sensor types for monitoring your entire on-premises, cloud, and hybrid cloud environment out of the box. Check out some examples below!

    Ping v2

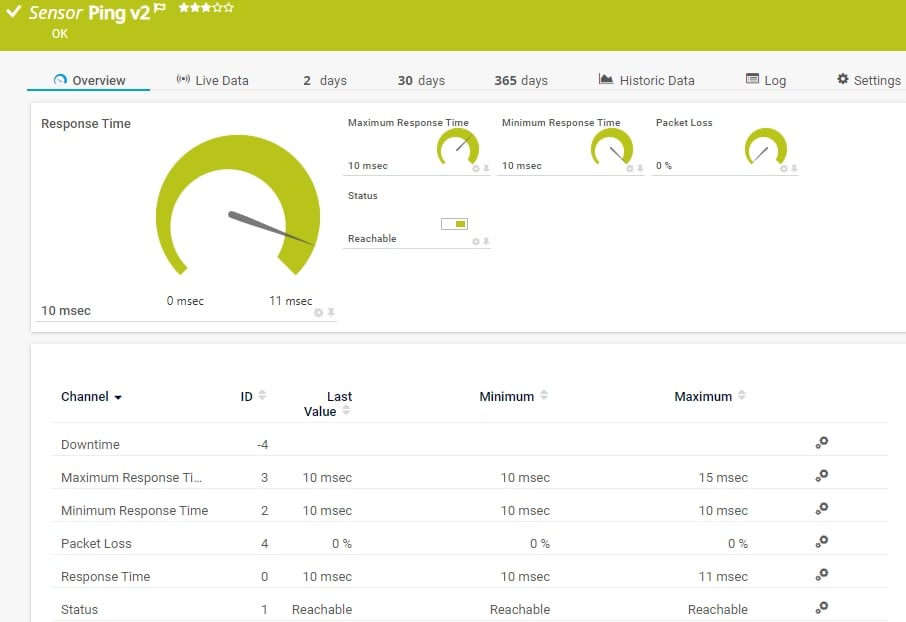
    The Ping v2 sensor sends an Internet Control Message Protocol (ICMP) echo request ("ping") from the probe system to the parent device to monitor its availability. It can show the following:

    • Response time

    • Packet loss

    • Target status

    • Minimum and maximum ping time

    Ping v2
    Ping v2

    Ping Jitter

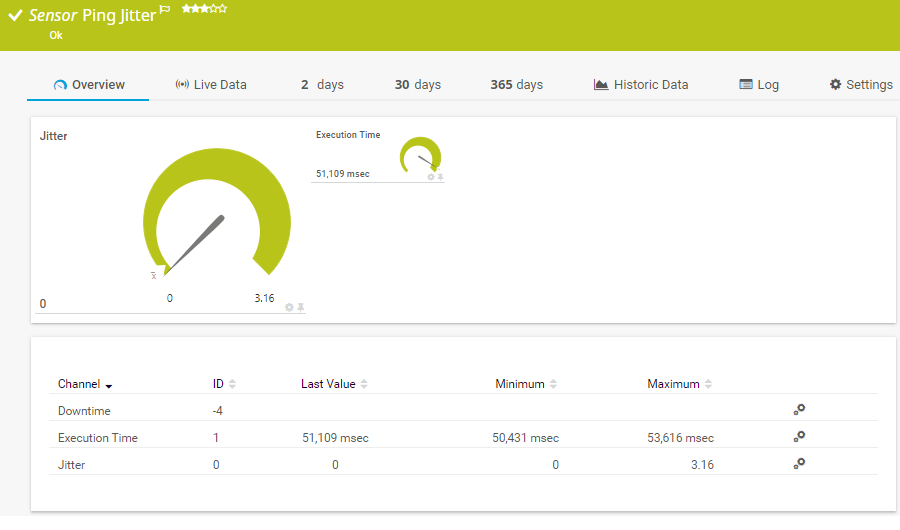
    The Ping Jitter sensor sends a series of Internet Control Message Protocol (ICMP) echo requests ("pings") to a URI to determine the statistical jitter. It can show the following:

    • Execution time
    • Statistical jitter value
    Ping Jitter
    Ping Jitter

    SIP Options Ping

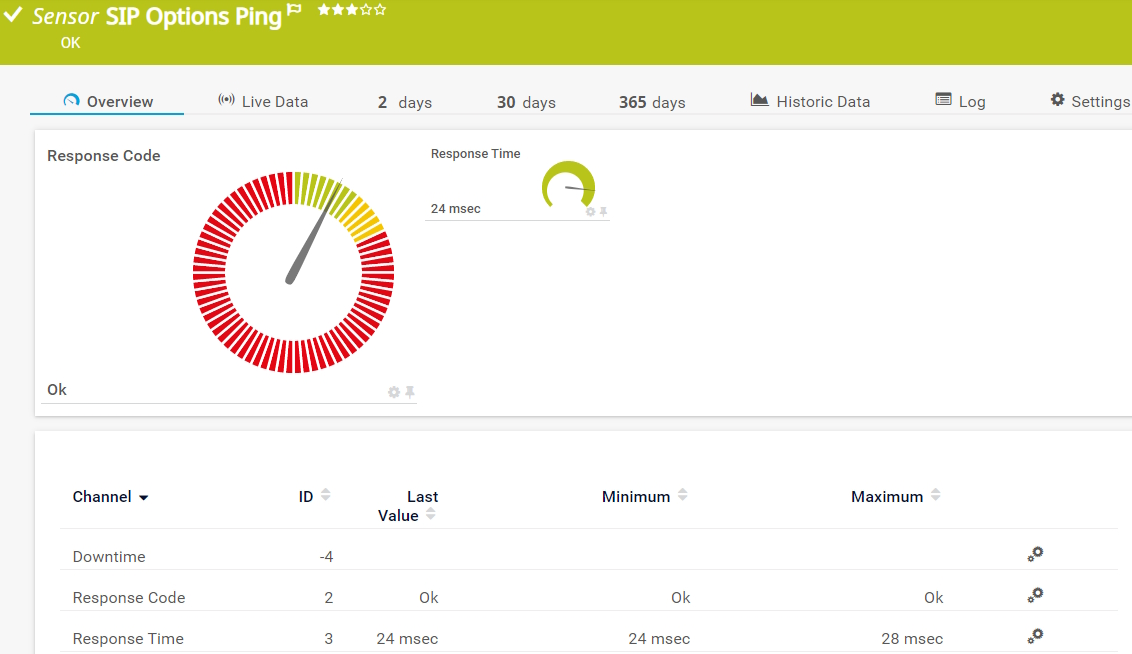
    The SIP Options Ping sensor monitors the connectivity to a Session Initiation Protocol (SIP) server using SIP options "ping". The sensor sends auth and options requests to the SIP server. It can show the following:

    • Response code
    • Response time
    SIP Options Ping
    SIP Options Ping

    WMI Remote Ping

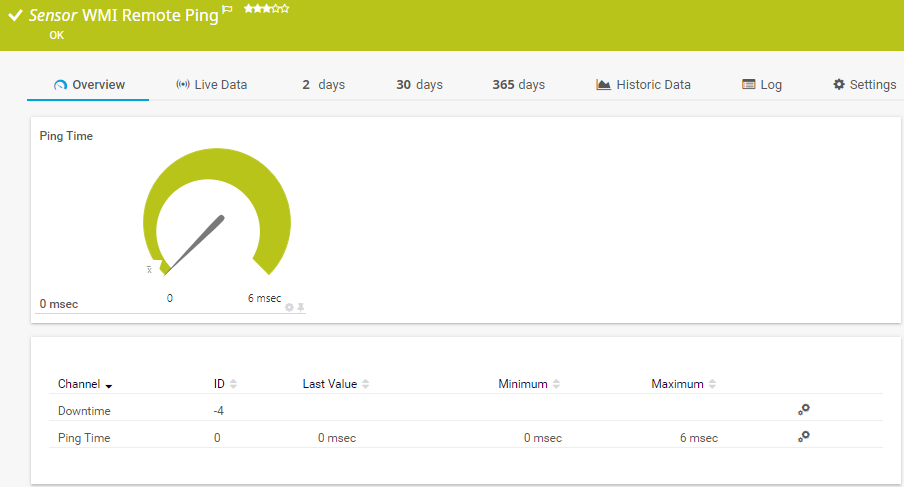
    The WMI Remote Ping sensor remotely connects to a Windows system and performs an Internet Control Message Protocol (ICMP) echo request ("ping") from this device to a specified target. It can show the following:

    • Ping time from the remote device to the target device
    • Downtime
    WMI Remote Ping
    WMI Remote Ping

    See the PRTG Manual for a list of all available sensor types.

    PRTG Is Compatible With All Major Vendors, Products, and Systems

    compatible with all major vendors, products, and systems

    Free ping monitoring vs. licensed editions

    check

    Ping monitoring freeware

    • 100 sensors free for life
    • For each device about 10 sensors required
    • 100 sensors often enough for basic ping monitoring
    • Alarm, mapping, and report features included
    • Freeware edition sufficient for most small networks
    check

    PRTG licenses

    • Flexible licenses with 500 to 10,000 sensors
    • Monitor 50 to 1,000 devices or more
    • Easily upgrade if more sensors are required
    • Existing monitoring unchanged with upgrade
    • Try full version free for 30 days

    PRTG makes ping monitoring as easy as it gets

    Custom alerts and data visualization let you quickly identify and prevent low availability and unplanned downtime.

    Free download
    PRODUCT OVERVIEW

    Your ping monitor at a glance – even on the go

    PRTG is set up in a matter of minutes and can be used on a wide variety of mobile devices.

    device overview

    Create innovative solutions with Paessler’s IT partners

    Partnering with innovative IT vendors, Paessler unleashes synergies to create
    new and additional benefits for joined customers.

    Martello

    Martello 

    By integrating PRTG with Martello iQ, you can add a fast analytics layer to improve uptime, visualize your IT environment, and integrate all of your IT systems into a single pane of glass.

    Read more
    Plixer

    Plixer

    Paessler and Plixer provide a complete solution adding flow and metadata analysis to a powerful network monitoring tool.

    Read more
    Siemon

    Siemon

    Siemon and Paessler bring together intelligent building technology and advanced monitoring and make your vision of intelligent buildings and data centers become reality.

    Read more

    Find the root cause of the problem with our PRTG ping monitoring solution

    Real-time notifications mean faster troubleshooting so that you can act before more serious issues occur.

    Free download
    PRODUCT OVERVIEW
    Paessler PRTG

    Paessler PRTG

    Network Monitoring Software – Version 26.1.116.1532 (February 9th, 2026)

    Hosting icon

    Hosting

    Download for Windows and cloud-based version PRTG Hosted Monitor available

    Languages icon

    Languages

    English, German, Spanish, French, Portuguese, Dutch, Russian, Japanese, and Simplified Chinese

    test

    Monitor everything

    Network devices, bandwidth, servers, applications, virtual environments, remote systems, IoT, and more

    test

    Pricing

    Choose the PRTG Network Monitor subscription that's best for you

    Discover more monitoring insights and stories

    Content illustration

    Powerful stories from the monitoring world

    • What Is Ping? – IT Explained
    • Let's ping your network - Paessler Blog
    • Ping Command Troubleshooting: Network Diagnostics Guide
    Support illustration

    Resources to master your monitoring challenges

    • Device and Sensor Setup
    • I run PRTG on VMware. How can I obtain best performance?
    • PRTG Apps for Mobile Network Monitoring
    Solution illustration

    Solutions for all your monitoring needs

    • NetFlow Monitoring
    • Server Monitoring
    • Database Monitoring

    Ping Monitoring: FAQ


    What is a ping?

    Ping is a command-line utility which is available on almost any operating system with network connectivity. It acts as a test to see if a networked device is reachable. The ping command sends a request over the network to a specific target device. A successful ping results in a response from the device that was pinged to the source system. Usually, ping is used to check the availability of a device and measure the round-trip time of the request and response.

    What is a ping test?

    A ping test shows you if a source system is able to connect to a target device, that is, if this device is available. It is an extremely simple diagnostic tool for getting a general idea of a device's availability. It does not, however, tell you how well individual devices are running. For this, you need a more detailed analysis, for example via SNMP, WMI, or SSH.

    What is ping monitoring?

    Ping monitoring is the process of pinging devices in a network with a monitoring software like PRTG to find out if they are available. With the data that a pinged device sends back, the monitoring tool can measure and analyze minimum, maximum, and average response time and deviations from the sent ping.

    What is a good ping value?

    In a local network, a ping value of one millisecond is considered normal. On the Internet, it depends on the application. A video conference requires a lower ping value than a request to a website. A ping value of less than 100 milliseconds is preferable, but a value of around 500 milliseconds is often still acceptable for a reasonable user experience.

    Why does the ping value matter?

    Every system administrator can immediately tell if a ping value is too high. High ping values usually lead to more work for the technical support team because they can indicate, for example, that network connections or telephone services are down. Therefore, it is always good to know about your ping times with a ping monitoring software like PRTG.

    How can I ping all the devices in my network?

    When you install PRTG, the tool automatically pings all network devices within a specified IP range and incorporates them into your monitoring environment. Such devices can be, for example, routers, switches, servers, or stationary computers. This way, you don't have to do anything to set up your initial monitoring.

    How does ping tracking with PRTG work?

    PRTG uses Ping sensors to monitor the availability of your network devices. It pings the devices in your network and waits for a response. This way, it can measure, for example, the response time of a device, that is, the time it takes the device to send back a response to the PRTG core server system.

    Does PRTG ping monitoring work for distributed networks?

    Yes, our software can also be used to ping devices in distributed networks. PRTG uses remote probes to connect other locations to your central monitoring environment. If something goes wrong, you are alerted in real time so that you can take action at once.

    How does alerting work?

    Our ping monitoring tool monitors your network devices around the clock. You can individually set the threshold values that trigger an alert when they exceed or fall below a specific value. If a device fails, PRTG notifies you at once.

    Does PRTG support DHCP monitoring and scope monitoring?

    Yes, PRTG provides comprehensive DHCP monitoring capabilities to ensure your network's IP address infrastructure runs smoothly. Our DHCP monitoring solution tracks server availability, monitors IP pool utilization, and provides real-time alerts when issues arise. 

    DHCP scope monitoring is a key component that tracks individual IP address ranges within your DHCP infrastructure to prevent IP exhaustion and optimize address allocation. With DHCP scope monitoring, you can monitor scope utilization rates, track lease distribution, and receive proactive notifications before scopes reach capacity limits. 

    This integrated approach to DHCP monitoring helps prevent network connectivity issues, reduces troubleshooting time, and ensures optimal IP address management across your entire infrastructure. PRTG's DHCP monitoring sensors work alongside our ping monitoring capabilities to provide complete visibility into your network's connectivity and address management systems.

    What is a sensor in PRTG?

    In PRTG, “sensors” are the basic monitoring elements. One sensor usually monitors one measured value in your network, for example the traffic of a switch port, the CPU load of a server, or the free space on a disk drive. On average, you need about 5-10 sensors per device or one sensor per switch port.

    We asked: would you recommend PRTG? Over 95% of our customers say yes!

    Paessler conducted trials in over 600 IT departments worldwide to tune its network monitoring software closer to the needs of sysadmins. The result of the survey: over 95% of the participants would recommend PRTG – or already have.

    recommendation

    Still not convinced?

    Love

    More than 500,000 sysadmins love PRTG

    Paessler PRTG is used by companies of all sizes. Sysadmins love PRTG because it makes their job a whole lot easier.

    PRTG

    Monitor your entire IT infrastructure

    Bandwidth, servers, virtual environments, websites, VoIP services – PRTG keeps an eye on your entire network.

    test

    Try Paessler PRTG for free

    Everyone has different monitoring needs. That’s why we let you try PRTG for free.

    PRTG Logo

    Start ping monitoring with PRTG and see how it can make your network more reliable and your job easier.

    Free download
    PRODUCT OVERVIEW

    Products

    • Paessler PRTG
      Paessler PRTGMonitor your whole IT infrastructure
      • PRTG Network Monitor
      • PRTG Enterprise Monitor
      • PRTG Hosted Monitor
      • PRTG UVexplorer
      • PRTG extensions
        Extensions for Paessler PRTGExtend your monitoring to a new level
    • Icon Features
      FeaturesExplore all monitoring features

    Monitoring with PRTG

    • Network monitoring
    • Bandwidth monitoring
    • SNMP monitoring
    • Network mapping
    • Wi-Fi monitoring
    • Server monitoring
    • Network traffic analyzer
    • NetFlow monitoring
    • Syslog server

    Useful Links

    • PRTG Manual
    • Knowledge Base
    • Customer Success Stories
    • About Paessler
    • Subscribe to newsletter
    • PRTG Support
    • PRTG Consulting
    • PRTG Feedback & Roadmap

    Contact

    Paessler GmbH
    Thurn-und-Taxis-Str. 14, 
    90411 Nuremberg 
    Germany

    [email protected]

    +49 911 93775-0

    • Contact us
    ©2026 Paessler GmbHTerms & ConditionsPrivacy PolicyImprintReport VulnerabilityDownload & InstallSitemap
    PRTG Network Monitor PRTG Network Monitor PRTG Network Monitor