• Company
    • About Us
    • Case Studies
    • Press Center
    • Careers
    • Blog
    • Contact us
  • Contact us
  • Login
 
  • English
    • Deutsch
    • Español
    • Français
    • Italiano
    • Português
Paessler
                    - The Monitoring Experts
  • Products
    • Paessler PRTG
      Paessler PRTGMonitor your whole IT infrastructure
      • PRTG Network Monitor
      • PRTG Enterprise Monitor
      • PRTG Hosted Monitor
      • PRTG UVexplorer
      • PRTG extensionsExtensions for Paessler PRTGExtend your monitoring to a new level
    • Icon Features
      FeaturesExplore all monitoring features
      • Maps & dashboards
      • Alerts & notifications
      • Multiple user interfaces
      • Distributed monitoring
      • Customizable reporting
  • Solutions
    • Industries
      IndustriesMonitor various industry sectors
      • Industrial
      • Healthcare
      • Data Center
      • Education
      • Finance
      • Government
    • IT Topics
      IT TopicsMonitor all areas of IT
      • Network Monitoring
      • Bandwidth Monitoring
      • SNMP Monitor
      • Network Mapping
      • WiFi Monitoring
      • Server Monitoring
  • Pricing
  • Resources
    • Getting Started
      Getting StartedModules for self-paced learning
    • How-to Guides
      How-to GuidesGet the most out of PRTG
    • Videos & Webinars
      Videos & WebinarsLearn from Paessler experts
    • IT  Knowledge
      IT KnowledgeExpand your IT knowledge
    • PRTG Manual
      PRTG ManualFull documentation
    • Knowledge Base
      Knowledge BaseShare community knowledge
    • PRTG Sensor Hub
      PRTG Sensor HubGet sensors, scripts & templates
    • Trainings
      PRTG TrainingLearn how to work with PRTG
  • Partners
    • Icon Handshake
      Become a PartnerFor resellers and channel partners
    • Icon MSP
      Become an MSPDeliver monitoring as a managed service
    • icon partner
      Partner PortalLog in to your partner account
    • Deal Registration
      Deal RegistrationRegister your sales opportunities
    • icon search
      Find a PartnerFind partners selling Paessler products
    • icon technology
      Technology AlliancesSee Paessler technology partnerships
    • Partner HubTools for Your Success
  • Company
    • About Us
    • Case Studies
    • Press Center
    • Careers
    • Blog
    • Contact us
  • Contact us
  • Login
  • English
    • Deutsch
    • Español
    • Français
    • Italiano
    • Português
  • Get a quote
  • Free trial

Reliable Ping Scanner

Monitor IP addresses, track response times, and get alerted the moment a device goes offline.

Free download
PRODUCT OVERVIEW

How do I continuously monitor device availability across my network?

A ping scanner works by sending ICMP echo requests to network devices and recording which hosts respond, how fast, and whether any packets are being lost. For most IT teams, that check needs to run continuously across the full device inventory: routers, switches, servers, firewalls, printers, VoIP phones, and anything else with an IP address. A one-time scan gives you a snapshot. Ongoing monitoring gives you a record.  

PRTG handles this as a continuous IP scanner, not a script you run on demand. It monitors every host on your local network and remote sites, stores historical ping data, and alerts you when response times or availability cross a defined threshold. Supports IPv4 and IPv6, uses ICMP, TCP, and SSH depending on the sensor type and environment.  

PRTG monitors: routers, switches, firewalls, printers, VoIP phones, and any host reachable via ICMP, TCP, or SSH. Covers IPv4 and IPv6, on a single subnet or across multiple sites. Works on Windows, Linux, and macOS.

Download PRTG Trial

What you will find on this page

  • Ping Monitoring for Your Network
  • Monitor Your Network with Ping
  • PRTG vs. Free & Open-Source
  • FAQs

PRTG is compatible with all major vendors, products, and systems

compatible with all major vendors, products, and systems

Complete Ping Monitoring, From Single Host to Multi-Site Network

Always-On Visibility for Every Device

A device goes offline on your LAN and the first sign is a user complaint. Without continuous monitoring, there's no way to know how long something has been unreachable or how bad packet loss was before it got there. PRTG sends ICMP ping scans to every monitored host at configurable intervals, tracks response times and packet loss independently, and sends alerts via email, SMS, or push the moment a threshold is crossed. You get a current view of every host without checking anything manually.

  • ICMP echo requests to every monitored host at configurable intervals
  • Threshold-based alerts via email, SMS, or push when a host stops responding
  • Packet loss and full outage tracked separately (the distinction matters for diagnosis)
  • Alert thresholds per host, group, or subnet
  • One dashboard showing current status for all hosts. Updates every scan cycle.

Monitoring That Runs Without Scripts

Many network administrators manage availability with a ping sweep script, a PowerShell loop or command-line task that runs on a schedule. It works until the network changes and the script breaks, and nobody finds out until something's already down. PRTG's auto-discovery scans a defined range of IP addresses, identifies active hosts, and creates sensors automatically. From there it keeps running, storing every result in PRTG's database, searchable and graphable, without anyone touching a script again.
  • Auto-discovery scans subnets or custom IP ranges and creates sensors for found hosts automatically
  • No manual re-runs, no cron jobs to maintain. Sensors run on their own schedule.
  • Every ping result stored historically, searchable, graphable, exportable
  • One dashboard covering all hosts, regardless of OS
  • Sensors persist across reboots and maintenance windows
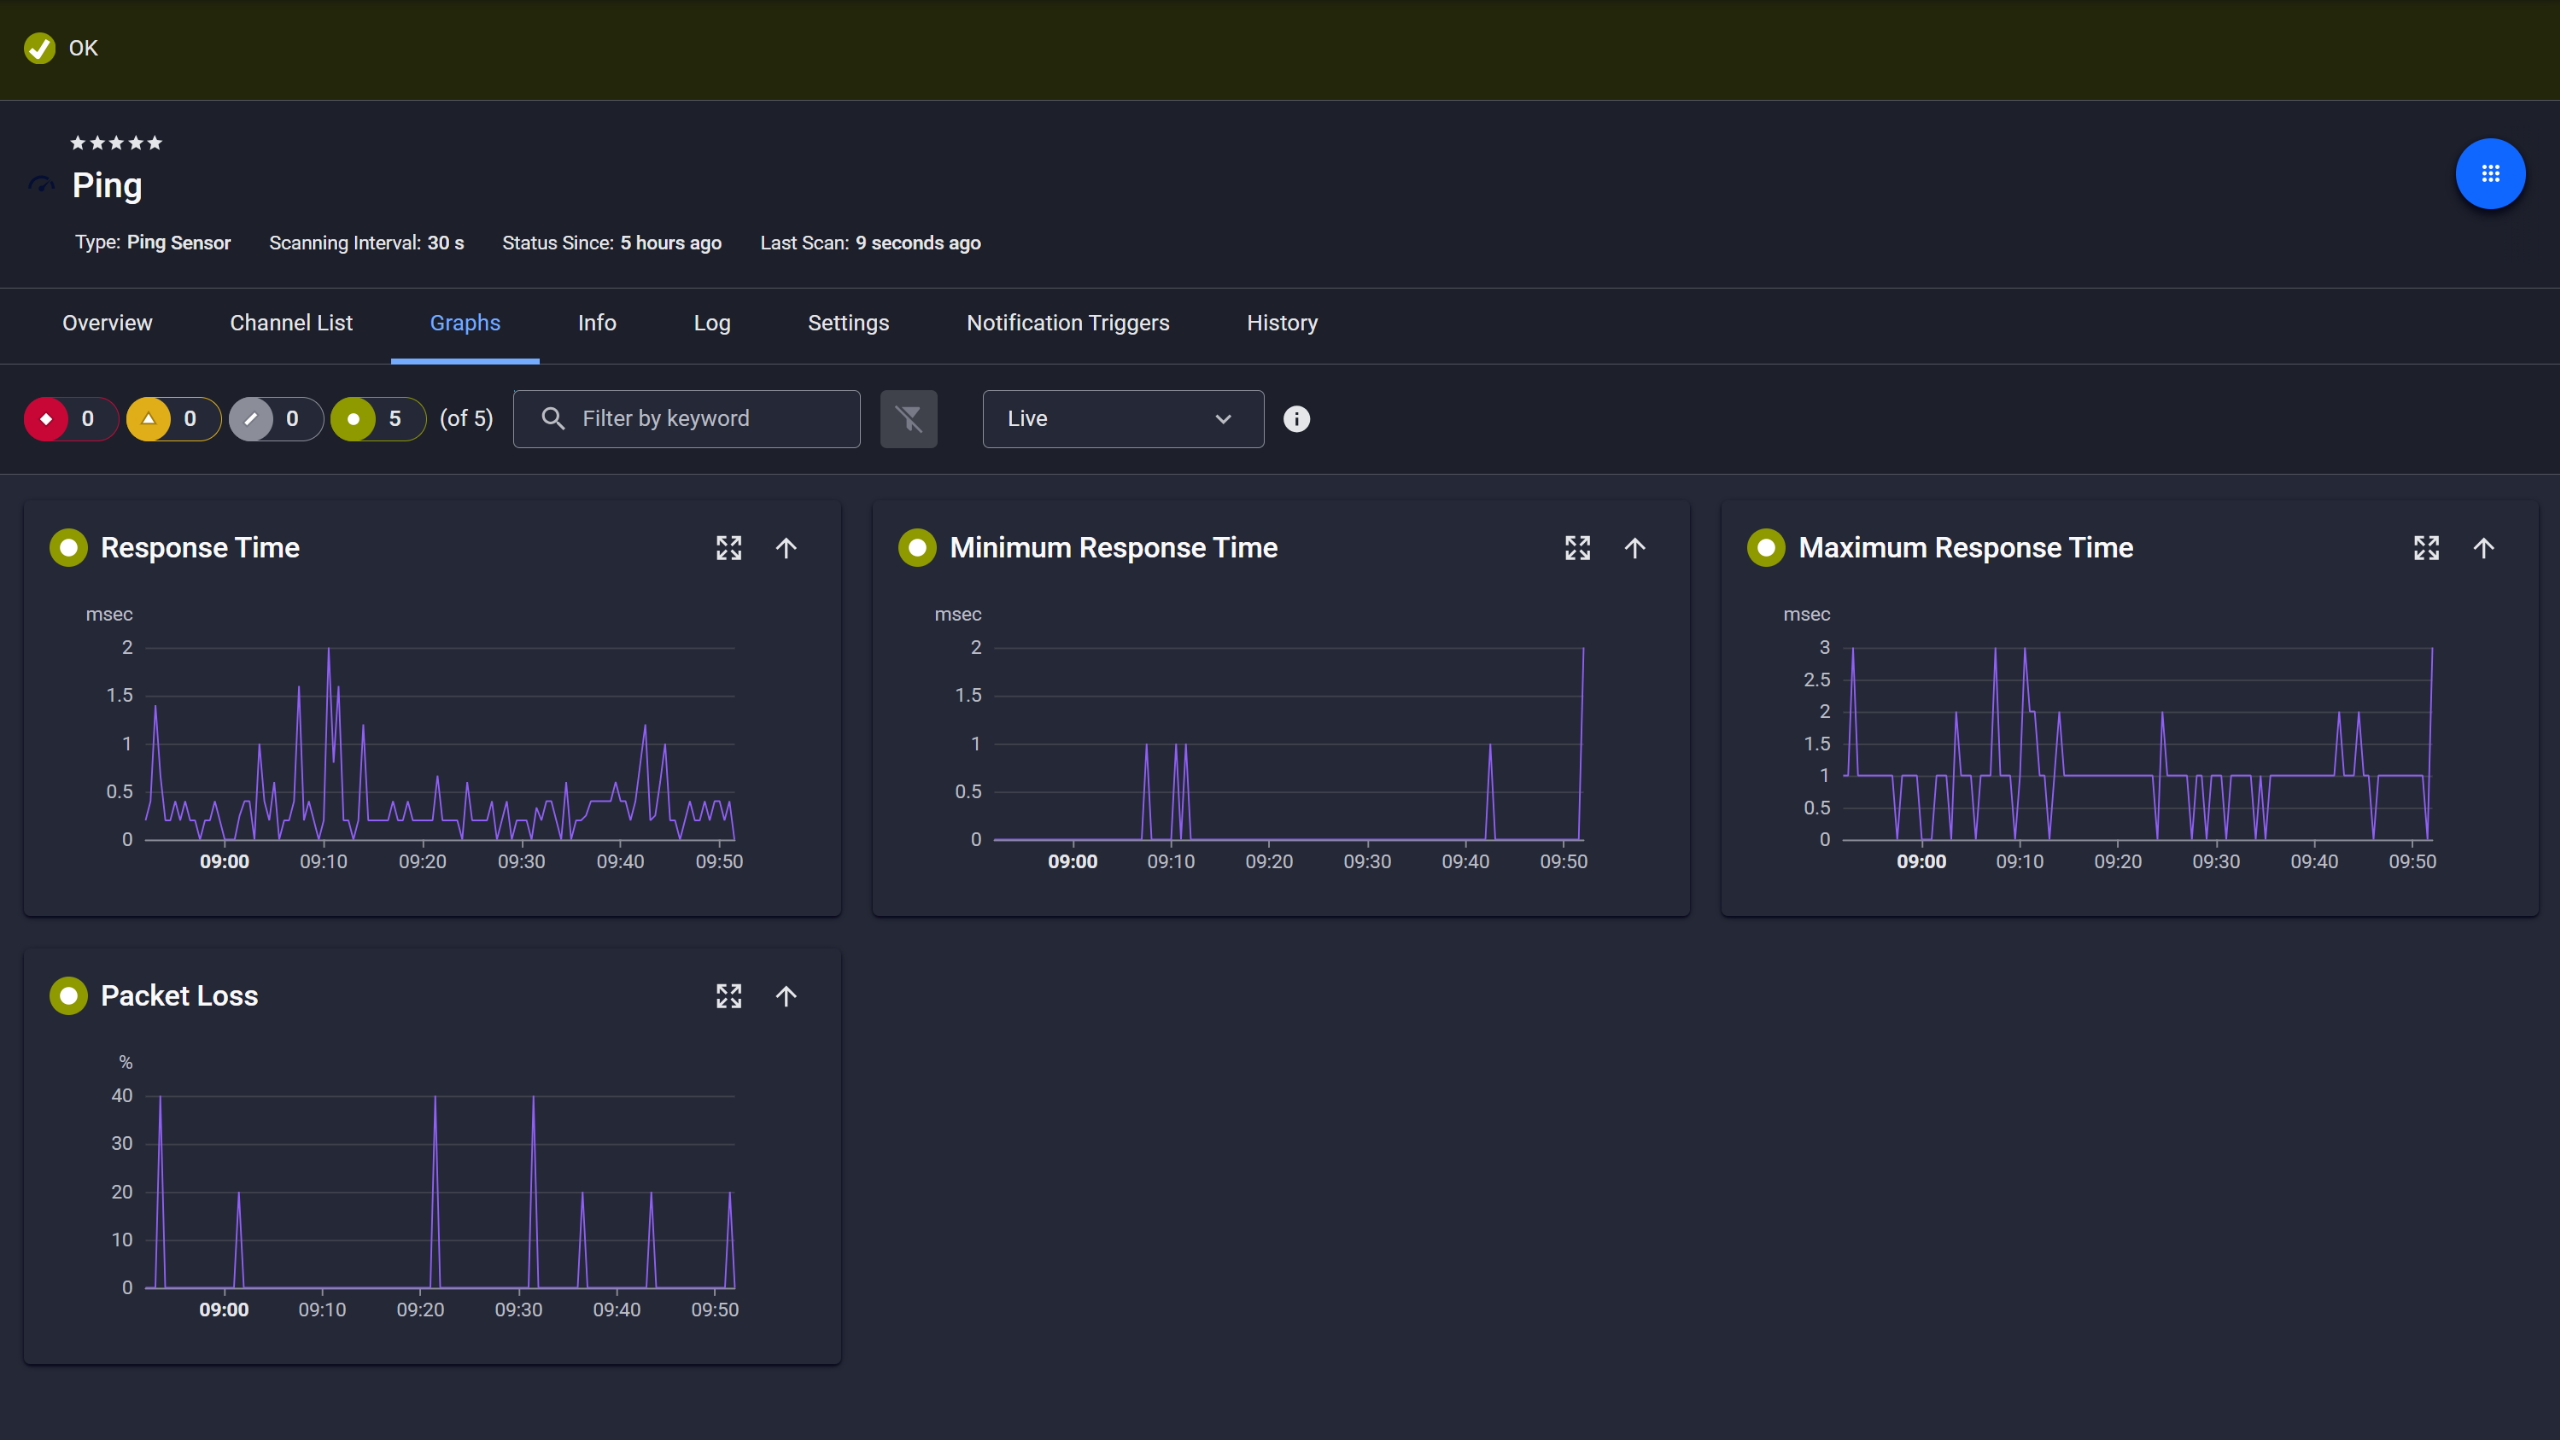
PRTG Ping sensor graphs showing response time, min, max, and packet loss over time

Ping response and packet loss

PRTG web interface showing device tree and full device list with sensor status badges

Full device list, instant overview

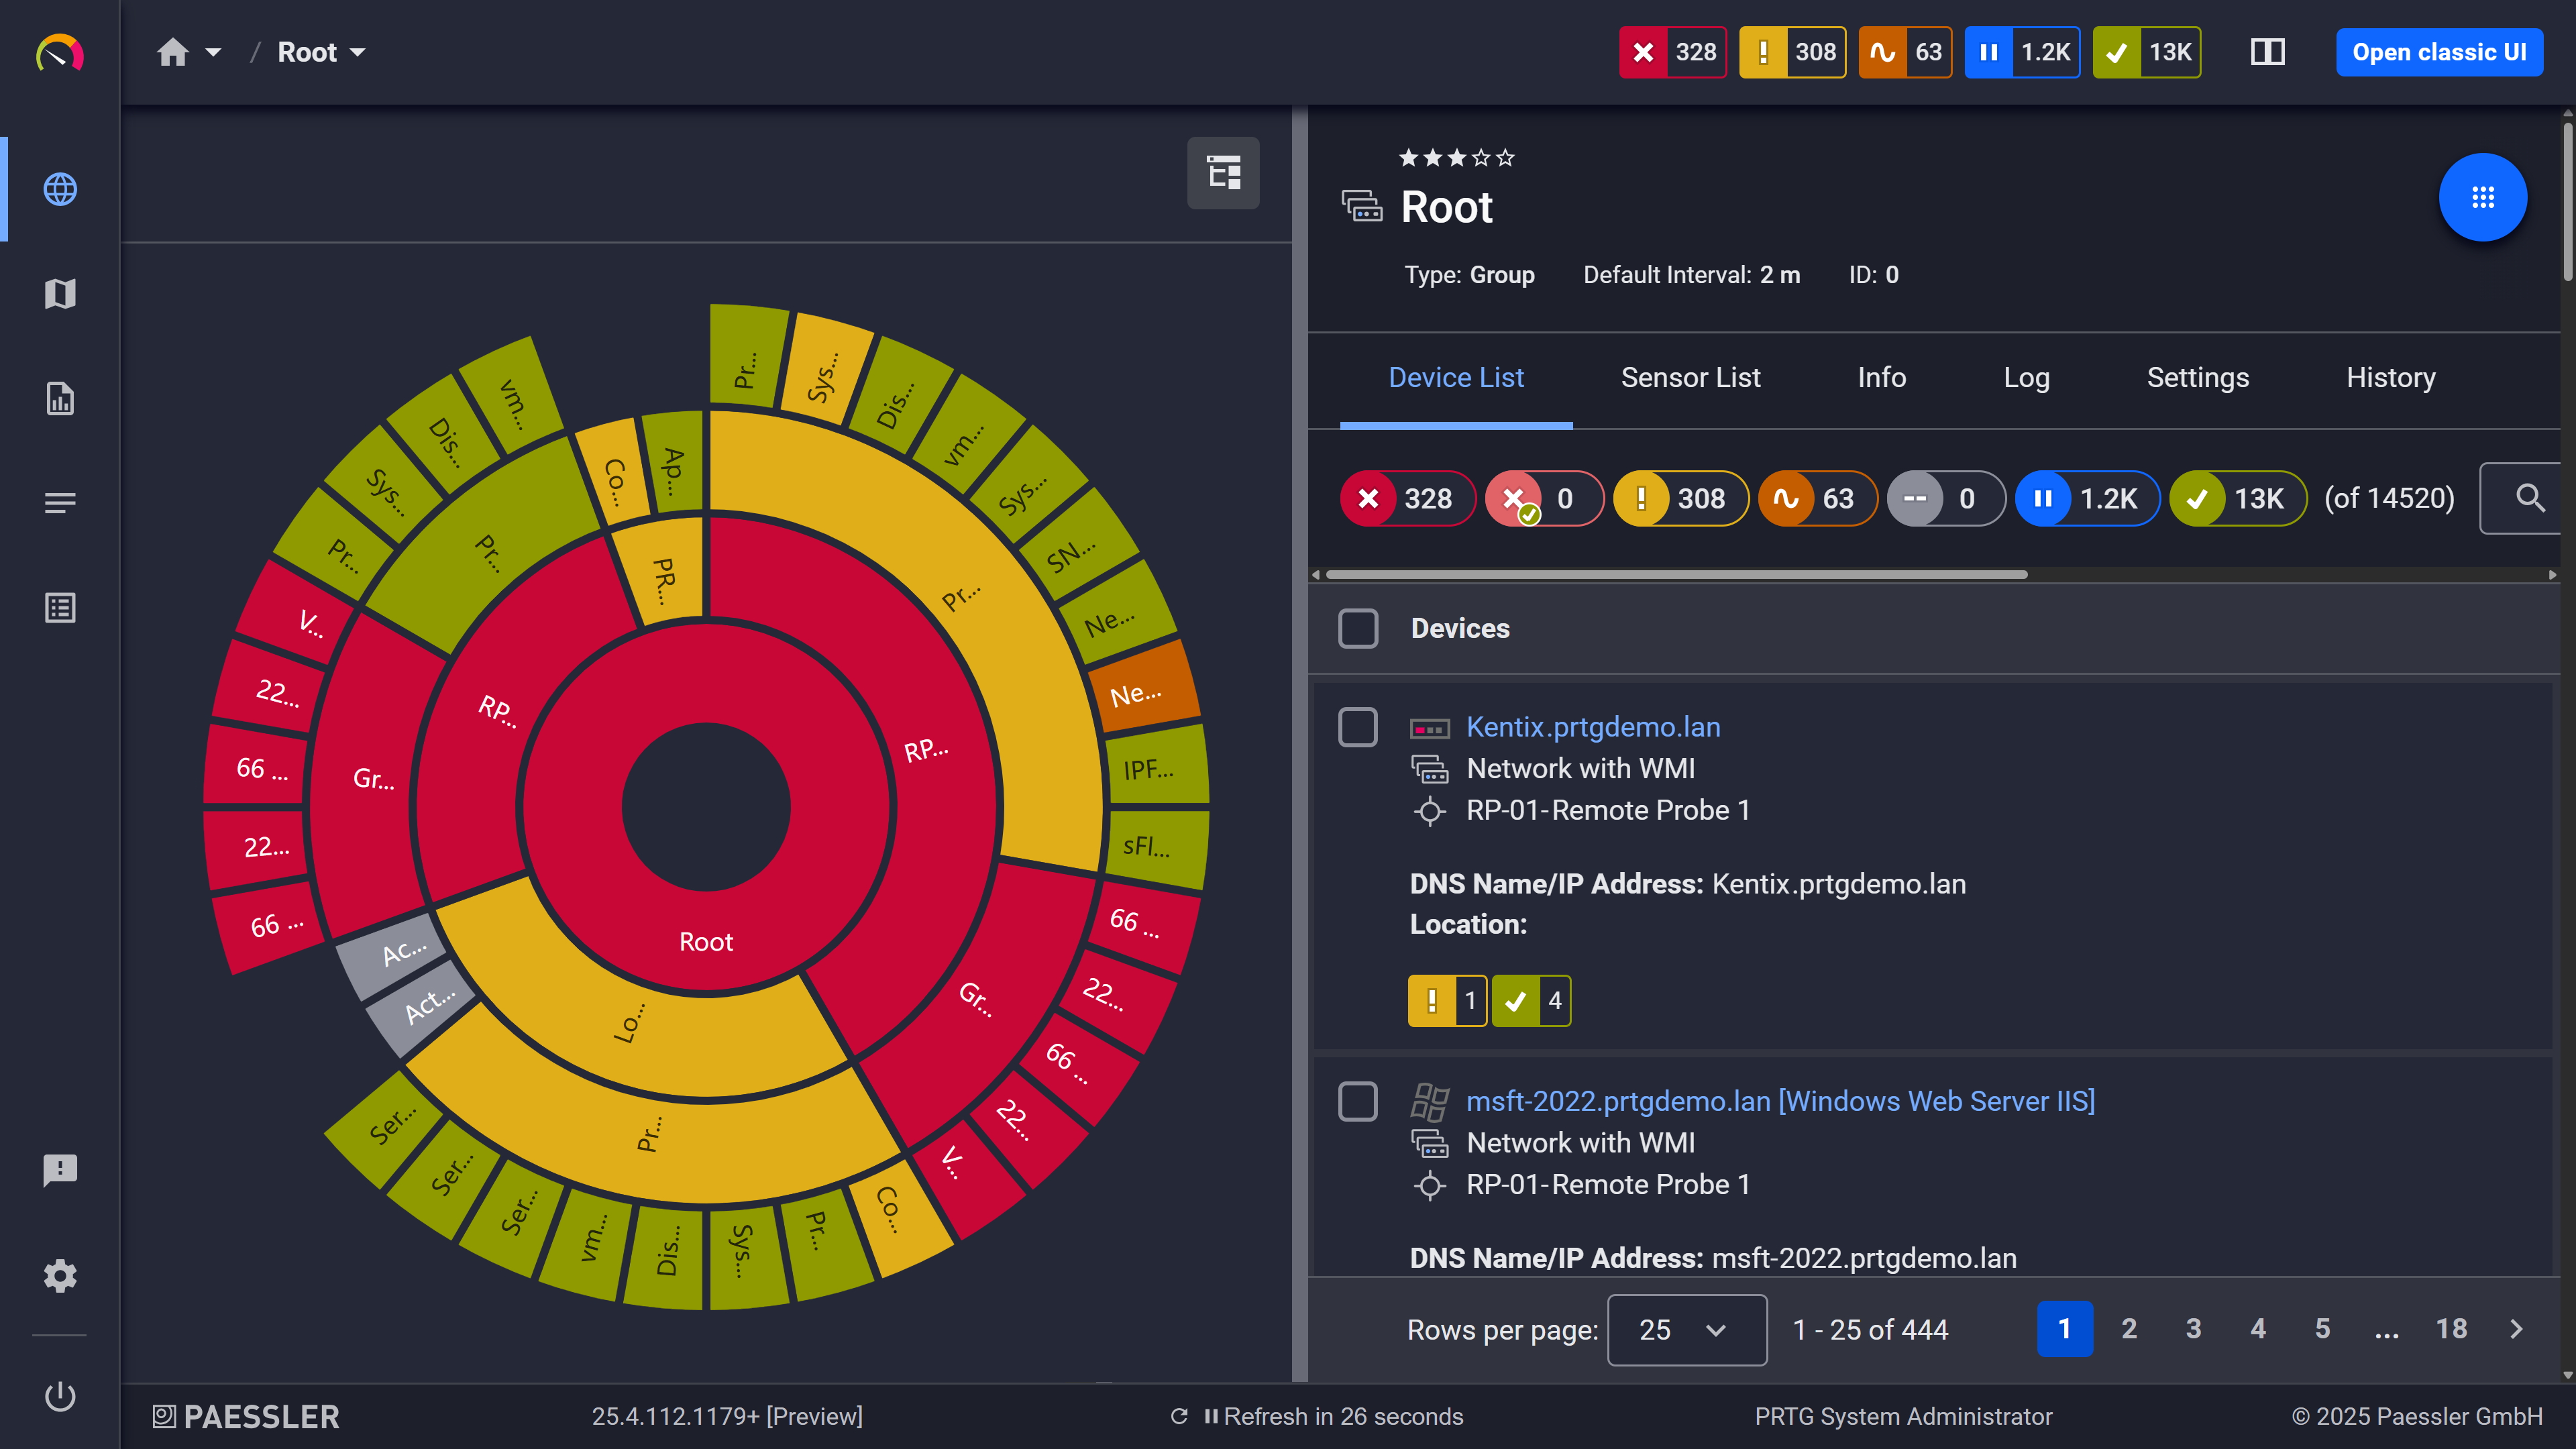
PRTG sunburst chart visualizing the full network hierarchy with color-coded sensor status

Your entire network, visualized instantly

Latency History You Can Actually Use

Historical response time data is what turns a vague latency complaint into a clear timeline. PRTG logs every response time measurement, tracking minimum, maximum, and average latency across intervals. That record lets you pinpoint exactly when a problem started, how it developed over time, and whether a recent network change improved or worsened things.

  • Historical response time graphs show when latency started climbing, not just where it sits now
  • Compare latency data before and after network changes to confirm impact
  • Min/max/average latency across intervals. Useful proxy for link stability in VoIP environments, where even brief spikes matter.
  • Gradual link degradation shows up in trend data long before users start complaining

See Why IT Professionals Trust PRTG

Start monitoring your infrastructure in minutes. No professional services, no complex configuration, no risk.

Free download
PRODUCT OVERVIEW

Ping Coverage Across All Your Sites

PRTG remote probes run inside each branch office or remote site, pinging local hosts from within that network. This gives you accurate local availability data and a built-in way to distinguish between a host going down and a WAN link going down: if the probe goes silent, the link is the likely cause. The Cloud Ping v2 sensor adds external coverage from five global locations for internet-facing infrastructure, all visible from one central dashboard.
  • Remote probes ping local hosts from within each branch office, warehouse, or remote site
  • Cloud Ping v2 measures TCP ping times from five global locations for external availability checks
  • All sites in one dashboard. No separate tools, no per-location logins.
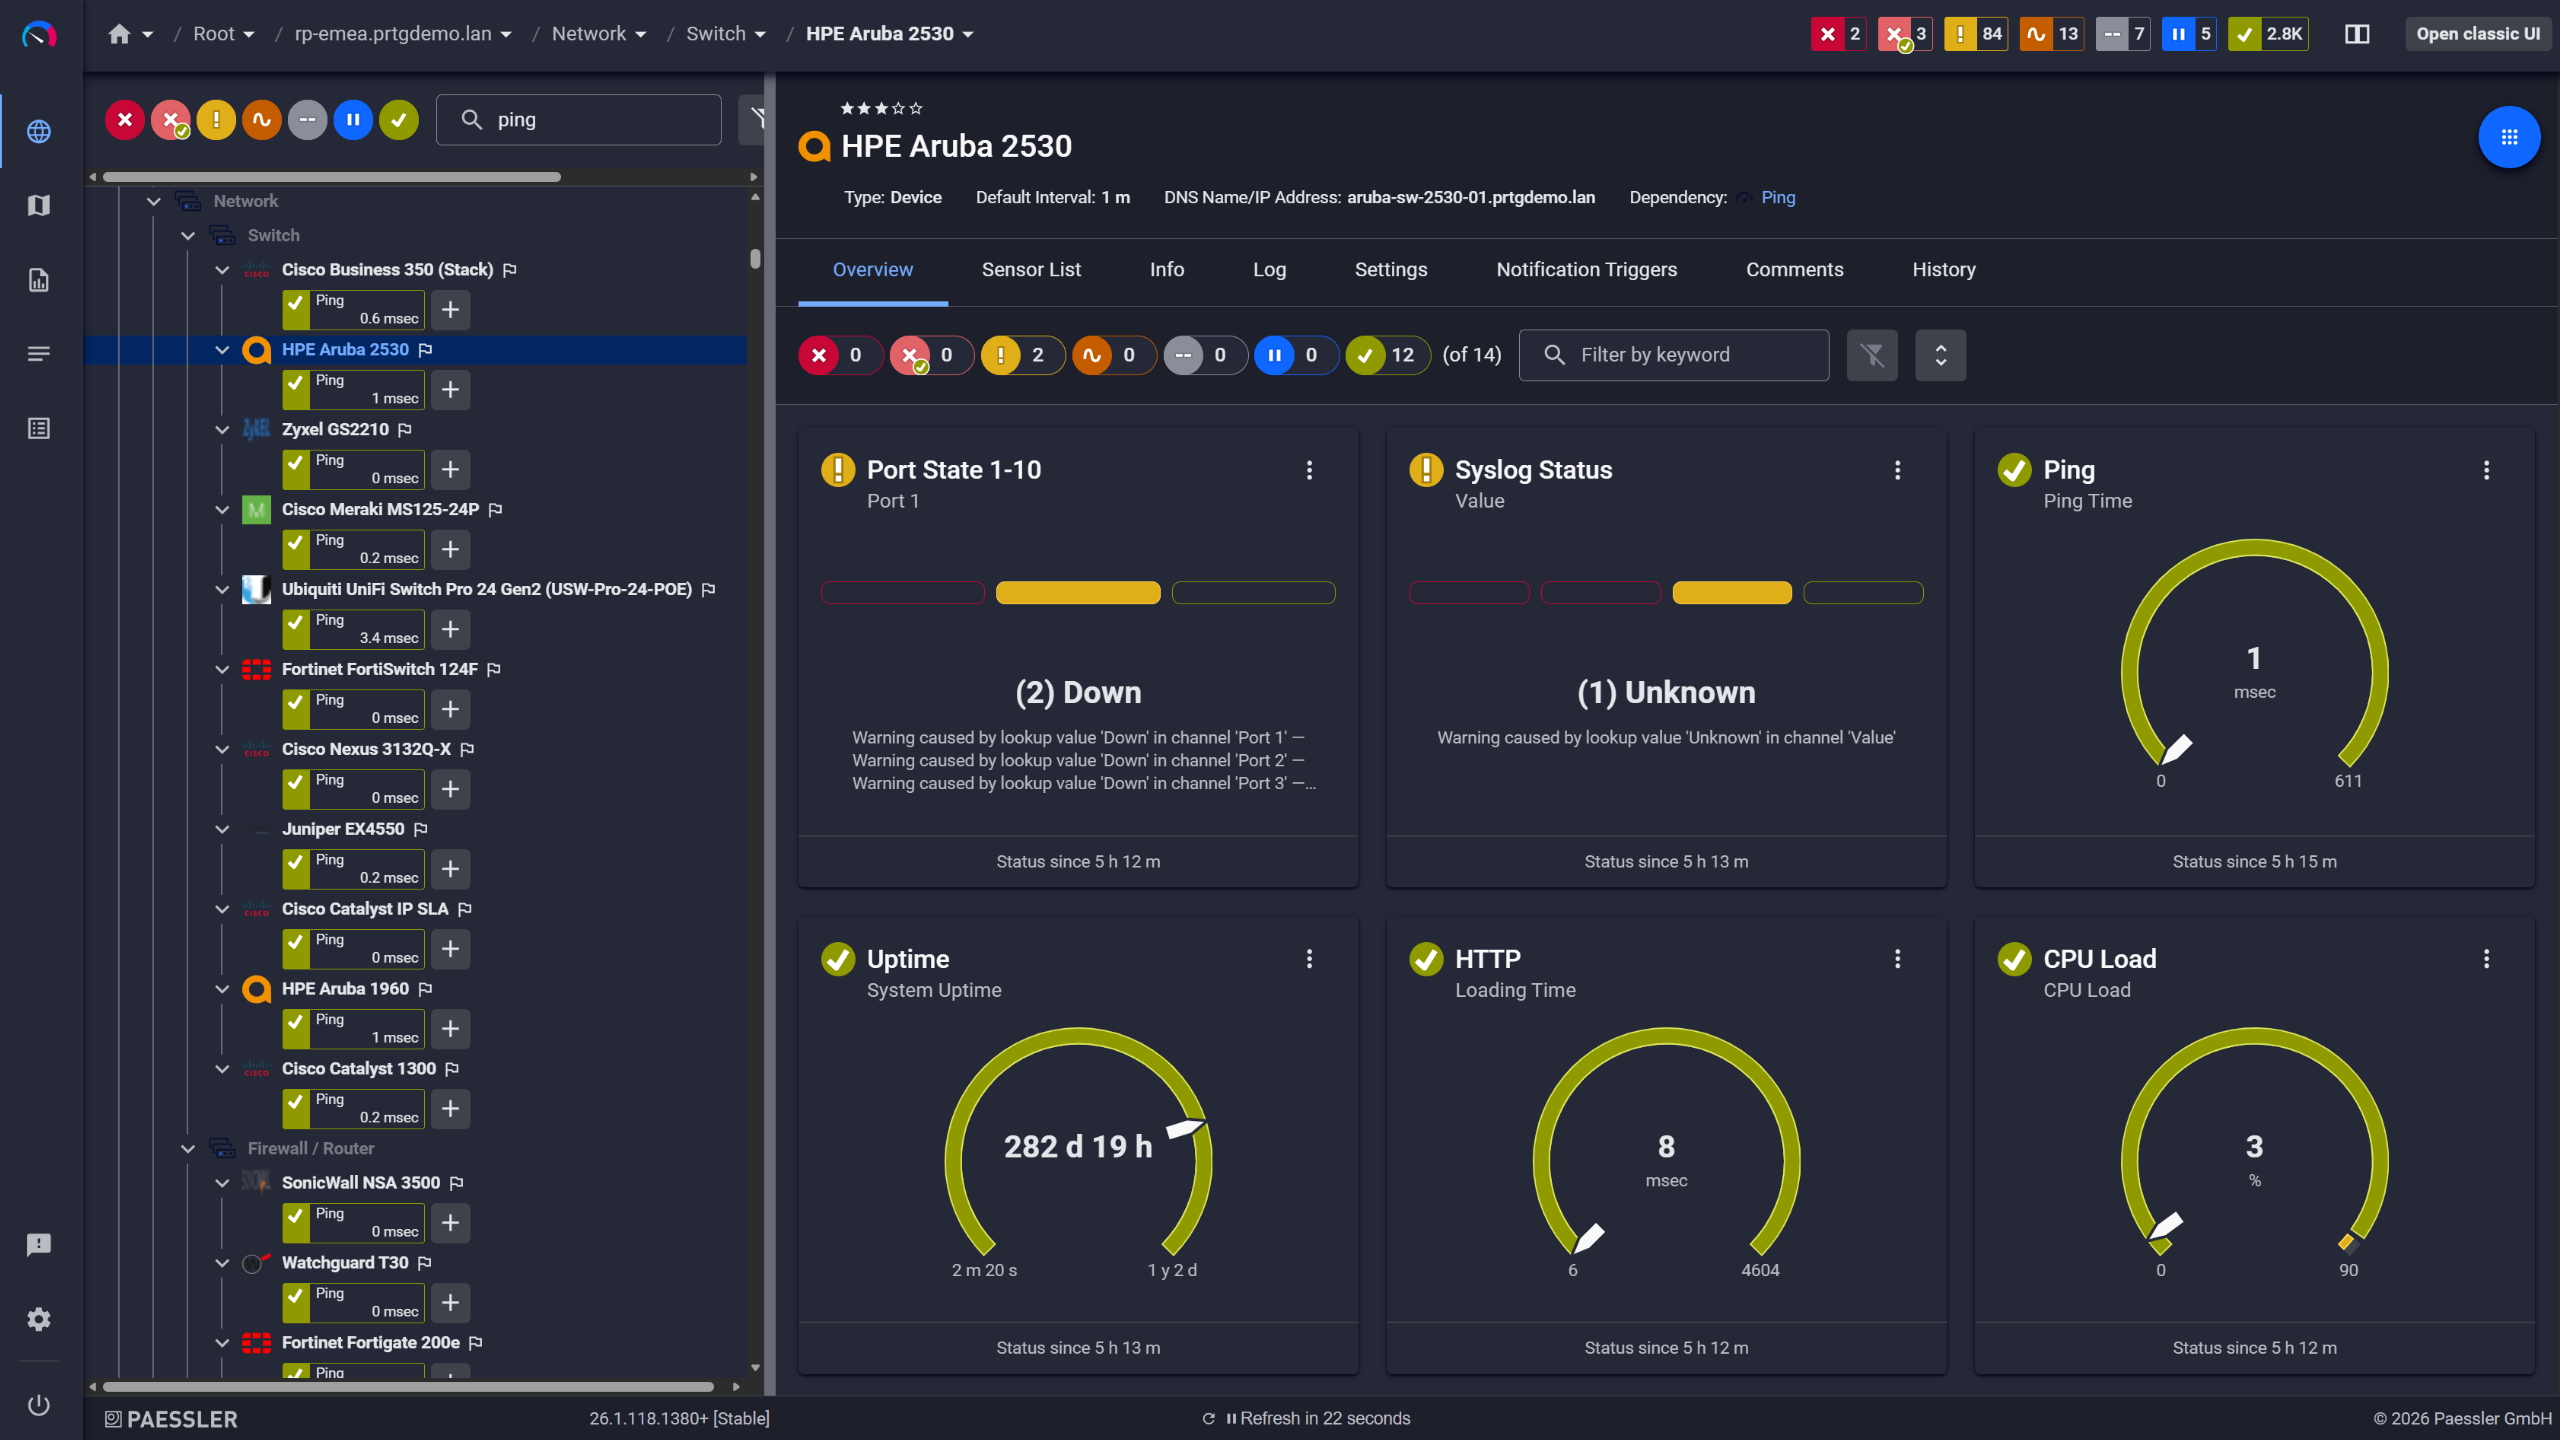
PRTG device overview for an HPE Aruba 2530 switch with port state, ping, and CPU sensors

Network switches monitored across vendors
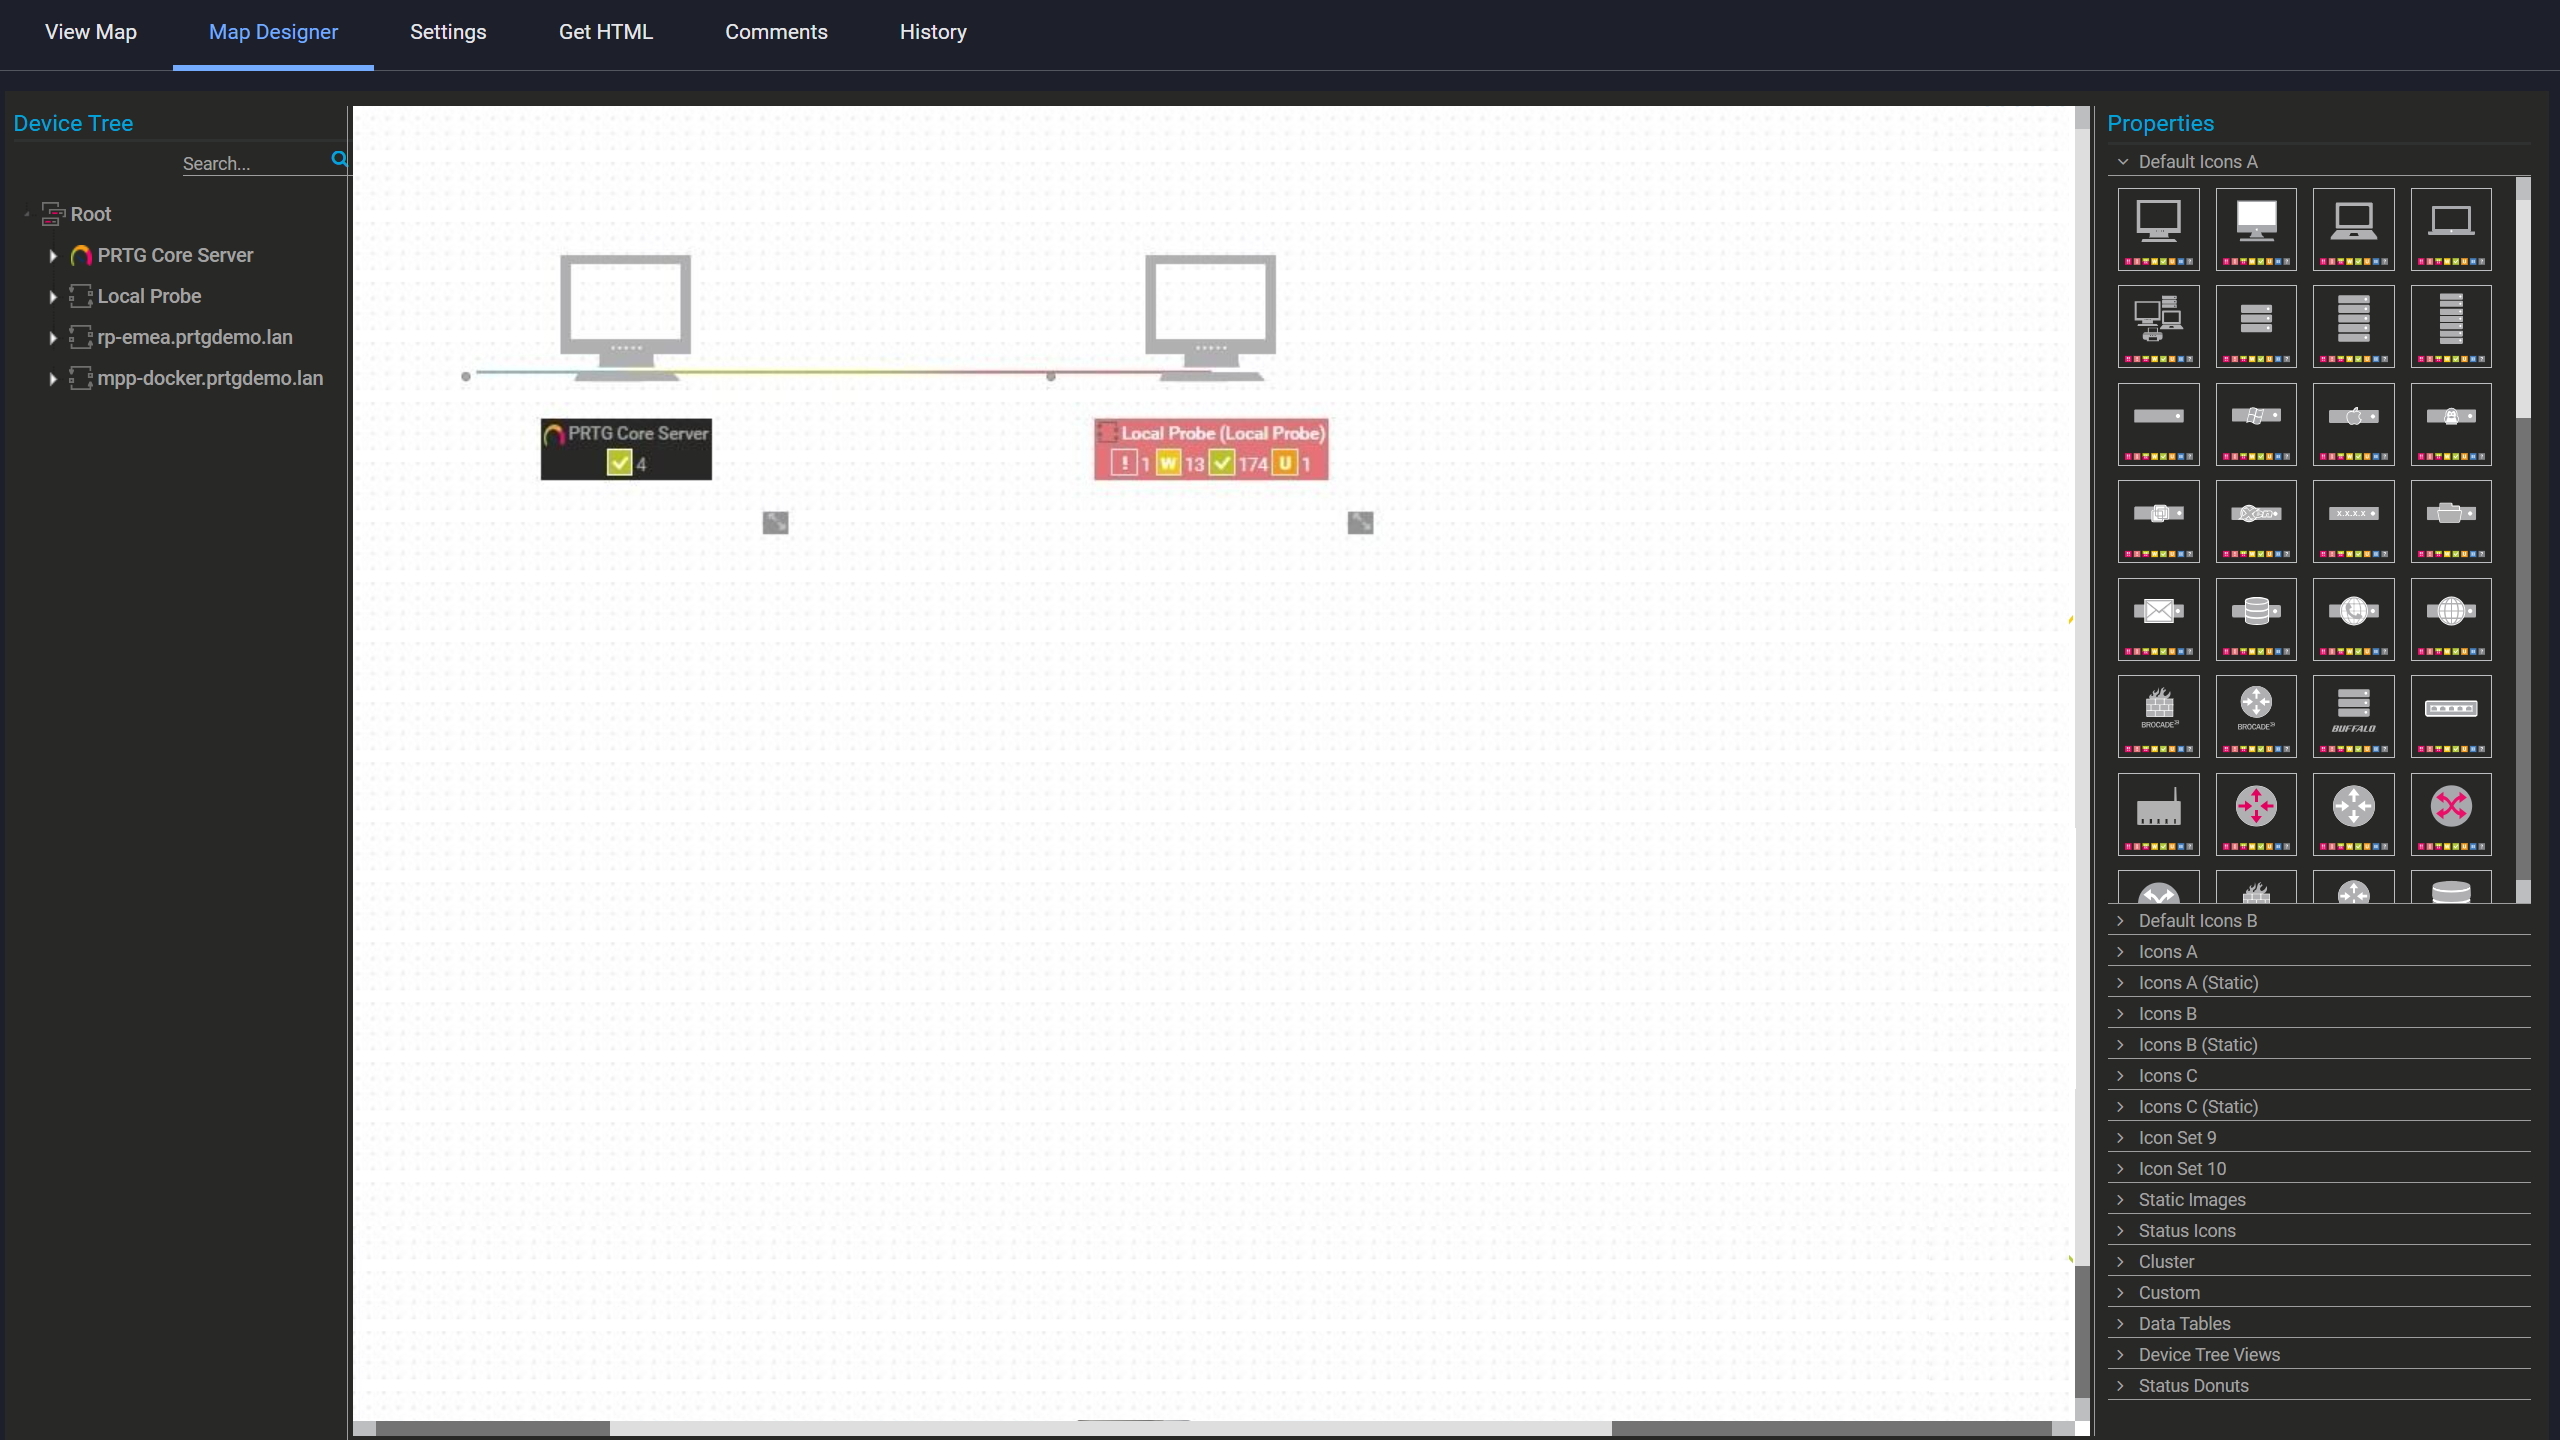
PRTG Map Designer with two network devices placed on a blank canvas

Build your own network map

PRTG reports list showing scheduled monitoring reports with run times and sensor counts

Scheduled reports, always on time

Know What's on Your Network

Getting monitoring started requires knowing what's actually on your network. PRTG's auto-discovery scans a defined IP range using ICMP, SNMP, and WMI, identifies active hosts, and creates sensors automatically. Where available, it captures hostname, DNS name, and MAC address. MAC address capture relies on ARP and works on IPv4 networks only. It's not a live asset inventory, but it gets your monitoring environment populated fast. Large Windows environments can also pull from Active Directory.

  • Scans defined IP ranges using ICMP, SNMP, and WMI. Active hosts get sensors assigned automatically. WMI and SNMP add context ICMP alone can't give you.
  • Captures hostname, MAC address (IPv4/ARP only), and DNS name where available
  • Active Directory import for large Windows environments
  • Hosts start being monitored immediately, no manual sensor setup required

How PRTG Monitors Network Availability with Ping

PRTG uses several sensor types for ping-based monitoring, each suited to a specific use case and network position. This section covers the technical approach: what protocol each sensor uses, where the measurement originates, and what it returns. The Ping v2 Sensor requires only a target address. SSH and WMI variants need the corresponding credentials configured on the parent device.

ICMP Request Mechanics

The Ping v2 Sensor sends 5 ICMP echo requests per scanning interval by default. For each interval, it records individual response times and calculates the minimum, maximum, and average across those pings. Packet loss is reported as a percentage of failed replies. Both the ping count and timeout value are configurable per sensor, so you can tune behavior for high-latency links or stricter requirements. 

SSH Remote Ping

The SSH Remote Ping v2 Sensor connects to a Linux or macOS host via SSH and runs ICMP pings from that system to a defined target. The measurement comes from the remote host's network position, not from the PRTG probe. This matters when you need to verify connectivity between two specific nodes, rather than just checking reachability from where PRTG is running. Returns average, minimum, and maximum response time as seen from the remote host. 

WMI Remote Ping 

The WMI Remote Ping Sensor connects to a Windows host via WMI and triggers an ICMP echo request from that machine to a specified target. Like the SSH Remote Ping v2 Sensor, the ping originates from the remote host, giving you a different network vantage point than the PRTG probe. Reports ping time from the remote Windows host to the target, along with downtime tracking. 

Traceroute Hop Count

The Traceroute Hop Count sensor traces the path from the PRTG probe to a target IP address or hostname and counts the number of hops. It doesn't return full path detail, just the hop count and round-trip time. An increase in hop count between measurements signals a routing change, which is often the explanation for latency spikes that look unexplained in ping data alone. 

Dual-Stack Monitoring

PRTG ping sensors support both IPv4 and IPv6 addressing. Each sensor targets a specific IP address, so monitoring both protocols for the same host means setting up two sensors: one for IPv4, one for IPv6. In environments mid-migration to IPv6, this lets you track which hosts respond on each protocol and spot any that are reachable on one but not the other. That's a useful reality check during migrations.

free downLoad

Ping Scanner Features: PRTG vs. Free and Open-Source Tools

FEATURE

Open-Source Tools

Open-Source Tools

PRTG

PRTG

Continuous monitoring

Open-Source Tools
not included

Runs on demand, then stops.

PRTG
included

Sensors run continuously, 24/7.

Automated alerting

Open-Source Tools
not included

No alerting without custom scripting.

PRTG
included

Alerts via email, SMS, or push.

Historical data & trends

Open-Source Tools
not included

No stored history after the session.

PRTG
included

All results logged and graphable over time.

Remote site coverage

Open-Source Tools
not included

Single-location scans only. 

PRTG
included

Remote probes cover all sites centrally.

Setup and maintenance

Open-Source Tools
not included

Multi-subnet alerting requires scripting effort.

PRTG
included

Auto-discovery handles setup in minutes.

free downLoad

The reactivity, know-how, and technical solutions of Paessler support are outstanding in every situation. For me, no monitoring tool compares to PRTG.

 Andreas Reimann, Senior Networking Communication Architect
Zurich Airport

“We want to include the tool in our set of solutions in order to solve problems more proactively in our technology infrastructure. PRTG has exceeded all our expectations because it is a reliable, extremely easy-to-use solution. There is no doubt that it lives up to the renowned quality of German technology.”

Esbin Saúl Lázaro García, IT Infrastructure and Security Engineer
Hospital El Pilar

“We strive to equip our systems with state-of-the-art technology to safeguard our educational practices for the future. Part of this includes ensuring that all our systems run smoothly at all times. On any given day, we rarely have time to keep an eye on all our systems. We therefore decided to monitor our school’s IT environment with a centralized network monitoring tool.”

Stefan Roschewitz, IT administrator
BBS Holzminden

Paessler PRTG Network Monitor licenses & pricing

Choose the PRTG Network Monitor subscription that's best for you.

License NameLicense descriptionPriceLicense DetailsGet startedPricing Details
PRTG 500$200per month paid annuallyBuy nowBuy now

Enough to monitor multiple aspects of 50 devices

PRTG 1000$358per month paid annuallyBuy nowBuy now

Enough to monitor multiple aspects of 100 devices

PRTG 2500$742per month paid annuallyBuy nowBuy now

Enough to monitor multiple aspects of 250 devices

PRTG 5000$1,300per month paid annuallyBuy nowBuy now

Enough to monitor multiple aspects of 500 devices

PRTG 10000$1,642per month paid annuallyBuy nowBuy now

Enough to monitor multiple aspects of 1000 devices

Over 100,000 Customers Worldwide Love Paessler  

customer success stories

Ping Scanner: Frequently Asked Questions


What is a ping scanner and what does it do?

A ping scanner sends ICMP echo requests to a list or range of IP addresses and records which hosts respond, how fast, and with what packet loss. Network administrators use it to check host availability, identify unreachable hosts, and get a quick picture of what's active on a given subnet. PRTG extends this beyond a one-time check: ping scans run continuously, results are stored, and you get alerted when something changes. 

What's the difference between a ping scan and a ping sweep?

A ping scan checks availability and response time for a specific host or a defined set of hosts. A ping sweep is broader: it covers a range of IP addresses, often an entire subnet, to find which ones have active hosts behind them. In practice, the terms get used interchangeably. PRTG supports both: individual host monitoring via ping sensors, and subnet-level discovery via auto-discovery that scans a defined IP range. 

Can I use PRTG to scan a range of IP addresses automatically?

Yes. PRTG's auto-discovery scans a defined IP range or subnet, identifies active hosts, and creates sensors automatically. It uses ICMP, SNMP, and WMI during discovery to find hosts and determine what can be monitored. Worth noting: this is a setup mechanism, not a live network scanner that updates on its own. Auto-discovery populates your monitoring environment; from that point, sensors take over. 

What happens when a device doesn't respond to ICMP?

If ICMP is blocked by a firewall, which is common for certain host types and network segments, PRTG's ping sensors will report that host as down even if it's reachable via other protocols. There's no automatic fallback to ARP or TCP for ongoing monitoring. During initial auto-discovery, PRTG uses SNMP and WMI as well, so hosts that don't respond to ICMP may still be discovered and monitored through other means. For ongoing availability checks, ICMP needs to be reachable from the probe to the target.

Does PRTG support both IPv4 and IPv6 monitoring?

Yes. PRTG ping sensors work with both IPv4 and IPv6. Each sensor targets a specific address, so monitoring a host on both protocols means two sensors: one for IPv4, one for IPv6. Useful in dual-stack environments mid-migration, where you want to verify reachability on both and catch any hosts that only respond on one.

How does PRTG compare to Angry IP Scanner or Nmap?

Angry IP Scanner and Nmap are solid open-source tools for point-in-time network scanning. They're fast, free, and useful for getting a quick picture of what's active on a network or running a port scan. What they don't do is monitor continuously, store historical scan results, or alert you when something changes. PRTG is built for ongoing network monitoring. Sensors run on a schedule, data is logged, and you get notified when availability or response time crosses a threshold. The two approaches solve different problems: use Nmap or Angry IP Scanner for diagnostics and discovery. Use PRTG when you need to know what's happening right now, not just when you happen to be looking.

Does PRTG include port scanning?

PRTG has a Port sensor that checks whether a specific TCP port is open and reachable on a given host. It's for service availability monitoring: confirming a web server is listening on port 443, or that an RDP port is accessible on a management host. Not a port scanner in the Nmap sense. PRTG won't scan a range of unknown ports to discover what's running. For that, use a dedicated scanner.

Can I export ping monitoring data from PRTG?

Yes. PRTG exports monitoring data in CSV, and reports can be generated and exported as PDF directly from the interface, scheduled or on-demand. If you need historical response time data, availability records, or scan results for external analysis or documentation, it's all there. 

Paessler PRTG

Paessler PRTG

Network Monitoring Software – Version 26.1.116.1532 (February 9th, 2026)

Hosting icon

Hosting

Download for Windows and cloud-based version PRTG Hosted Monitor available

Languages icon

Languages

English, German, Spanish, French, Portuguese, Dutch, Russian, Japanese, and Simplified Chinese

test

Monitor everything

Network devices, bandwidth, servers, applications, virtual environments, remote systems, IoT, and more

test

Pricing

Choose the PRTG Network Monitor subscription that's best for you

Discover more monitoring insights and stories

Content illustration

Powerful stories from the monitoring world

  • Sending Notifications Via Microsoft Teams
  • Monitoring FortiGate Firewalls with Paessler PRTG
  • Easy ways to quickly test your bandwidth
Support illustration

Resources to master your monitoring challenges

  • How to set ping sensor to send notifications if machine restarts
  • PRTG Manual: Ping Sensor - Paessler
  • Ping Jitter Sensor Interval
Solution illustration

Solutions for all your monitoring needs

  • Network Monitoring Tool
  • Database Monitoring
  • CPU Monitoring
PRTG Logo

Start Monitoring with PRTG and see how it can make your network more reliable and your job easier.

Free download
PRODUCT OVERVIEW

Products

  • Paessler PRTG
    Paessler PRTGMonitor your whole IT infrastructure
    • PRTG Network Monitor
    • PRTG Enterprise Monitor
    • PRTG Hosted Monitor
    • PRTG UVexplorer
    • PRTG extensions
      Extensions for Paessler PRTGExtend your monitoring to a new level
  • Icon Features
    FeaturesExplore all monitoring features

Monitoring with PRTG

  • Network monitoring
  • Bandwidth monitoring
  • SNMP monitoring
  • Network mapping
  • Wi-Fi monitoring
  • Server monitoring
  • Network traffic analyzer
  • NetFlow monitoring
  • Syslog server

Useful Links

  • PRTG Manual
  • Knowledge Base
  • Customer Success Stories
  • About Paessler
  • Subscribe to newsletter
  • PRTG Support
  • PRTG Consulting
  • PRTG Feedback & Roadmap

Contact

Paessler GmbH
Thurn-und-Taxis-Str. 14, 
90411 Nuremberg 
Germany

[email protected]

+49 911 93775-0

  • Contact us
©2026 Paessler GmbHTerms & ConditionsPrivacy PolicyImprintReport VulnerabilityDownload & InstallSitemap
Paessler PRTG Paessler PRTG Paessler PRTG