![]()
Monitor and optimize server performance with PRTG
- Keep an eye on all your servers from one central place
- Identify bandwidth issues and other performance bottlenecks
- Compatible with all major server manufacturers
Our users give top ratings for monitoring with Paessler PRTG


PRTG server performance monitoring:
What you’ll find on this page

PRTG makes server performance monitoring easy
Custom alerts and data visualizations make it easy to monitor, identify, and prevent bandwidth, memory, and other server performance issues.
Monitor server performance –
because servers are like clocks
Lots of different pieces need to work reliably, consistently, and in harmony for your servers to perform at their best.
One single bottleneck – not enough RAM, or a disk read-and-write error, for instance – could affect your whole network.
Paessler PRTG is designed to give you a complete view of all the metrics that could affect your servers' performance. Perfect for local and distributed networks, it keeps a constant eye on your hardware and software, so you can easily maintain (and improve) server availability, speed, and stability.
5 reasons why PRTG is the server performance monitoring tool of your choice
Real-time alerts
Don't get caught out. From CPU overload to issues with RAM, hard disks, or read-and-write speeds, PRTG notifies you at once if there is a problem and thus helps you proactively prevent issues (and the dreaded blue screen).
Historical data
Go back as far as you need to pinpoint when servers started underperforming. You can also generate custom reports including detailed information, even graphs, to update your higher-ups and let them know it's time to upgrade.
Effortless setup
Pick a range of IP addresses in your subnet and PRTG will take it from there. Our automatic network discovery will scan your network, detect available servers, and create suitable monitoring sensors for keeping a close eye on server health and performance.
Wide compatibility
No vendor lock-in guaranteed – PRTG works with all manufacturers whose physical servers support SNMP, SSH, or other common technologies. The same goes for major cloud-based server providers like AWS, Microsoft Azure, or Oracle.
Grow as you go
Whether you're running one server with 4GB of RAM, or multiple 60GB RAM servers, it doesn't matter. Start monitoring for free and upgrade your PRTG license as you expand. Run a distributed network? Set up remote probes to monitor remote servers in multiple locations from one place.
What server performance monitoring looks like in PRTG
Diagnose network issues by continuously monitoring RAM, CPUs, physical and logical drives, and other server components. Show bandwidth, memory, and other performance metrics in real time and visualize data in graphic maps & dashboards to identify problems more easily. Gain the visibility you need to troubleshoot and fix bottlenecks and maximize server performance.

Device tree view of your complete monitoring setup
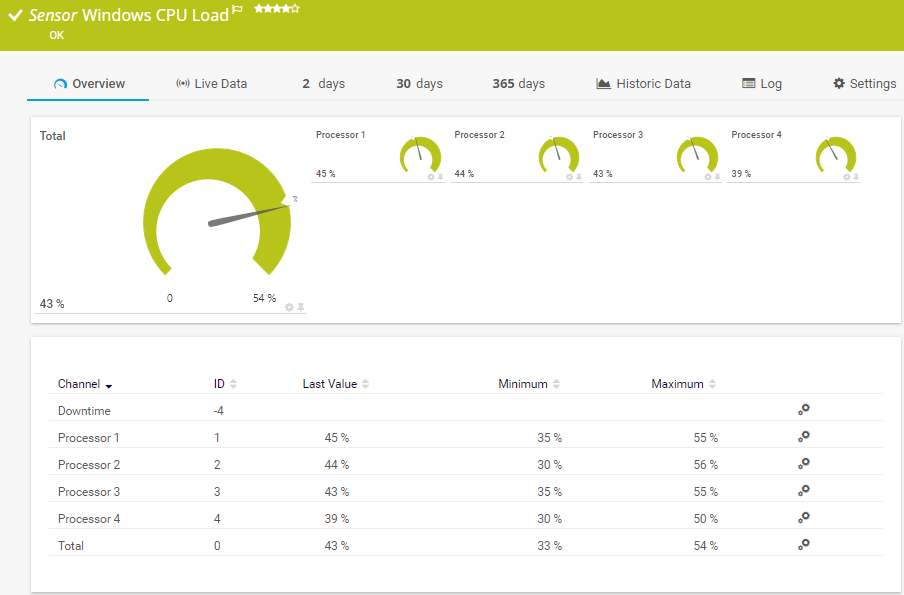
Windows CPU Load sensor in PRTG
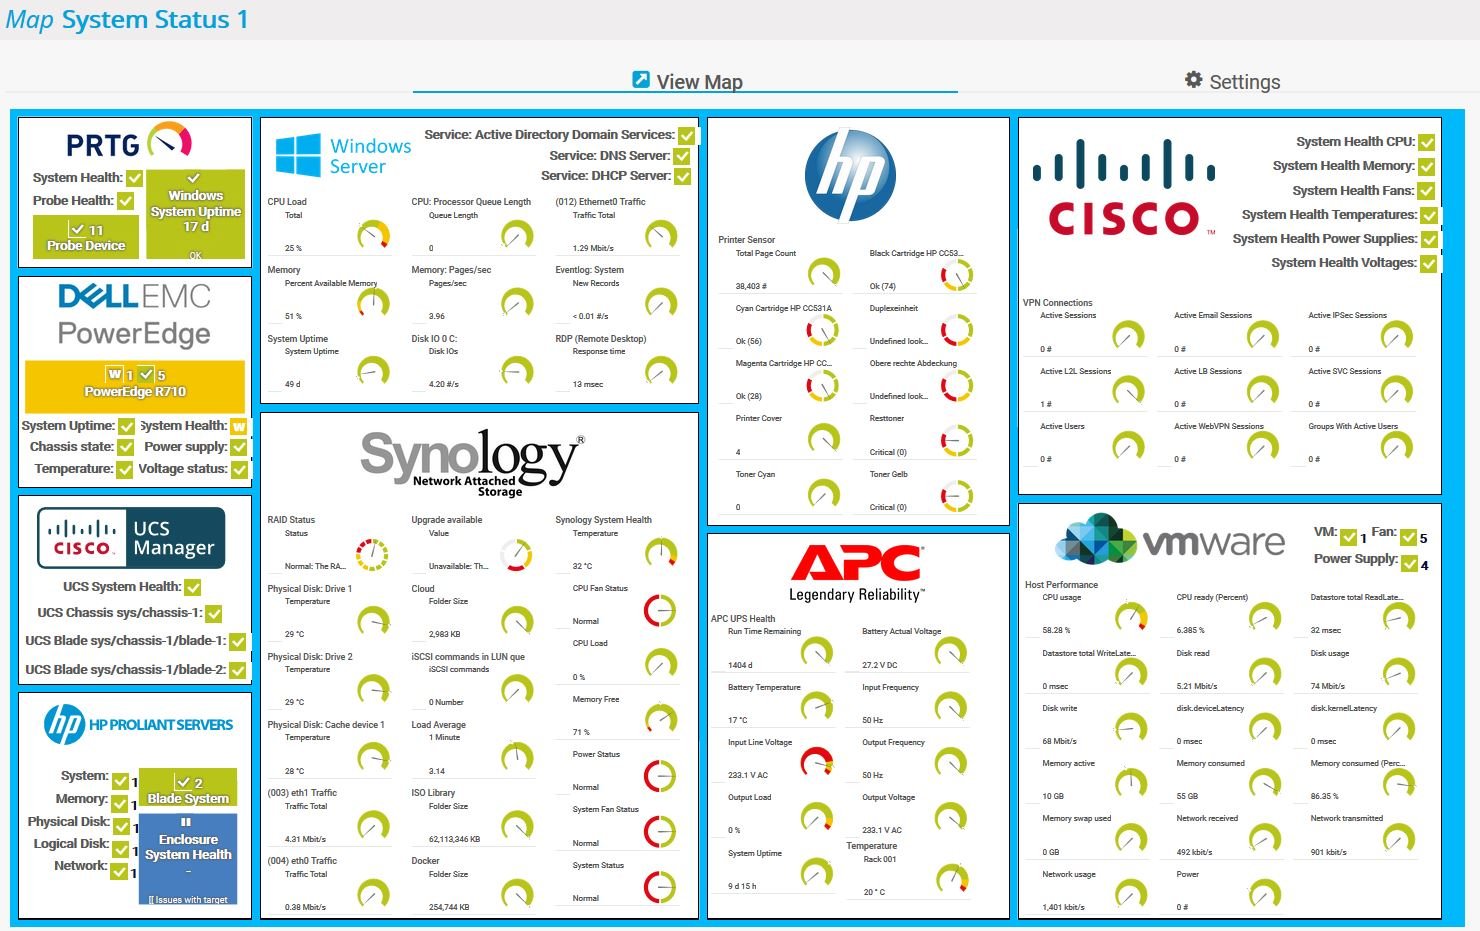
Custom PRTG dashboard for keeping an eye on your servers
Start monitoring server performance with PRTG and see how it can make your network more reliable and your job easier.
Effective, all-in-one server performance optimization
Prevent CPU performance issues
Running too many applications simultaneously? Our SNMP CPU Load and Windows CPU Load sensors warn you when your CPUs are close to capacity, so you can address the issue before they're maxed out and your colleagues are unable to continue working.
Optimize RAM performance
Less memory = lower performance. But you knew that already. Our Windows Pagefile and SNMP Linux Meminfo sensors monitor Windows pagefile and Linux "swap space" activity, so you can free up RAM as soon as you detect server strain and performance bottlenecks.
Track and free up storage space
Our Windows Physical Disk I/O, WMI Free Disk Space (Multi Disk), SNMP Linux Physical Disk and SSH Disk Free sensors help ensure you don't run out of disk space. We also have preconfigured sensors for NetApp, HPE, IBM, Buffalo, Dell, and Lenovo EMC storage systems.
Monitor virtual server performance
The VMware Virtual Machine (SOAP) sensor tracks a VMware virtual machine’s most important performance indicators, including CPU usage, memory, and network connection loads. Use another virtualization provider? We've got that covered too, including Microsoft Hyper-V and Citrix XenServer.
Fix SQL server performance
No more database downtime or sluggish query times. PRTG can monitor most major SQL servers out of the box, including MySQL, Microsoft SQL, Oracle SQL, and PostgreSQL. Or – if you need extended database monitoring for IBM, SAP, and other databases, check out our brand-new product extension PRTG Database Observer.
“All-around winning “The real beauty of PRTG is the endless possibilities it offers” “Outstanding cloud IT experts agree: Paessler PRTG is a great solution for IT infrastructure monitoring

network monitor”

monitoring”
Beat the blue screen blues: A 3-minute primer on the benefits of server monitoring
PRTG is compatible with all major vendors, products, and systems
![]()
Your server performance monitor at a glance – even on the go
Set up PRTG in minutes and use it on almost any mobile device.


Easily find the source of the problem with our PRTG server monitoring solution
Real-time alerts and custom notifications make it easy to solve server bottlenecks and other issues.
Create innovative solutions with Paessler’s partners
Partnering with innovative vendors, Paessler unleashes synergies to create
new and additional benefits for joined customers.


“Excellent tool for detailed monitoring. Alarms and notifications work greatly. Equipment addition is straight forward and server initial setup is very easy. ...feel safe to purchase it if you intend to monitor a large networking landscape.”
Infrastructure and Operations Engineer in the Communications Industry, firm size 10B - 30B USD
PRTG makes server performance monitoring easy
Custom alerts and data visualizations make it easy to monitor, identify, and prevent bandwidth, memory, and other server performance issues.
Monitor server performance: FAQ
1. What is server performance?
Server performance refers to how well a computer server does its job. It's like a waiter in a restaurant – good performance means it quickly and accurately serves your requests. Factors like speed, efficiency, and handling lots of tasks at once contribute to server performance. When a server performs well, websites load fast, and online activities run smoothly. Monitoring and improving server performance help ensure a better experience for users.
2. What is PRTG server performance monitoring?
PRTG is a proprietary software tool that takes the effort out of ensuring your servers always perform at their best. With more than 250 preconfigured sensors, our server performance monitoring tool gives you a complete and comprehensive overview of every component that might impact your servers at a glance, so you can answer this question (and address the problem) double quick.
Available for Windows-based on-premises servers or as a cloud-hosted solution, it's capable of monitoring unlimited devices, bringing critical system data together in one simple, intuitive interface you can access from anywhere: at the office, at home, or on the go.
3. Can I use PRTG to test server performance?
Not exactly. PRTG is a monitoring tool and no server performance test software. This means it's primarily designed to track performance metrics and alert you when they dip below pre-established thresholds, not to run tests.
That said, you can simulate performance tests in the following way:
- Write a script and integrate it into PRTG with a user-defined sensor
- Run the script at short intervals
- Measure the corresponding hardware parameters on your server
4. How do I monitor server performance on a distributed network?
Monitoring distributed servers with PRTG is as easy as it gets. Set up remote probes close to the endpoints of the servers you want to monitor, and PRTG will gather the performance data for you in one place. No more trips to remote server farms (unless you fancy one).
5. What is a sensor in PRTG?
In PRTG, “sensors” are the basic monitoring elements. One sensor usually monitors one measured value in your network, for example the traffic of a switch port, the CPU load of a server, or the free space on a disk drive.
On average, you need about 5-10 sensors per device or one sensor per switch port.

PRTG: The multi-tool for sysadmins
Adapt PRTG individually and dynamically to your needs and rely on a strong API:- HTTP API: Access monitoring data and manipulate monitoring objects via HTTP requests
- Custom sensors: Create your own PRTG sensors for customized monitoring
- Custom notifications: Create your own notifications and send action triggers to external systems
- REST Custom sensor: Monitor almost everything that provides data in XML or JSON format
Paessler PRTG is used by companies of all sizes. Sysadmins love PRTG because it makes their job a whole lot easier. Bandwidth, servers, virtual environments, websites, VoIP services – PRTG keeps an eye on your entire network. Everyone has different monitoring needs. That’s why we let you try PRTG for free.Still not convinced?
![]()
More than 500,000
sysadmins love PRTG![]()
Monitor your entire IT infrastructure
![]()
Try Paessler PRTG
for free
![]()
Start monitoring server performance with PRTG and see how it can make your network more reliable and your job easier.
|
PRTG |
Network Monitoring Software - Version 24.2.94.1400 (April 10th, 2024) |
|
Hosting |
Download for Windows and cloud-based version PRTG Hosted Monitor available |
Languages |
English, German, Spanish, French, Portuguese, Dutch, Russian, Japanese, and Simplified Chinese |
Pricing |
Up to 100 sensors for free (Price List) |
Unified Monitoring |
Network devices, bandwidth, servers, applications, virtual environments, remote systems, IoT, and more |
Supported Vendors & Applications |
|