![]()
Test network bandwidth
with PRTG

Test bandwidth with PRTG
Monitor bandwidth consumption
Automatic alarm
Keep an eye on your
entire network

What is bandwidth?
The term “bandwidth” is used to describe the maximum rate of data that can be transmitted in a network. It is measured in bits, kilobits (Kbit), megabits (Mbit), gigabits (Gbit), or terabits (Tbit) per second. Bandwidth problems can prevent data from “flowing.” Consequently, it is vital that IT managers test and monitor their bandwidth.
Find out more here: What is bandwidth?

PRTG in practice: Test your bandwidth in 5 easy steps
In order to test your maximum bandwidth, you’d have to put a maximum strain on your data line –
and therefore bring your entire network to a halt. For companies, this is not a viable option.
Step 1:
Prepare your bandwidth test
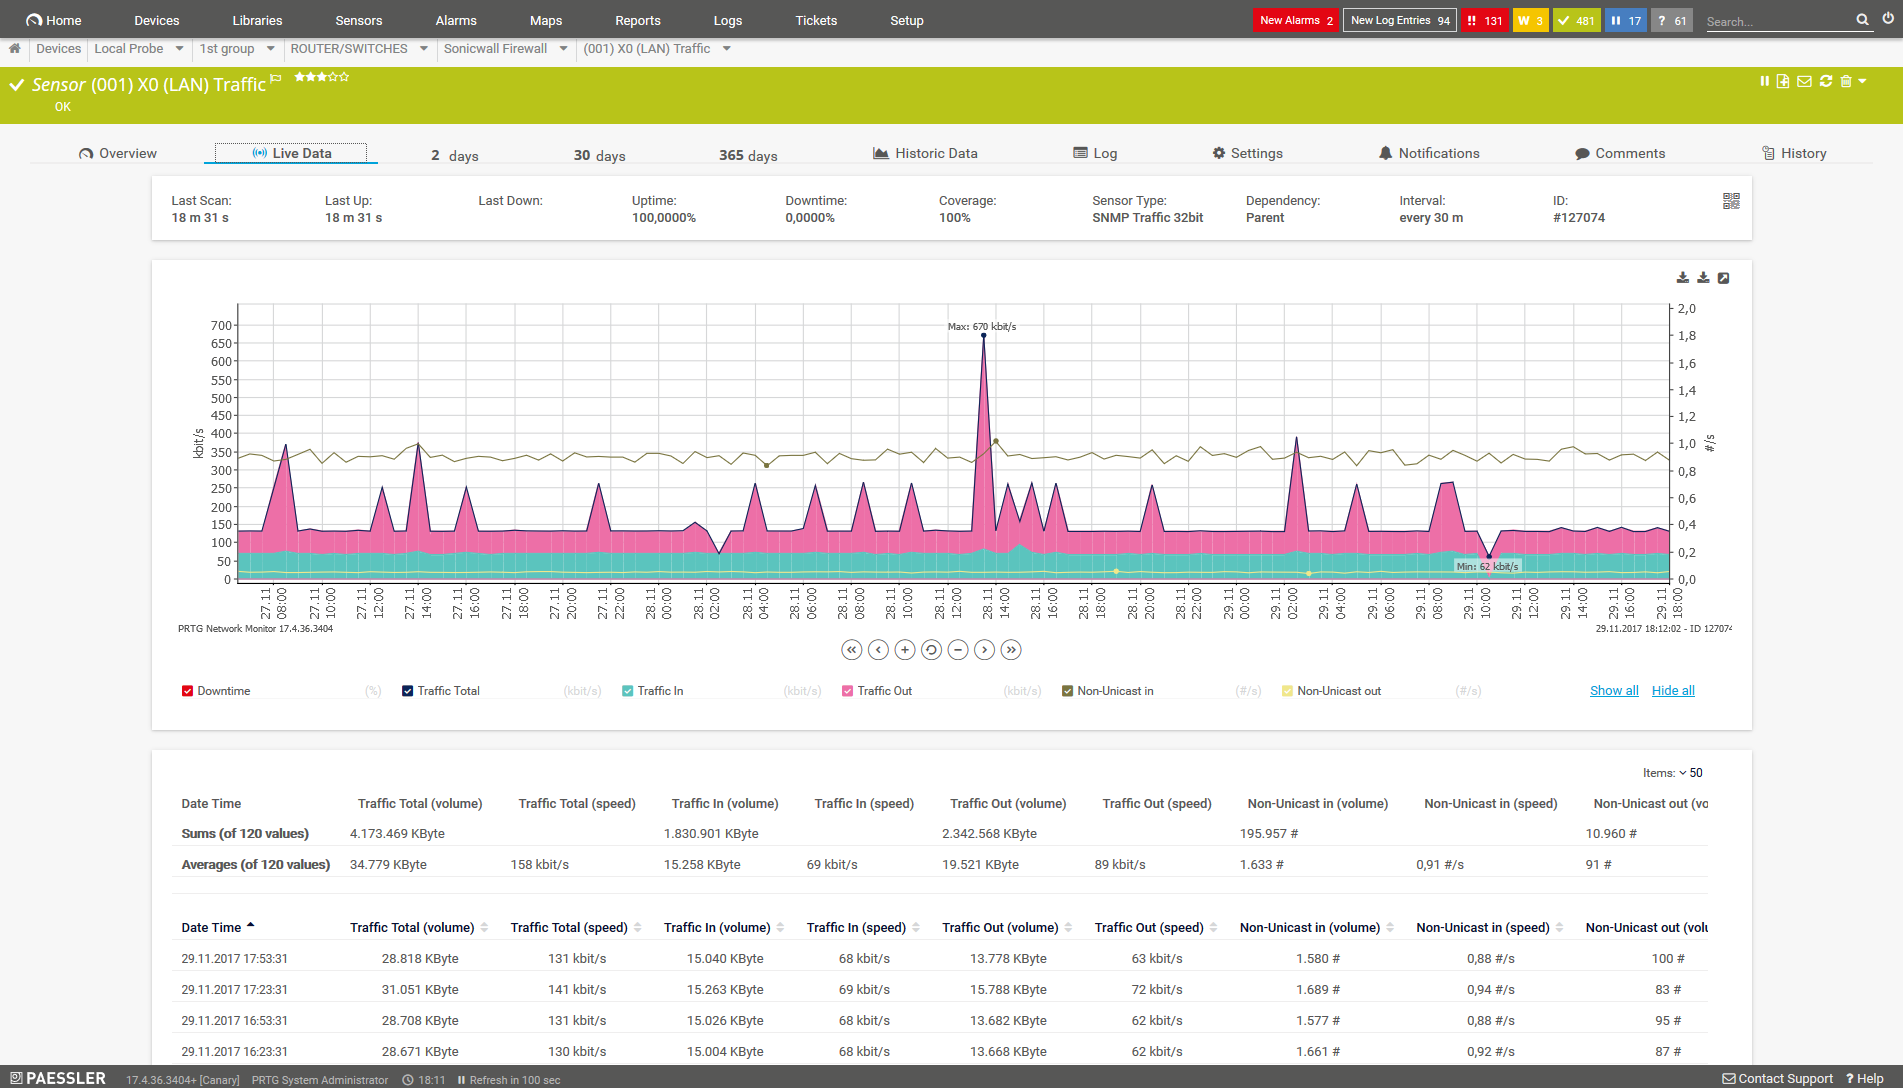
Create three HTTP Advanced sensors to access files on servers operating at different speeds, such as one that houses a static website.
Step 2:
Perform your bandwidth test
Let the sensors run for a few hours at intervals of a few minutes each. The sensors will display the number of kilobits per second that were reached during the download.
Step 3:
Evaluate your data rate (KB/s)
For example, if you have a data line with a specified bandwidth of 4 Mbit/s, it should take 1,000 ms (1 second) to download a 500 KB file. 4 Mbit/s = 0.5 MB/s = 500 KB/s.
Step 4:
End your bandwidth test
If they run for too long, bandwidth tests can generate enormous amounts of data. You should therefore end the test quickly and disable the sensors.
Step 5:
Expand your test to monitoring
This kind of test only checks your bandwidth at a specific moment in time. It does not, however, reveal the sources of the problems which may be affecting your bandwidth. In large networks, these may include a router or a switch. With PRTG, you can monitor your entire network.

Bandwidth at a glance – A case study
PRTG is used by more than 500,000 administrators worldwide – and nearly all of them use it to monitor their traffic and bandwidth. Take Aquafin, for example, where employees check the data transfer rate themselves and therefore rely much less on the IT department. “We wanted a scalable network monitoring tool,” explains the company’s IT manager.
Keep a constant eye on your network – even while on the go
Set up PRTG in minutes and use it on almost any mobile device.


So you tested your bandwidth...now what? The advantages of a professional monitoring tool
![]()
Take prompt action
PRTG comes with a built-in alarm that automatically notifies IT managers in the event of a bandwidth disruption or a malfunction affecting an important component in the network. As a result, you can quickly spring into action – usually before your coworkers even notice that something is wrong. What’s more, the alarm is entirely customizable, allowing you to define exactly how and when you wish to be notified.
![]()
Identify errors faster
File transfers, backups, slow applications...in both the LAN and the WLAN: there are many reasons why your bandwidth and data traffic may be disrupted. With PRTG, you’ll immediately see where the problem lies and can quickly get down to troubleshooting.
![]()
Work with more peace of mind
A quick glance at the customizable dashboard in PRTG is all it takes to make sure everything is running smoothly in the network. The dashboard displays the status of servers, routers, switches, firewalls, and much more. If something goes wrong, you’ll be notified at once. You can therefore work with total peace of mind and concentrate on other important IT issues.
![]()
Keep your system tidy
PRTG is compatible with all the biggest manufacturers, including Cisco, Dell, Juniper, and many more. Centralized monitoring software, it lets you do away with a mishmash of monitoring tools.
![]()
Easy to get started
PRTG comes with 250 preconfigured sensors that are automatically created while installing the software. You can also configure its sensors to meet your own specific needs. 100 sensors are free of charge for as long as you like. If you need more, simply choose an appropriate license.

“The greatest advantage of PRTG? You get to rest easy.“
Steffen Ille, Bauhaus-University of Weimar, Germany
3 types of sensors that every sysadmin needs
SNMP sensors
Our SNMP sensors are perfect for monitoring hardware such as servers, computers, routers, and switches. Preconfigured SNMP sensors are available for manufacturers such as Cisco, Dell, and HP. Learn more about SNMP monitoring and SNMP message types.
IP SLA sensors
Our software monitors the quality of service of your network in real time. Quality of service is vital, especially when it comes to video conferences and VoIP. PRTG comes with special sensors such as the Cisco IP SLA Sensor to monitor the quality of service in your network. More on IP SLA monitoring.
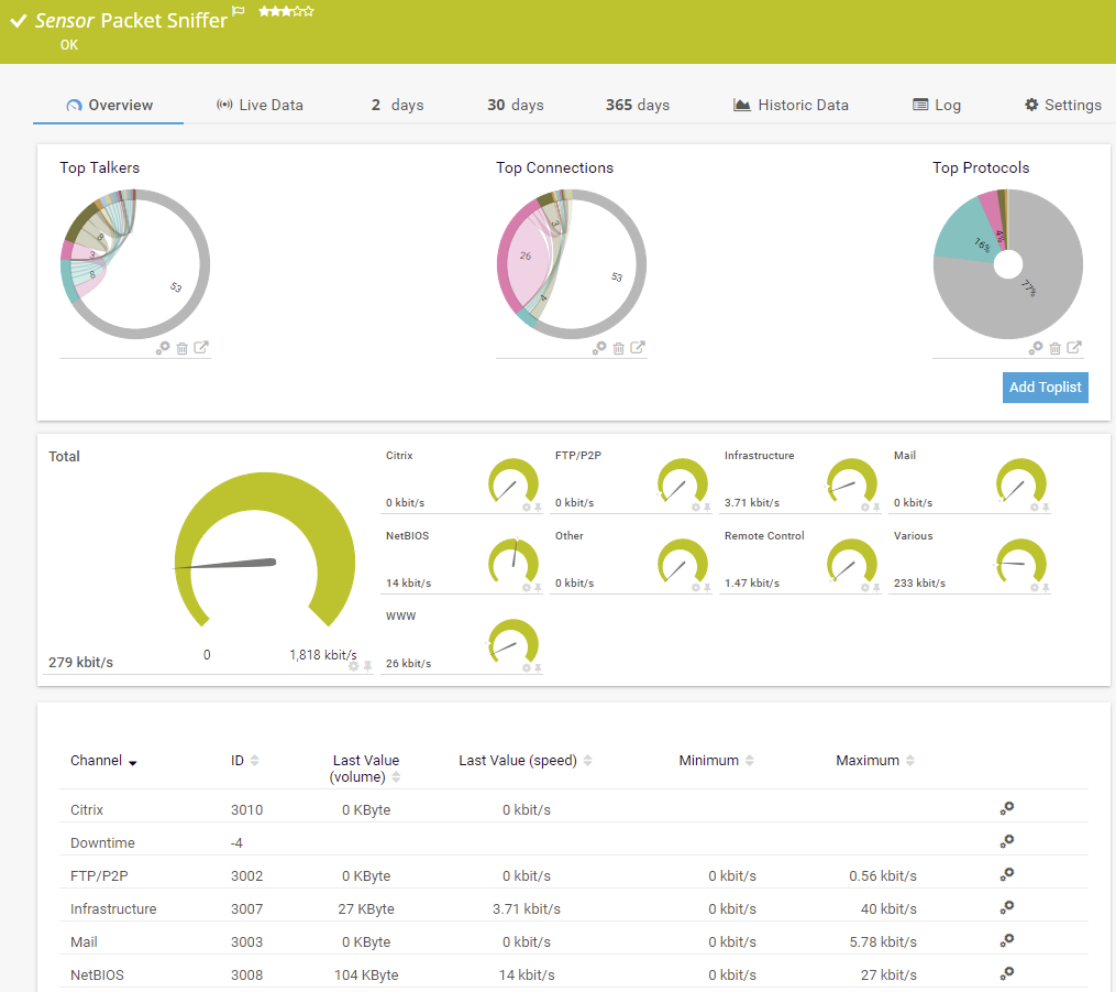
Traffic sensors
Our flow sensors and Packet Sniffer Sensor provide for in-depth monitoring of your traffic. Among other things, you’ll discover which connections and applications are consuming the most bandwidth. More on packet sniffing and flow monitoring
![]() How PRTG defines sensors
How PRTG defines sensors
In PRTG, “sensors” are the basic monitoring elements. One sensor usually monitors one measured value in your network, e.g. the traffic of a switch port, the CPU load of a server, the free space of a disk drive. On average you need about 5-10 sensors per device or one sensor per switch port.
Everyday bandwidth tests

Practical tip: “Hey Mathias, what would you tell administrators who wish to monitor their bandwidth?”
“Instead of trying to measure bandwidth by way of an extra, simulated load, you should have a look around for actions which do that anyway – and then monitor them. For example, when you perform backups, you often put great strain on the bandwidth and can thus easily recognize shortages or bottlenecks.”
Mathias Hengl, PRTG developer at Paessler AG
Trusted by 500,000 users and recognized
by industry analysts as a leader

“Fantastic network and infrastructure monitoring solution that is easy to deploy and easier still to use. Simply the best available.”

“Software is absolutely perfect, Support is superior. Meets all needs and requirements, this is a must have solution if you are needing any form of monitoring.”

“The tool excels at its primary focus of being a unified infrastructure management and network monitoring service.”


“Easy to implement and configure with good technical support.”
R. v. S., ICT Manager at Heinen & Hopman Eng BV

PRTG: The multi-tool for sysadmins
Adapt PRTG individually and dynamically to your needs and rely on a strong API:- HTTP API: Access monitoring data and manipulate monitoring objects via HTTP requests
- Custom sensors: Create your own PRTG sensors for customized monitoring
- Custom notifications: Create your own notifications and send action triggers to external systems
- REST Custom sensor: Monitor almost everything that provides data in XML or JSON format
Still not convinced?
![]()
More than 500,000 sysadmins love PRTG
Paessler PRTG is used by companies of all sizes. Sysadmins love PRTG because it makes their job a whole lot easier.
Monitor your entire IT infrastructure
Bandwidth, servers, virtual environments, websites, VoIP services – PRTG keeps an eye on your entire network.
Try Paessler PRTG for free
Everyone has different monitoring needs. That’s why we let you try PRTG for free. Start now with your trial.
Still not convinced?
![]()
![]()
|
PRTG |
Network Monitoring Software - Version 24.2.94.1400 (April 10th, 2024) |
|
Hosting |
Download for Windows and cloud-based version PRTG Hosted Monitor available |
Languages |
English, German, Spanish, French, Portuguese, Dutch, Russian, Japanese, and Simplified Chinese |
Pricing |
Up to 100 sensors for free (Price List) |
Unified Monitoring |
Network devices, bandwidth, servers, applications, virtual environments, remote systems, IoT, and more |
Supported Vendors & Applications |
|
More on bandwidth
Setting up bandwidth monitoring
How do you set up bandwidth monitoring with PRTG? Look no further than our how-to guide. In 4 quick steps, you’ll set up your monitoring – and start seeing results.
Managing bandwidth
Bandwidth management helps you take an active role in the distribution of bandwidth. It lets you measure, check, limit, and distribute your resources.