![]()
Stay one step ahead with real-time monitoring for Microsoft Exchange Server
- Monitor the availability & performance of your Exchange Server
- Ensure the smooth delivery, storage, and backup of emails
- Receive automatic alerts if there are Exchange Server issues
Our users give top ratings for monitoring with Paessler PRTG


Exchange Server monitoring: What you’ll find on this page

- Avoid these three dangerous Exchange scenarios with PRTG
- Discover 5 benefits of running PRTG as your Exchange monitoring tool
- Try out our top 5 preconfigured sensors for Exchange monitoring
- Exchange Server monitoring in 3 easy steps
- Choose your Exchange monitor: Essential or comprehensive monitoring?
- Monitor Exchange Server: FAQ
PRTG makes Exchange Server monitoring easy
Custom alerts and data visualization make it easy to monitor, identify, and prevent Exchange Server issues.
Avoid these three dangerous Exchange scenarios with PRTG
The consequences of Exchange Server malfunctions are significant. As an administrator, the responsibility for maintaining business continuity and data security rests on your shoulders.
Avoid Exchange delays
When email traffic slows down (even a little), it usually doesn't take more than a few minutes for the complaints to start rolling in.
Paessler PRTG informs you in time, even in case of unusual behavior of your Exchange Server.
![]()
Prevent Exchange malfunctions
PRTG helps you prevent Exchange Server crashes. Through comprehensive monitoring of all relevant components such as databases, services, or management shell, you have everything under control.
Stop data loss
Cases of data loss often correlate with significant risks and financial losses. PRTG not only monitors the operability and performance of your email server, but also whether scheduled backups were done successfully.
Discover 5 benefits of running PRTG as your Exchange monitoring tool

Easily set up & install your monitoring
PRTG comes with a number of preconfigured Microsoft Exchange Server sensors. They are automatically generated after installation during the automatic network discovery process. You can easily add more sensors with just a few clicks for quick and efficient monitoring.
Receive alerts & notifications in real time
With PRTG, you'll be alerted as soon as possible – usually before your email traffic has a chance to build up. All alerting thresholds are customizable, which allows you to respond to incidents in a timely and proactive manner.
Get a complete overview of your network
Get quick access to important mail server data on your dashboard with PRTG Round Trip and Exchange Server sensors. Combined with other network sensors, you'll have a comprehensive network overview that covers every aspect of your IT infrastructure.
Benefit from customizable monitoring
Enhance your monitoring experience with our customizable PowerShell sensors to meet your individual hardware requirements. Take advantage of our Microsoft Windows expertise to further tailor your setup to your needs with the built-in WMI monitoring capabilities of PRTG.
Monitor Exchange Online and Office 365
Whether on-premises or in the cloud, PRTG has got you covered. Office 365 and Exchange Online are often used together with other cloud services and can be disrupted by faulty connections. Quickly determine if email traffic problems lie within your network, user, or cloud provider.
What Exchange Server monitoring looks like in PRTG
Diagnose network problems by continuously monitoring your Exchange Server. Show Exchange mailbox, mail queue, backup, or database information in real time and visualize data in graphic maps & dashboards to identify problems more easily. Gain the visibility you need to troubleshoot Microsoft Exchange issues.
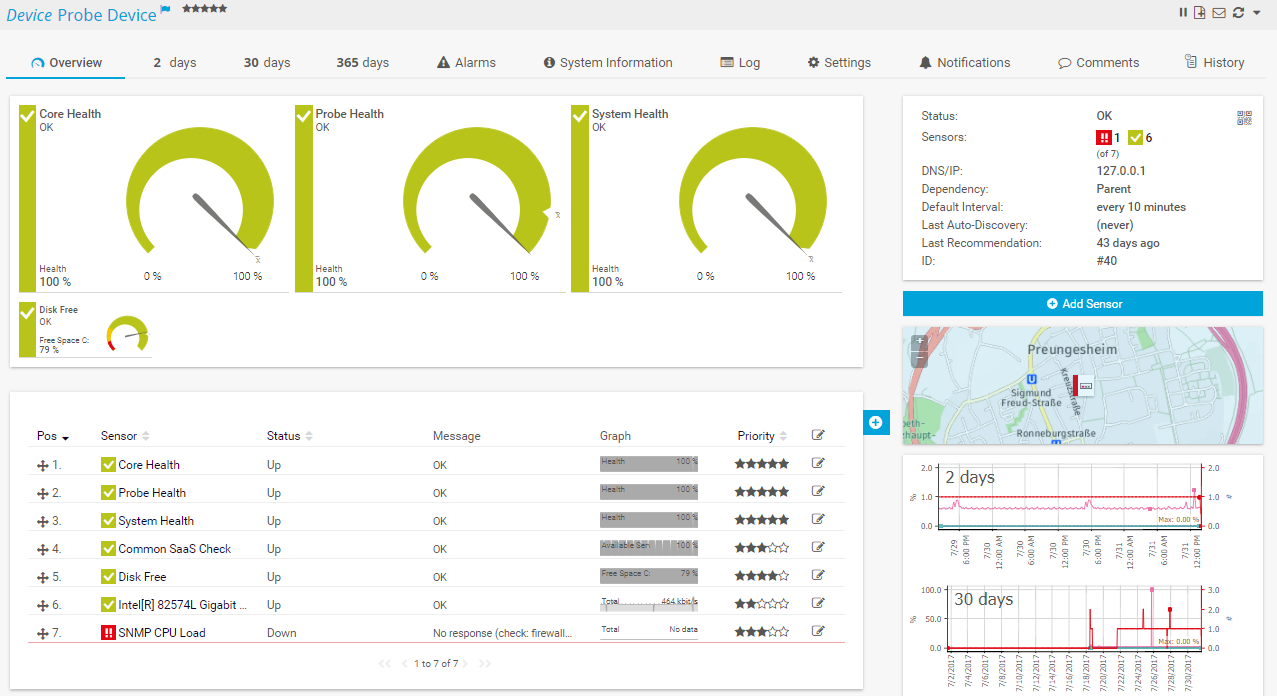
Device overview in PRTG
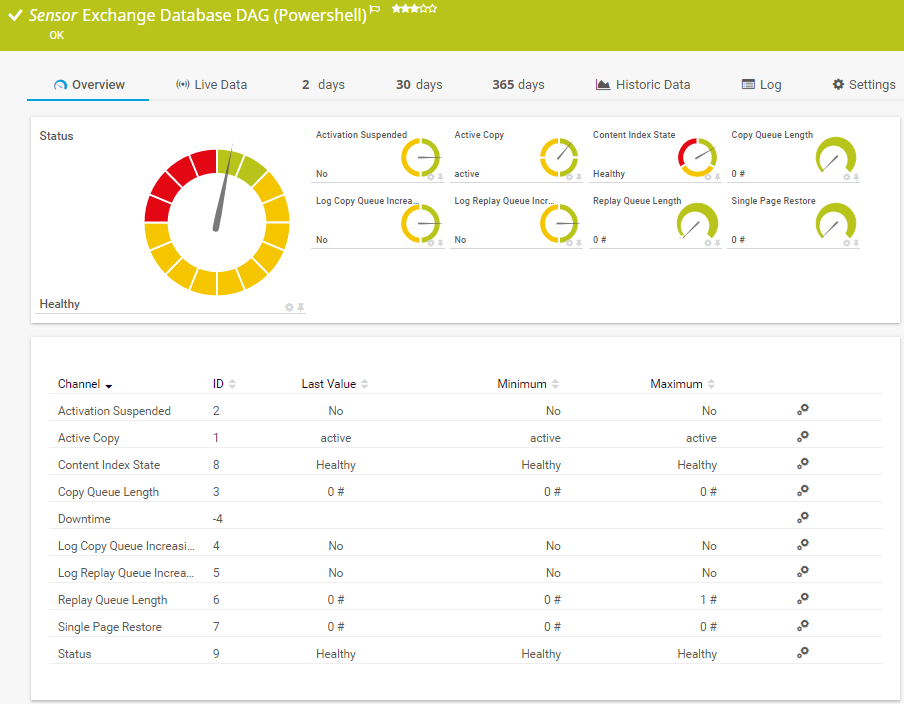
Exchange Database DAG (PowerShell) sensor

Custom PRTG dashboard for a comprehensive IT infrastructure overview
Start Exchange monitoring with PRTG and see how it can make your network more reliable and your job easier.
“All-around winning “The real beauty of PRTG is the endless possibilities it offers” “PRTG Network MonitorIT experts agree: Paessler PRTG is a great solution for IT infrastructure monitoring

network monitor”

is very hard to beat”
Even if your Exchange Server is unavailable – you will still receive notifications from PRTG
Exchange services are down - what do I do?
How can I receive an alert email if my Exchange Server is down? This is a question many administrators have when they use PRTG for the first time.
The answer: Set up a fallback notification solution
PRTG offers a variety of customizable notification methods. In addition to email notifications, alternatives such as SMS, Teams messages or push notifications are available.
For your most important network components, we recommend that you use at least two different notification methods. This way, you can be sure that you’ll always be notified if there are downtimes to be able to react accordingly.
Try out our top 5 preconfigured sensors for Exchange monitoring
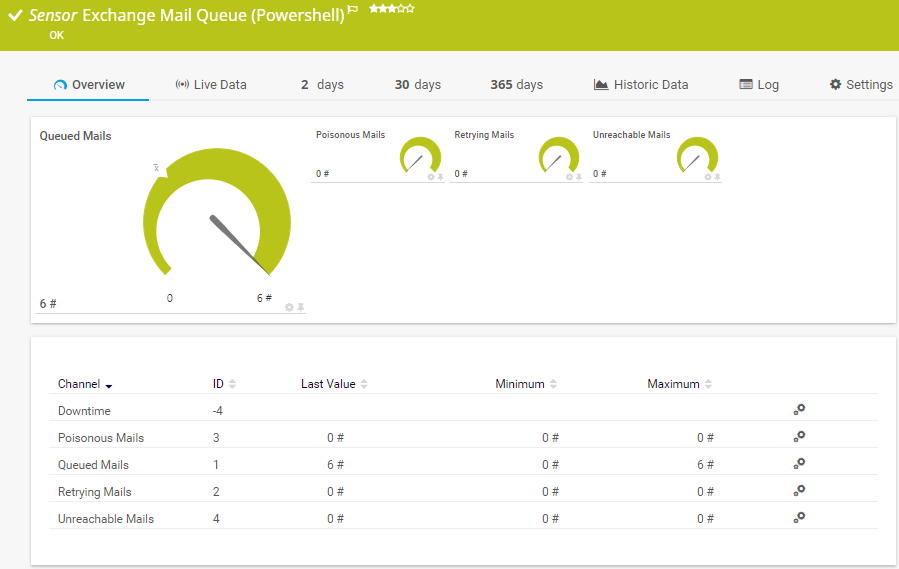
Exchange Mail Queue (PowerShell) sensor in PRTG
Exchange Mailbox (PowerShell) sensor
The Exchange Mailbox (PowerShell) sensor monitors mailboxes of an Exchange Server. It shows the following:
- The number of items
- The time since the last mailbox login
- The total size of items
Exchange Database (PowerShell) sensor
The Exchange Database (PowerShell) sensor monitors database information of an Exchange Server. It shows the following:
- The size of the database
- If the database is recognized as valid
- If the database is mounted
Exchange Backup (PowerShell) sensor
The Exchange Backup (PowerShell) sensor monitors backups of an Exchange Server. It shows the following:
- If a backup is running
- The time since the last copy backup
- The time since the last differential backup
- The time since the last full backup
- The time since the last incremental backup
Exchange Mail Queue (PowerShell) sensor
The Exchange Mail Queue (PowerShell) sensor monitors the number of items in the outgoing mail queue of an Exchange Server. It can show the following:
- The number of poisonous mails
- The number of queued ails
- The number of retrying mails
- The number of unreachable mails
Exchange Public Folder (PowerShell) sensor
The Exchange Public Folder (PowerShell) sensor monitors the public folders and subfolders of an Exchange Server. It can show the following:
- The number of items
- The time since the last access
- The total size of items
Easily find the source of the problem with our PRTG Exchange Server monitoring solution
Real-time alerts and custom notifications make it easy to solve issues with Microsoft Exchange Server.
PRTG is compatible with all major vendors, products, and systems
![]()
Exchange Server monitoring in 3 easy steps
![]() How PRTG defines sensors
How PRTG defines sensors
In PRTG, “sensors” are the basic monitoring elements. One sensor usually monitors one measured value in your network, e.g. the traffic of a switch port, the CPU load of a server, the free space of a disk drive. On average you need about 5-10 sensors per device or one sensor per switch port.
![]()
Configure Round Trip sensors in PRTG
Easily monitor your Exchange Server with our built-in Round Trip sensors. These sensors provide a comprehensive overview of the end-to-end email delivery process.
By constantly evaluating the journey from your mail server to the POP3/IMAP server, the SMTP&IMAP Round Trip and SMTP&POP3 Round Trip sensors identify and prevent potential delays that could impact your business.
![]()
Set up specific Exchange Server monitoring
Monitoring your Exchange Server with PRTG is easy. Specify the server by IP address or DNS, then add the preconfigured Exchange sensors you need for detailed server monitoring.
Detect email problems immediately, even before major problems occur. Comprehensive Exchange monitoring covers the number and size of emails, the database, backups, mail queues, public folders, and more.
![]()
Create your custom PRTG dashboard
Use the integrated PRTG map editor to build a dashboard that’s exactly tailored to your needs. Include Exchange Server monitoring data using different visualization widgets to provide a clear and insightful overview.
Share the dashboards internally on screens in your office to be able to quickly identify problems and troubleshoot them
Start Exchange monitoring with PRTG and see how it can make your network more reliable and your job easier.
Your Exchange Server monitoring at a glance – even on the go
Set up PRTG in minutes and use it on almost any mobile device.


Create innovative solutions with Paessler’s partners
Partnering with innovative vendors, Paessler unleashes synergies to create
new and additional benefits for joined customers.


ScriptRunner
With ScriptRunner, Paessler integrates a powerful event automation platform into PRTG Network Monitor.
UVexplorer integrates tightly with PRTG to bring fast and accurate network discovery, detailed device inventory, and automatic network mapping to the PRTG platform.
UVnetworks
PRTG makes Exchange Server monitoring easy
Custom alerts and data visualization make it easy to monitor, identify, and prevent Exchange Server issues.
![]()
“I particularly like having breakfast at home and just surveying my domain, and understanding what's working and what isn't.”
Steve Coppin, Oxford University
Choose your Exchange monitor: Essential or comprehensive monitoring?
Exchange Servers are one of the backbones of any network – any disruption in their functionality results in a flood of complaints to technical support. This is why you might find yourself go to great lengths to ensure that your Exchange Server runs smoothly and efficiently. But what is the best way to monitor Exchange Server performance?
Free tools and script
There are a number of free PowerShell scripts on the internet that retrieve data and email it to the administrator who requested it. This request on demand can help with specific Exchange monitoring issues. It does not, however, provide you with continuous and comprehensive monitoring of your Exchange Server environment.
Proprietary software PRTG
If you are looking for a top-notch monitoring solution that offers you real-time monitoring of not only your Exchange Server, but also your entire IT infrastructure, PRTG is the solution to go to. A license of PRTG includes the full range of monitoring features, including comprehensive alerting, reporting, and various visualization options.
Monitor Exchange Server: FAQ
1. How can I receive notifications if my Exchange Server is down?
Set up SMS, Microsoft Teams, or push notifications for instant alerts as a fallback notification solution. Use at least two notification methods to ensure timely alerts.
2. Which versions of Microsoft Exchange Server can I monitor with PRTG?
With PRTG, you can monitor all versions of Exchange Server: Exchange Server 2013, Exchange Server 2016 as well as Exchange Server 2019. Exchange 2003 and Exchange 2007 are very rarely used. For these versions, WMI sensors are available.
3. How does PRTG help prevent Exchange Server issues?
PRTG offers real-time monitoring with instant alerts for delays and malfunctions, while providing a comprehensive overview of databases, services, mail queues, backups, and more to prevent data loss on your email server.
4. What are the benefits of using PRTG for Exchange Server monitoring?
PRTG offers a quick setup with preconfigured Exchange Server sensors and customizable alerts for immediate troubleshooting. It provides a comprehensive network overview with native Round Trip and Exchange Server sensors and custom monitoring with PowerShell and WMI sensors.
5. What is a sensor in PRTG?
In PRTG, “sensors” are the basic monitoring elements. One sensor usually monitors one measured value in your network, for example the traffic of a switch port, the CPU load of a server, or the free space on a disk drive.
On average, you need about 5-10 sensors per device or one sensor per switch port.

PRTG: The multi-tool for sysadmins
Adapt PRTG individually and dynamically to your needs and rely on a strong API:- HTTP API: Access monitoring data and manipulate monitoring objects via HTTP requests
- Custom sensors: Create your own PRTG sensors for customized monitoring
- Custom notifications: Create your own notifications and send action triggers to external systems
- REST Custom sensor: Monitor almost everything that provides data in XML or JSON format
We asked: would you recommend PRTG?
Over 95% of our customers say yes!
Paessler conducted trials in over 600 IT departments worldwide to tune its network monitoring software closer to the needs of sysadmins.
The result of the survey: over 95% of the participants would recommend PRTG – or already have.

Paessler PRTG is used by companies of all sizes. Sysadmins love PRTG because it makes their job a whole lot easier. Bandwidth, servers, virtual environments, websites, VoIP services – PRTG keeps an eye on your entire network. Everyone has different monitoring needs. That’s why we let you try PRTG for free.Still not convinced?
![]()
More than 500,000
sysadmins love PRTG![]()
Monitor your entire IT infrastructure
![]()
Try Paessler PRTG
for free
![]()
Start Exchange monitoring with PRTG and see how it can make your network more reliable and your job easier.
|
PRTG |
Network Monitoring Software - Version 24.2.96.1375 (June 26th, 2024) |
|
Hosting |
Download for Windows and cloud-based version PRTG Hosted Monitor available |
Languages |
English, German, Spanish, French, Portuguese, Dutch, Russian, Japanese, and Simplified Chinese |
Pricing |
Up to 100 sensors for free (Price List) |
Unified Monitoring |
Network devices, bandwidth, servers, applications, virtual environments, remote systems, IoT, and more |
Supported Vendors & Applications |
|