
Last reviewed: 10/2026


Checkmk Community costs nothing to license, which keeps costs at zero for a small, single-site setup. What's easy to miss is what happens as you grow: once you pass roughly 100 hosts or need to monitor more than one site, Checkmk requires a paid edition, plus the rules you write and maintain to get there. A PRTG subscription includes every sensor type at every license size from day one, so the capabilities you need later are already there instead of an upgrade decision. For a handful of devices on one site, Checkmk Community can still be the cheaper choice, and we'd rather say so than pretend otherwise.
PRTG supports custom sensors, REST and HTTP APIs, MIB imports, and scripting for the cases that genuinely need them. In practice, 250+ preconfigured sensor types cover most environments without any of that, so a technical team spends its time on the infrastructure problem in front of it instead of maintaining monitoring rules. Custom sensors and the API give you a way in when a device or metric isn't covered out of the box. For the deepest per-host metrics, Checkmk's native agent reads data directly from each device, while PRTG's agentless approach reads what SNMP, WMI, and SSH expose without installing anything.
PRTG's auto-discovery scans your network and starts building a working monitoring setup within hours, and you can run it alongside Checkmk during the transition rather than cutting over in one step. Weigh that one-time effort against what you're already paying every week in rule maintenance, agent troubleshooting, and configuration upkeep on the current setup. Measured that way, a one-time migration is usually the smaller number. PRTG doesn’t import your Checkmk rules or configuration, and it doesn’t need to: auto-discovery builds your monitoring from what it finds on the network, so you start from your environment as it is today instead of porting old rules across.
FEATURE | PRTG PRTG | Checkmk Checkmk |
|---|---|---|
Cover network, server, and application monitoring with one license | PRTG Included in every license: 250+ sensor types for network, server, and application monitoring | Checkmk Limited: application observability ships only with Checkmk Ultimate or Cloud, not Community or Pro |
Add monitoring locations without hitting a paid tier | PRTG Unlimited remote probes in every PRTG license, including the free edition | Checkmk Limited: distributed monitoring across sites requires Checkmk Pro or Ultimate |
Monitor OT devices over Modbus and OPC UA without an add-on | PRTG Native Modbus TCP/RTU Custom and OPC UA client sensors in every PRTG license | Checkmk Limited: Modbus and OPC UA support only via unofficial, community-built Checkmk Exchange packages, offered without a vendor warranty |
See network topology and configuration history without a separate product | PRTG Limited: requires PRTG UVexplorer, a separate product whose topology and configuration data then appears inside PRTG | Checkmk Native automatic topology maps, hardware/software inventory with change history, and configuration version tracking, even in the free Community edition |
Get trend forecasting and capacity-planning analytics built in | PRTG Limited: historical trend graphs and threshold-based alerting, not predictive forecasting | Checkmk Pro and Ultimate editions include trend predictions and forecasting for capacity planning; not available in Community |
Bringing a new site or branch online | PRTG Auto-discovery scans the new location and builds a matching sensor set from built-in device templates | Checkmk New sites are added by extending existing rulesets and folder structure |
Getting alerted before users notice an outage | PRTG Threshold-based alerts with built-in, multi-channel notifications and escalation chains, no scripting required | Checkmk Alerting through configurable notification rules and plugins |
PRTG Network Monitor is priced by sensor: the individual device, metric, or service you want to monitor. Every PRTG Network Monitor license, from the smallest to the largest, includes the same full feature set, so there's no separate edition to unlock application monitoring, distributed monitoring, or reporting. Find the license size that matches your environment below.
| License Name | License description | Price | License Details | Get started | Pricing Details | |
|---|---|---|---|---|---|---|
| PRTG 500 | $200 | per month paid annually | Buy nowBuy now | Enough to monitor multiple aspects of 50 devices | ||
| PRTG 1000 | $358 | per month paid annually | Buy nowBuy now | Enough to monitor multiple aspects of 100 devices | ||
| PRTG 2500 | $742 | per month paid annually | Buy nowBuy now | Enough to monitor multiple aspects of 250 devices | ||
| PRTG 5000 | $1,300 | per month paid annually | Buy nowBuy now | Enough to monitor multiple aspects of 500 devices | ||
| PRTG 10000 | $1,642 | per month paid annually | Buy nowBuy now | Enough to monitor multiple aspects of 1000 devices |
“I would recommend PRTG because it has helped us significantly improve service uptime by highlighting important alerts that would otherwise result in a system failure or service disruption if action was not taken. Thanks to PRTG, we can ensure that The Ritz London’s network and IT systems are five-star, just like the hotel.”
Once auto-discovery finishes its first pass, this is what you're looking at: a device tree populated automatically, sensors already assigned, and alerts ready to configure. Everything below runs in the same interface, with no separate application for network, server, or application monitoring.
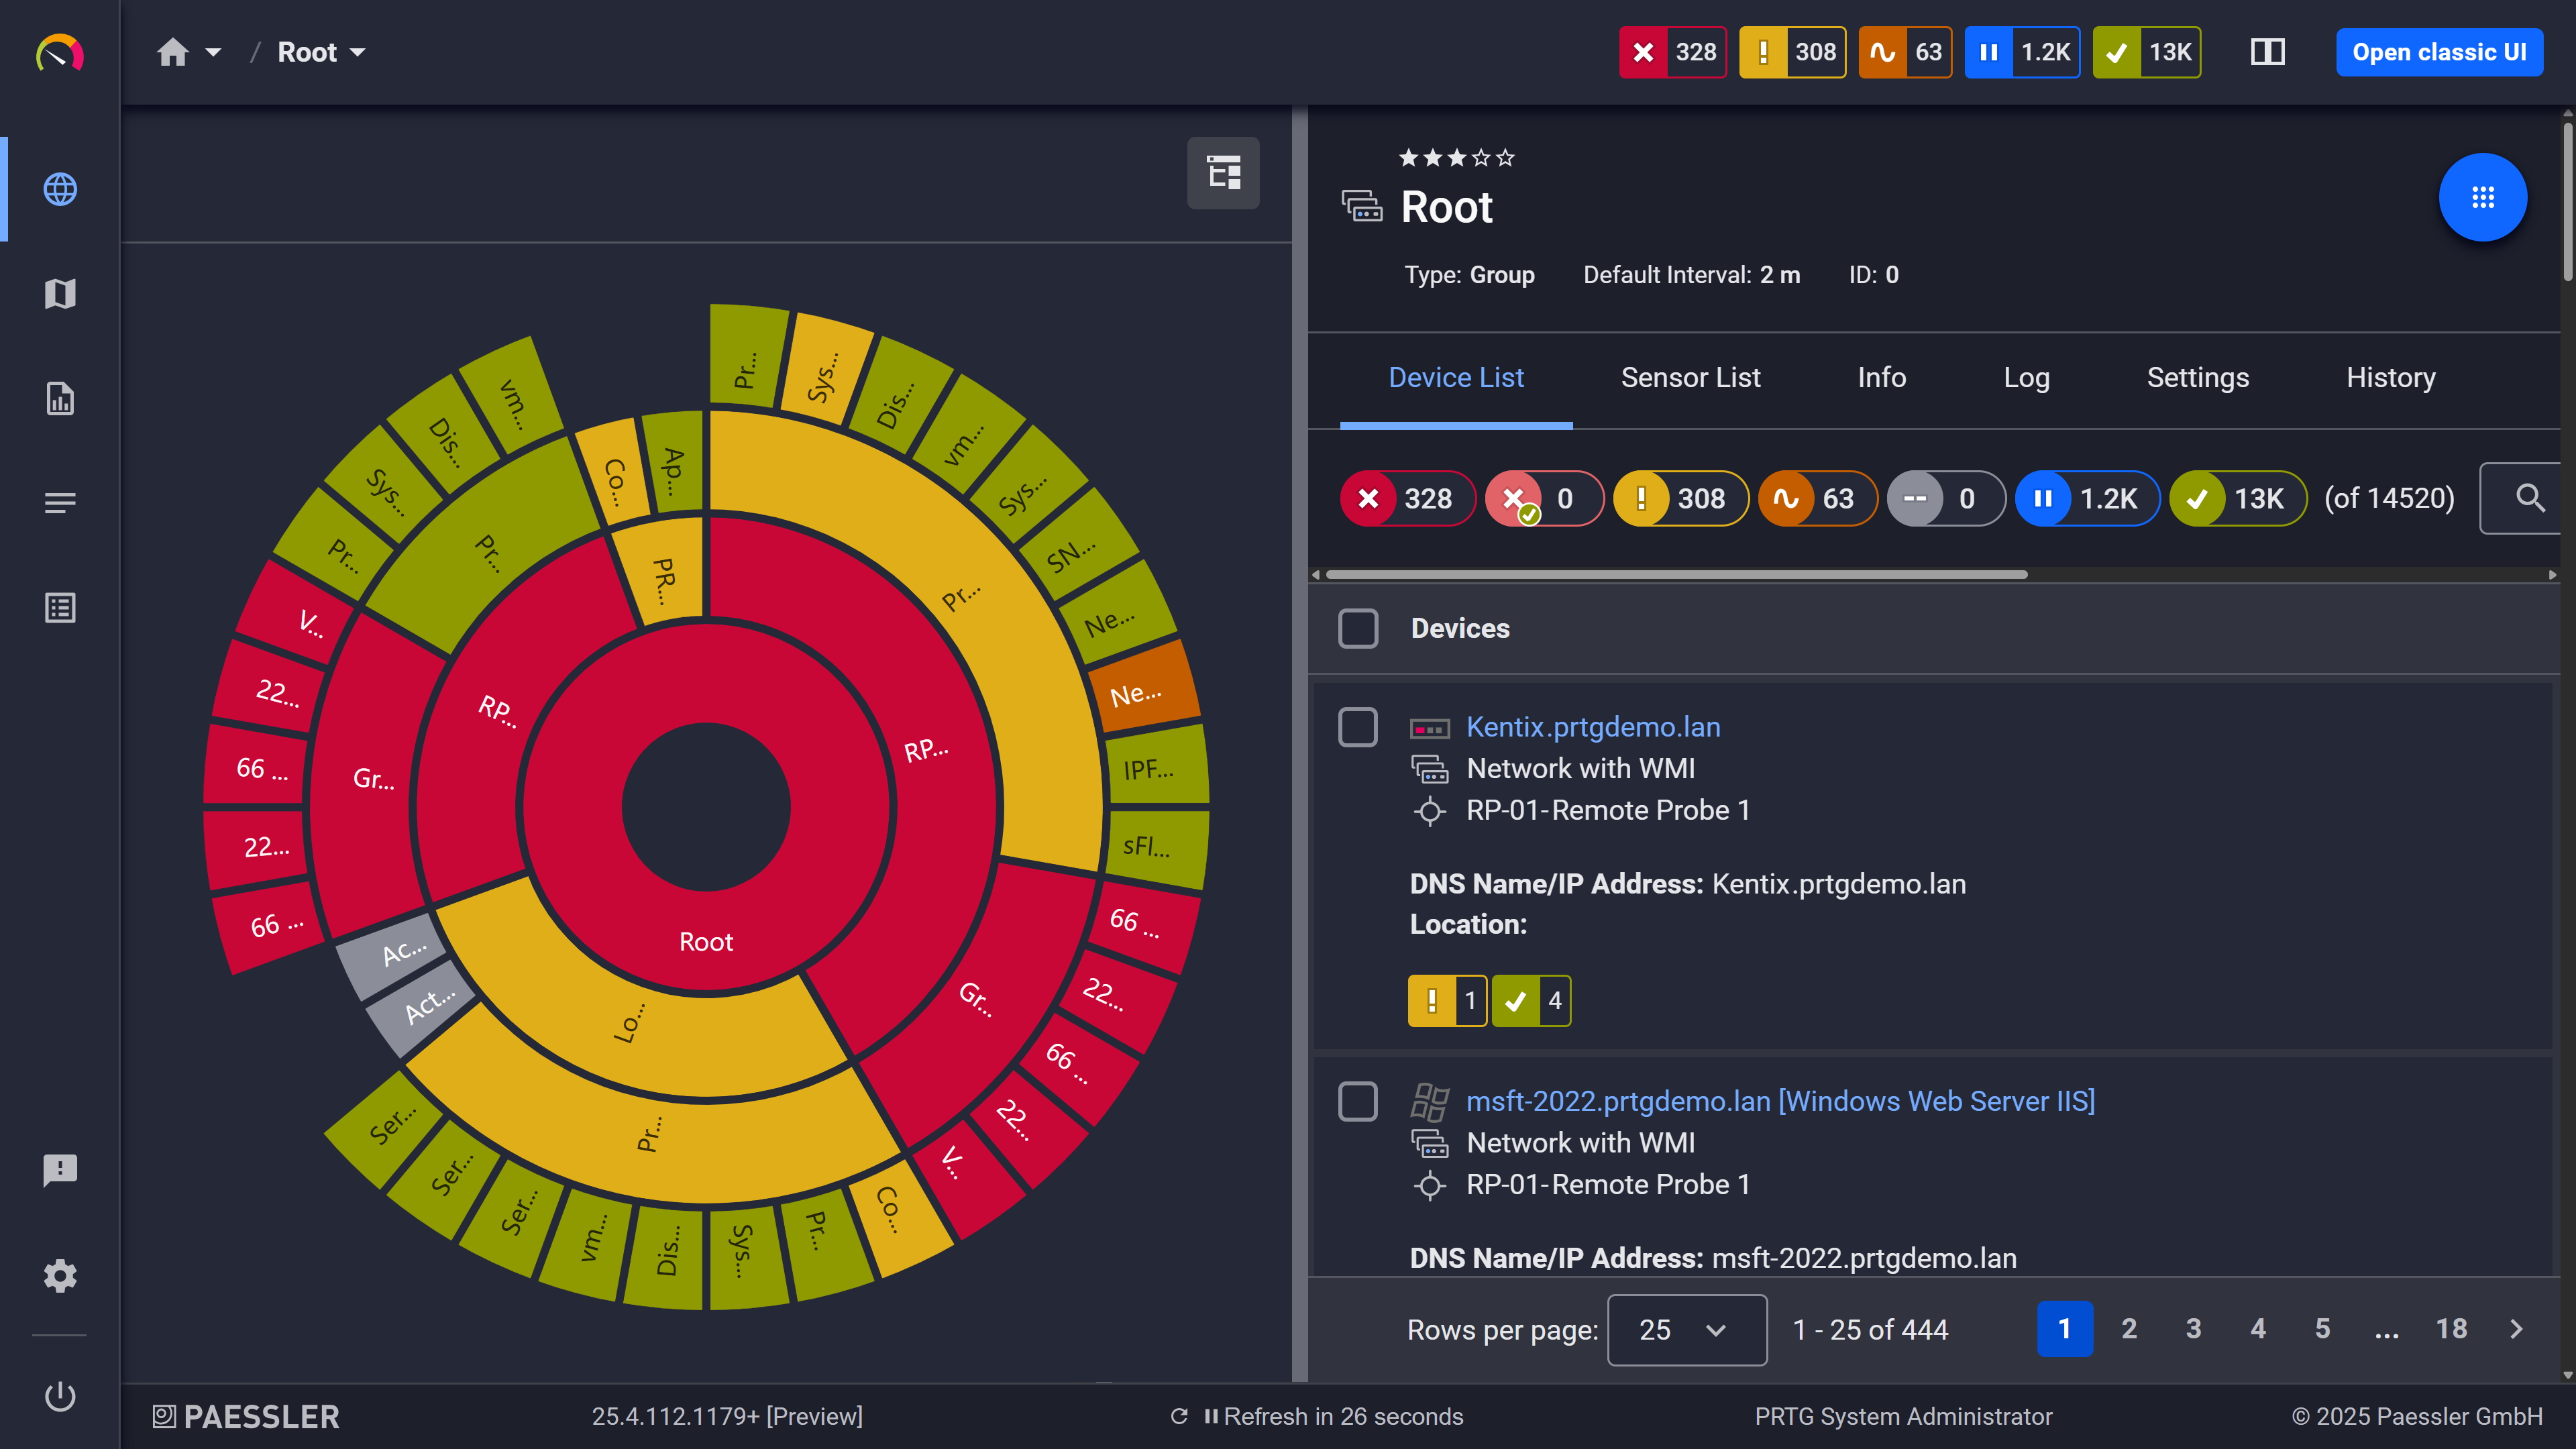
Custom dashboard: your easy-to-grasp overview built from your own sensors
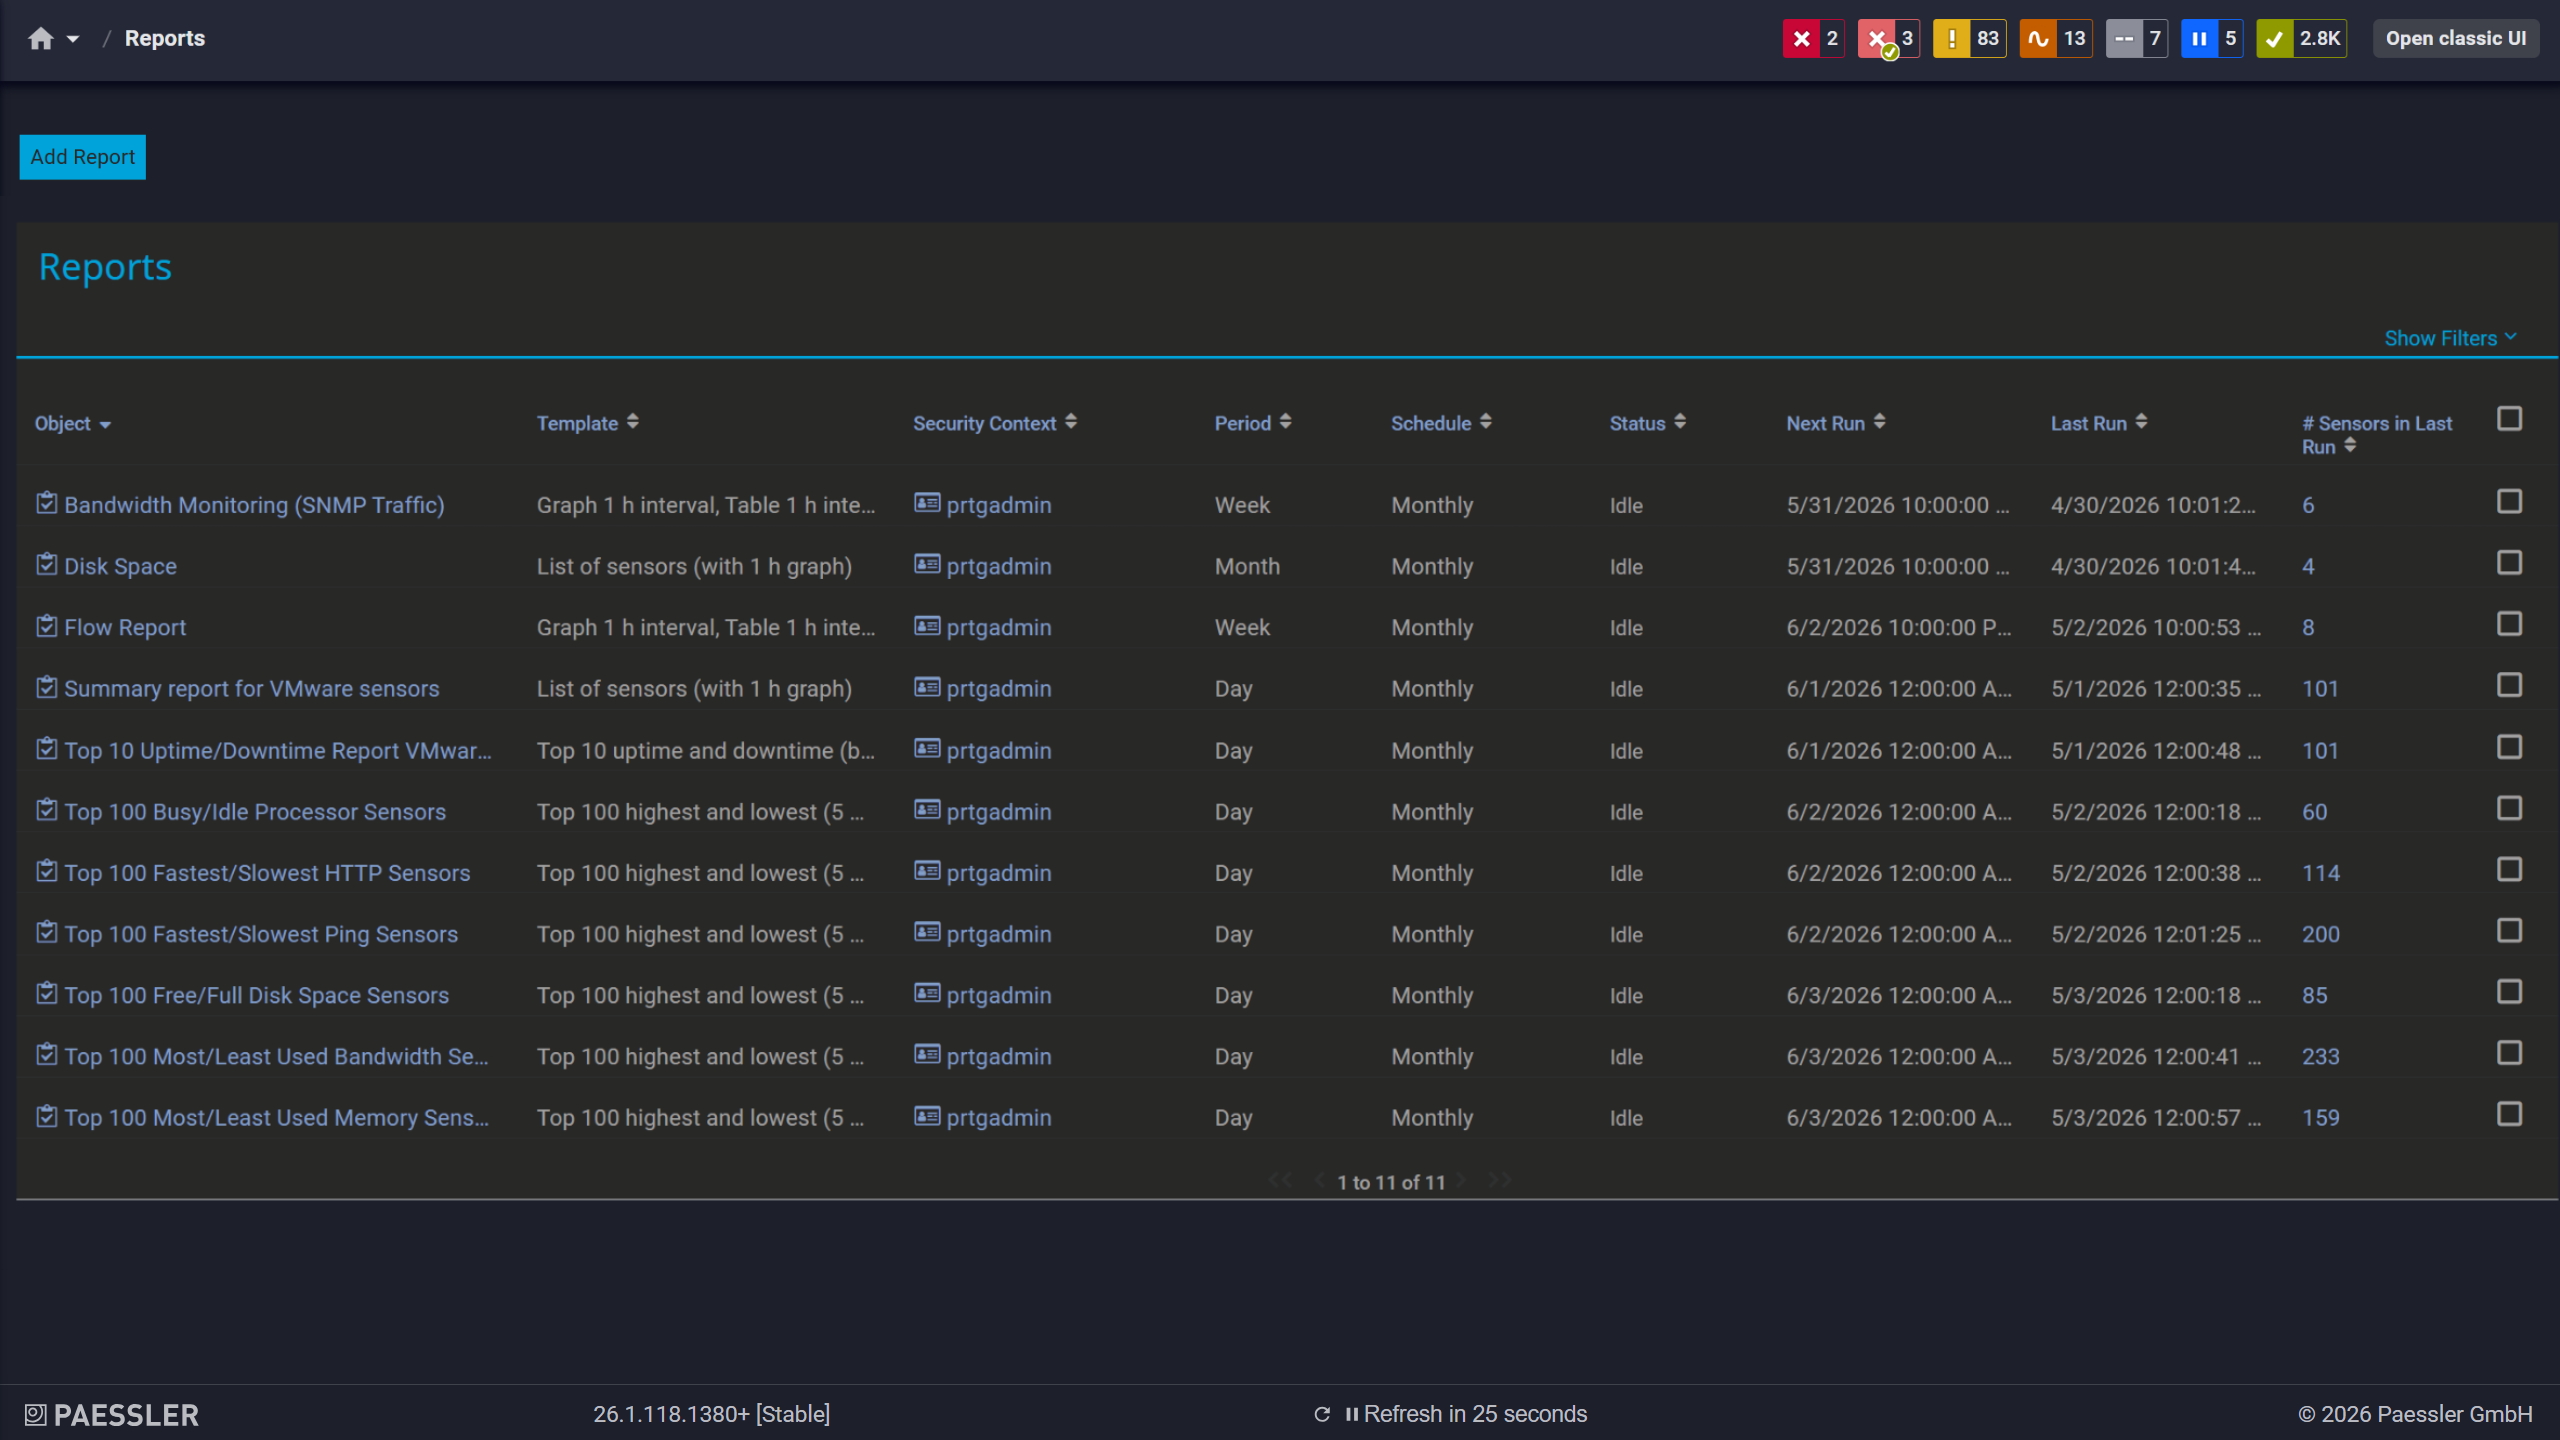
PRTG report screen: See all the reports generated and available to you in one easy to grasp overview
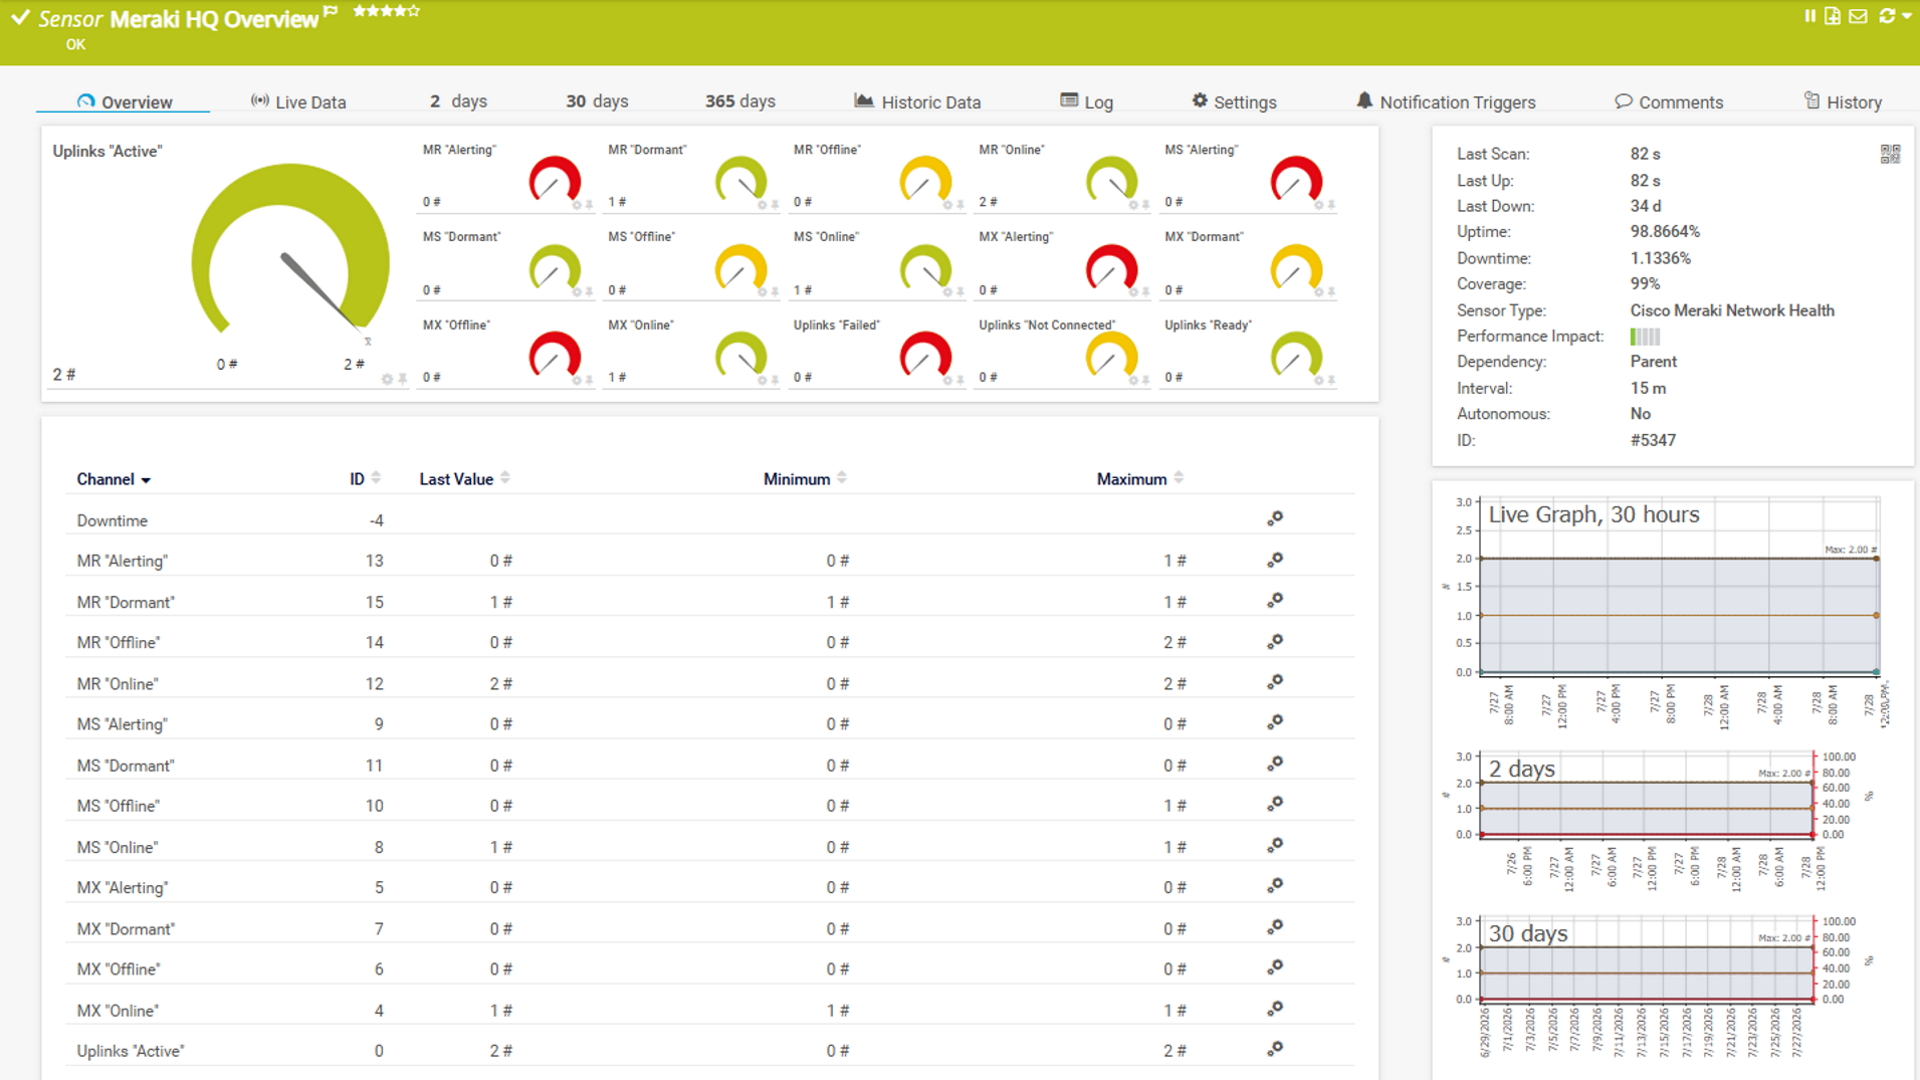
Sensor traffic: live sensor data, updated on your configured scan interval
Switching from Checkmk to PRTG doesn't mean starting from a blank network. PRTG's auto-discovery scans your infrastructure, identifies your devices, and builds a matching sensor set from built-in templates. According to our 2026 survey of 1,088 IT teams, 60.2% of midmarket customers name “one tool that covers everything” as their top reason for choosing PRTG.
Run auto-discovery alongside Checkmk. Point PRTG at your network while Checkmk keeps running. Auto-discovery pings your IP ranges, identifies device types, and builds a matching sensor set from built-in templates, with no impact on your existing Checkmk setup.
Map what auto-discovery found against what Checkmk was watching. Compare the sensors PRTG created automatically to your existing Checkmk checks and rulesets, and add any custom sensors you still need using PRTG's custom sensor types and REST API.
Rebuild alerts and notifications. Recreate your threshold and escalation logic using PRTG's notification triggers, configured through the interface rather than written as a rule file.
Validate coverage, then cut over. Run PRTG and Checkmk side by side until you're confident nothing is missing, then redirect your team to PRTG and decommission Checkmk.
Bring in an implementation partner for large environments. For environments with hundreds of devices or multiple sites, a Paessler partner can help plan and validate the migration.
Run a Paessler PRTG UVexplorer discovery once you're on PRTG. PRTG UVexplorer is a separate product that maps your network through scheduled discoveries and builds a device inventory, giving you a multi-vendor view of what's actually connected. Compare that against what Checkmk was monitoring before the switch to spot anything the old setup missed. It's a useful check after cutover, not a required part of the migration itself.
For a small, single-site setup with a few dozen devices, it often is. Checkmk's own documentation scopes Community to roughly 100 hosts, with community-based support rather than a vendor support team behind it. Past that size, or once you need monitoring across more than one location, Checkmk requires moving to a paid edition. If you're already close to that ceiling, it's worth comparing what a PRTG subscription includes at the same environment size before you commit to the upgrade path on either side.
Yes, and it's included at every PRTG license size rather than gated to a higher tier. PRTG's remote probes let you monitor multiple sites from one central installation without a separate purchase for each location. This matters at scale: according to our 2026 survey of 1,088 IT teams, 55.3% of decentralized-enterprise PRTG customers monitor distributed sites or remote offices, more than double the overall survey average of 40.5%. In Checkmk, distributed monitoring across sites is a Pro or Ultimate feature, not available in the free Community edition.
They're the same product under different names. Check_MK was the tool's original name before the company rebranded to Checkmk. Checkmk Raw and Checkmk Enterprise were renamed to Checkmk Community and Checkmk Pro respectively, as part of a 2026 edition rename that also introduced Checkmk Ultimate and a separate Checkmk Cloud SaaS edition. If you're comparing quotes or documentation that use the older names, they map directly to the current lineup.
No. PRTG's auto-discovery scans your network and builds a new monitoring setup based on what it finds; it doesn't read or convert Checkmk's rule files, checks, or configuration. Sensors, alerts, and dashboards get set up fresh in PRTG's interface. Most teams run both tools in parallel briefly to rebuild and verify before decommissioning Checkmk.
Yes, natively. PRTG ships built-in Modbus TCP and RTU sensors, plus OPC UA sensors for server status, certificates, and custom values, included in every PRTG license with no add-on required. In Checkmk, Modbus and OPC UA support comes only through unofficial, community-built Exchange packages, which are unsupported and offered without a vendor warranty.
They're more similar than they first appear. Both vendors price by a granular unit tied to what you're actually monitoring, a PRTG sensor or a Checkmk service, rather than a flat per-device fee. The real difference is what each unit unlocks: every PRTG sensor type is available at every license size, while several Checkmk capabilities, including distributed monitoring and advanced reporting, are only available once you move to a higher edition.
Not natively in base PRTG. Checkmk includes automatic topology maps, hardware and software inventory with change history, and configuration version tracking, even in its free Community edition. PRTG covers this through PRTG UVexplorer, a separate product whose topology and configuration data then appears inside the PRTG interface, refreshed through scheduled discoveries rather than continuously. This is worth planning for as part of the switch, since base PRTG doesn't include it out of the box.
It depends on what you're running today. If you're on the free Community edition, the comparison that matters most is what you'd need to add (a paid edition, more setup time) to get capabilities PRTG includes at every license size. If you're already on Pro, Ultimate, or the Cloud SaaS edition, compare against the PRTG license sized to your current device count, since Checkmk's higher editions and PRTG's larger licenses both include their full feature sets.
It depends on what you're optimizing for. If your team wants deep, rule-based control and is comfortable maintaining that itself, Checkmk is a genuinely strong choice, especially on its free Community edition. If you want the same breadth of coverage with less setup and rule maintenance, and you need distributed monitoring or OT protocols included at every tier, PRTG is often the better fit. The comparison table and the ‘why compare’ section above go into the specific trade-offs.
We also compared PRTG with other monitoring tools:
SolarWinds might be interesting for extremely complex network environments. But it also means you need to invest in higher costs for a platform made up of different modules and add-ons (that cost extra).
The basic version of the open-source tool Nagios is free of charge. But most users spent many hours to set up and customize the tool. In case of problems, browsing through forums is often the only solution.
LogicMonitor might be your choice if your organization is cloud-first and relies heavily on cloud services. However, LogicMonitor’s out-of-the-box monitoring functionality is much more limited.
Zabbix is open-source software with a strong community support. But it requires lots of manual configuration work to install and set it up. You also need to install agents on the monitored systems.
Start a 30-day trial with unlimited sensors, no commitment required.
Tell us your device count and we'll send you a quote.
See PRTG in a live demo with one of our monitoring experts.
