• Company
    • About Us
    • Case Studies
    • Press Center
    • Careers
    • Blog
    • Contact us
  • Contact us
  • Login
 
  • English
    • Deutsch
    • Español
    • Français
    • Italiano
    • Português
Paessler
                    - The Monitoring Experts
  • Products
    • Paessler PRTG
      Paessler PRTGMonitor your whole IT infrastructure
      • PRTG Network Monitor
      • PRTG Enterprise Monitor
      • PRTG Hosted Monitor
      • PRTG UVexplorer
      • PRTG extensionsExtensions for Paessler PRTGExtend your monitoring to a new level
    • Icon Features
      FeaturesExplore all monitoring features
      • Maps & dashboards
      • Alerts & notifications
      • Multiple user interfaces
      • Distributed monitoring
      • Customizable reporting
  • Solutions
    • Industries
      IndustriesMonitor various industry sectors
      • Industrial
      • Healthcare
      • Data Center
      • Education
      • Finance
      • Government
    • IT Topics
      IT TopicsMonitor all areas of IT
      • Network Monitoring
      • Bandwidth Monitoring
      • SNMP Monitor
      • Network Mapping
      • WiFi Monitoring
      • Server Monitoring
  • Pricing
  • Resources
    • Getting Started
      Getting StartedModules for self-paced learning
    • How-to Guides
      How-to GuidesGet the most out of PRTG
    • Videos & Webinars
      Videos & WebinarsLearn from Paessler experts
    • IT  Knowledge
      IT KnowledgeExpand your IT knowledge
    • PRTG Manual
      PRTG ManualFull documentation
    • Knowledge Base
      Knowledge BaseShare community knowledge
    • PRTG Sensor Hub
      PRTG Sensor HubGet sensors, scripts & templates
    • Trainings
      PRTG TrainingLearn how to work with PRTG
  • Partners
    • Icon Handshake
      Become a PartnerFor resellers and channel partners
    • Icon MSP
      Become an MSPDeliver monitoring as a managed service
    • icon partner
      Partner PortalLog in to your partner account
    • Deal Registration
      Deal RegistrationRegister your sales opportunities
    • icon search
      Find a PartnerFind partners selling Paessler products
    • icon technology
      Technology AlliancesSee Paessler technology partnerships
    • Partner HubTools for Your Success
  • Company
    • About Us
    • Case Studies
    • Press Center
    • Careers
    • Blog
    • Contact us
  • Contact us
  • Login
  • English
    • Deutsch
    • Español
    • Français
    • Italiano
    • Português
  • Get a quote
  • Free trial

Complete Solar Energy Production Monitoring 

Real-time dashboards, threshold alerts, and historical reports for inverters and PV systems. Vendor-agnostic and protocol-based.

Free download
PRODUCT OVERVIEW

How do you monitor solar energy production without adding a dedicated solar monitoring software to your stack? 

PRTG collects solar energy system telemetry using industry-standard protocols: Modbus TCP/RTU, HTTP Push/REST APIs, SNMP, MQTT, and OPC UA. It stores historical data, fires threshold-based alerts when system performance degrades and publishes dashboards and automated reports. Worth noting: PRTG is vendor-agnostic, but your inverters need to support open protocols for solar panel monitoring to work. There's also setup work involved. Register mapping for Modbus is the most hands-on part. REST templates for cloud APIs or custom scripts for proprietary formats add complexity depending on what you're working with. PRTG handles energy monitoring across protocols, not through vendor-specific integrations.

Supported technologies: Modbus TCP/RTU (SunSpec where available) · HTTP Push / HTTP IoT Push Data Advanced · REST Custom / REST v2 · SNMP · MQTT · OPC UA · Script v2 / EXE Advanced · PRTG Data Hub for log forwarding

Download PRTG Trial

What you will find on this page

  • What PRTG Brings to Solar Operations
  • How PRTG Monitors
  • Manufacturer Portals vs. PRTG
  • FAQs

PRTG is compatible with all major vendors, products, and systems

compatible with all major vendors, products, and systems

What PRTG Brings to Solar Operations

Unified Monitoring Across Solar and IT Infrastructure 

Solar monitoring systems are fragmented by design. Your inverter manufacturer gives you a cloud portal showing DC input, AC output, and daily energy totals. Your network team monitor switches, routers, and WAN links all with entirely separate tools. Nobody designed this situation intentionally. It's just how things ended up.

PRTG consolidates solar production data with your existing IT infrastructure monitoring. Using Modbus TCP/RTU sensors for inverter telemetry, SNMP for networked power meters, and remote probes for multi-site connectivity, PRTG brings solar array health and IT infrastructure status into one place. The map view alone tends to be what facilities managers notice first: all arrays geographically, drill into any site from there.

What this gives you:

  • Single dashboard combining energy output, inverter health, environmental sensors, and network status
  • Faster root-cause analysis: correlate network outages with inverter alarms instead of switching between tools to figure out which problem caused the other
  • Unified alerting so the same notification rules that page your on-call team for a router failure also cover inverter underperformance. One rule set. One team.
  • Complete operational visibility for facilities managers and IT teams working from the same data, which matters more than it sounds when both groups are used to working in isolation
PRTG web interface showing live performance graphs for a Probe Health sensor

Live graphs, real-time performance data

PRTG reports list showing scheduled monitoring reports with run times and sensor counts

Scheduled reports, always on time

PRTG Map Designer showing a custom network map with live device status and vendor icons

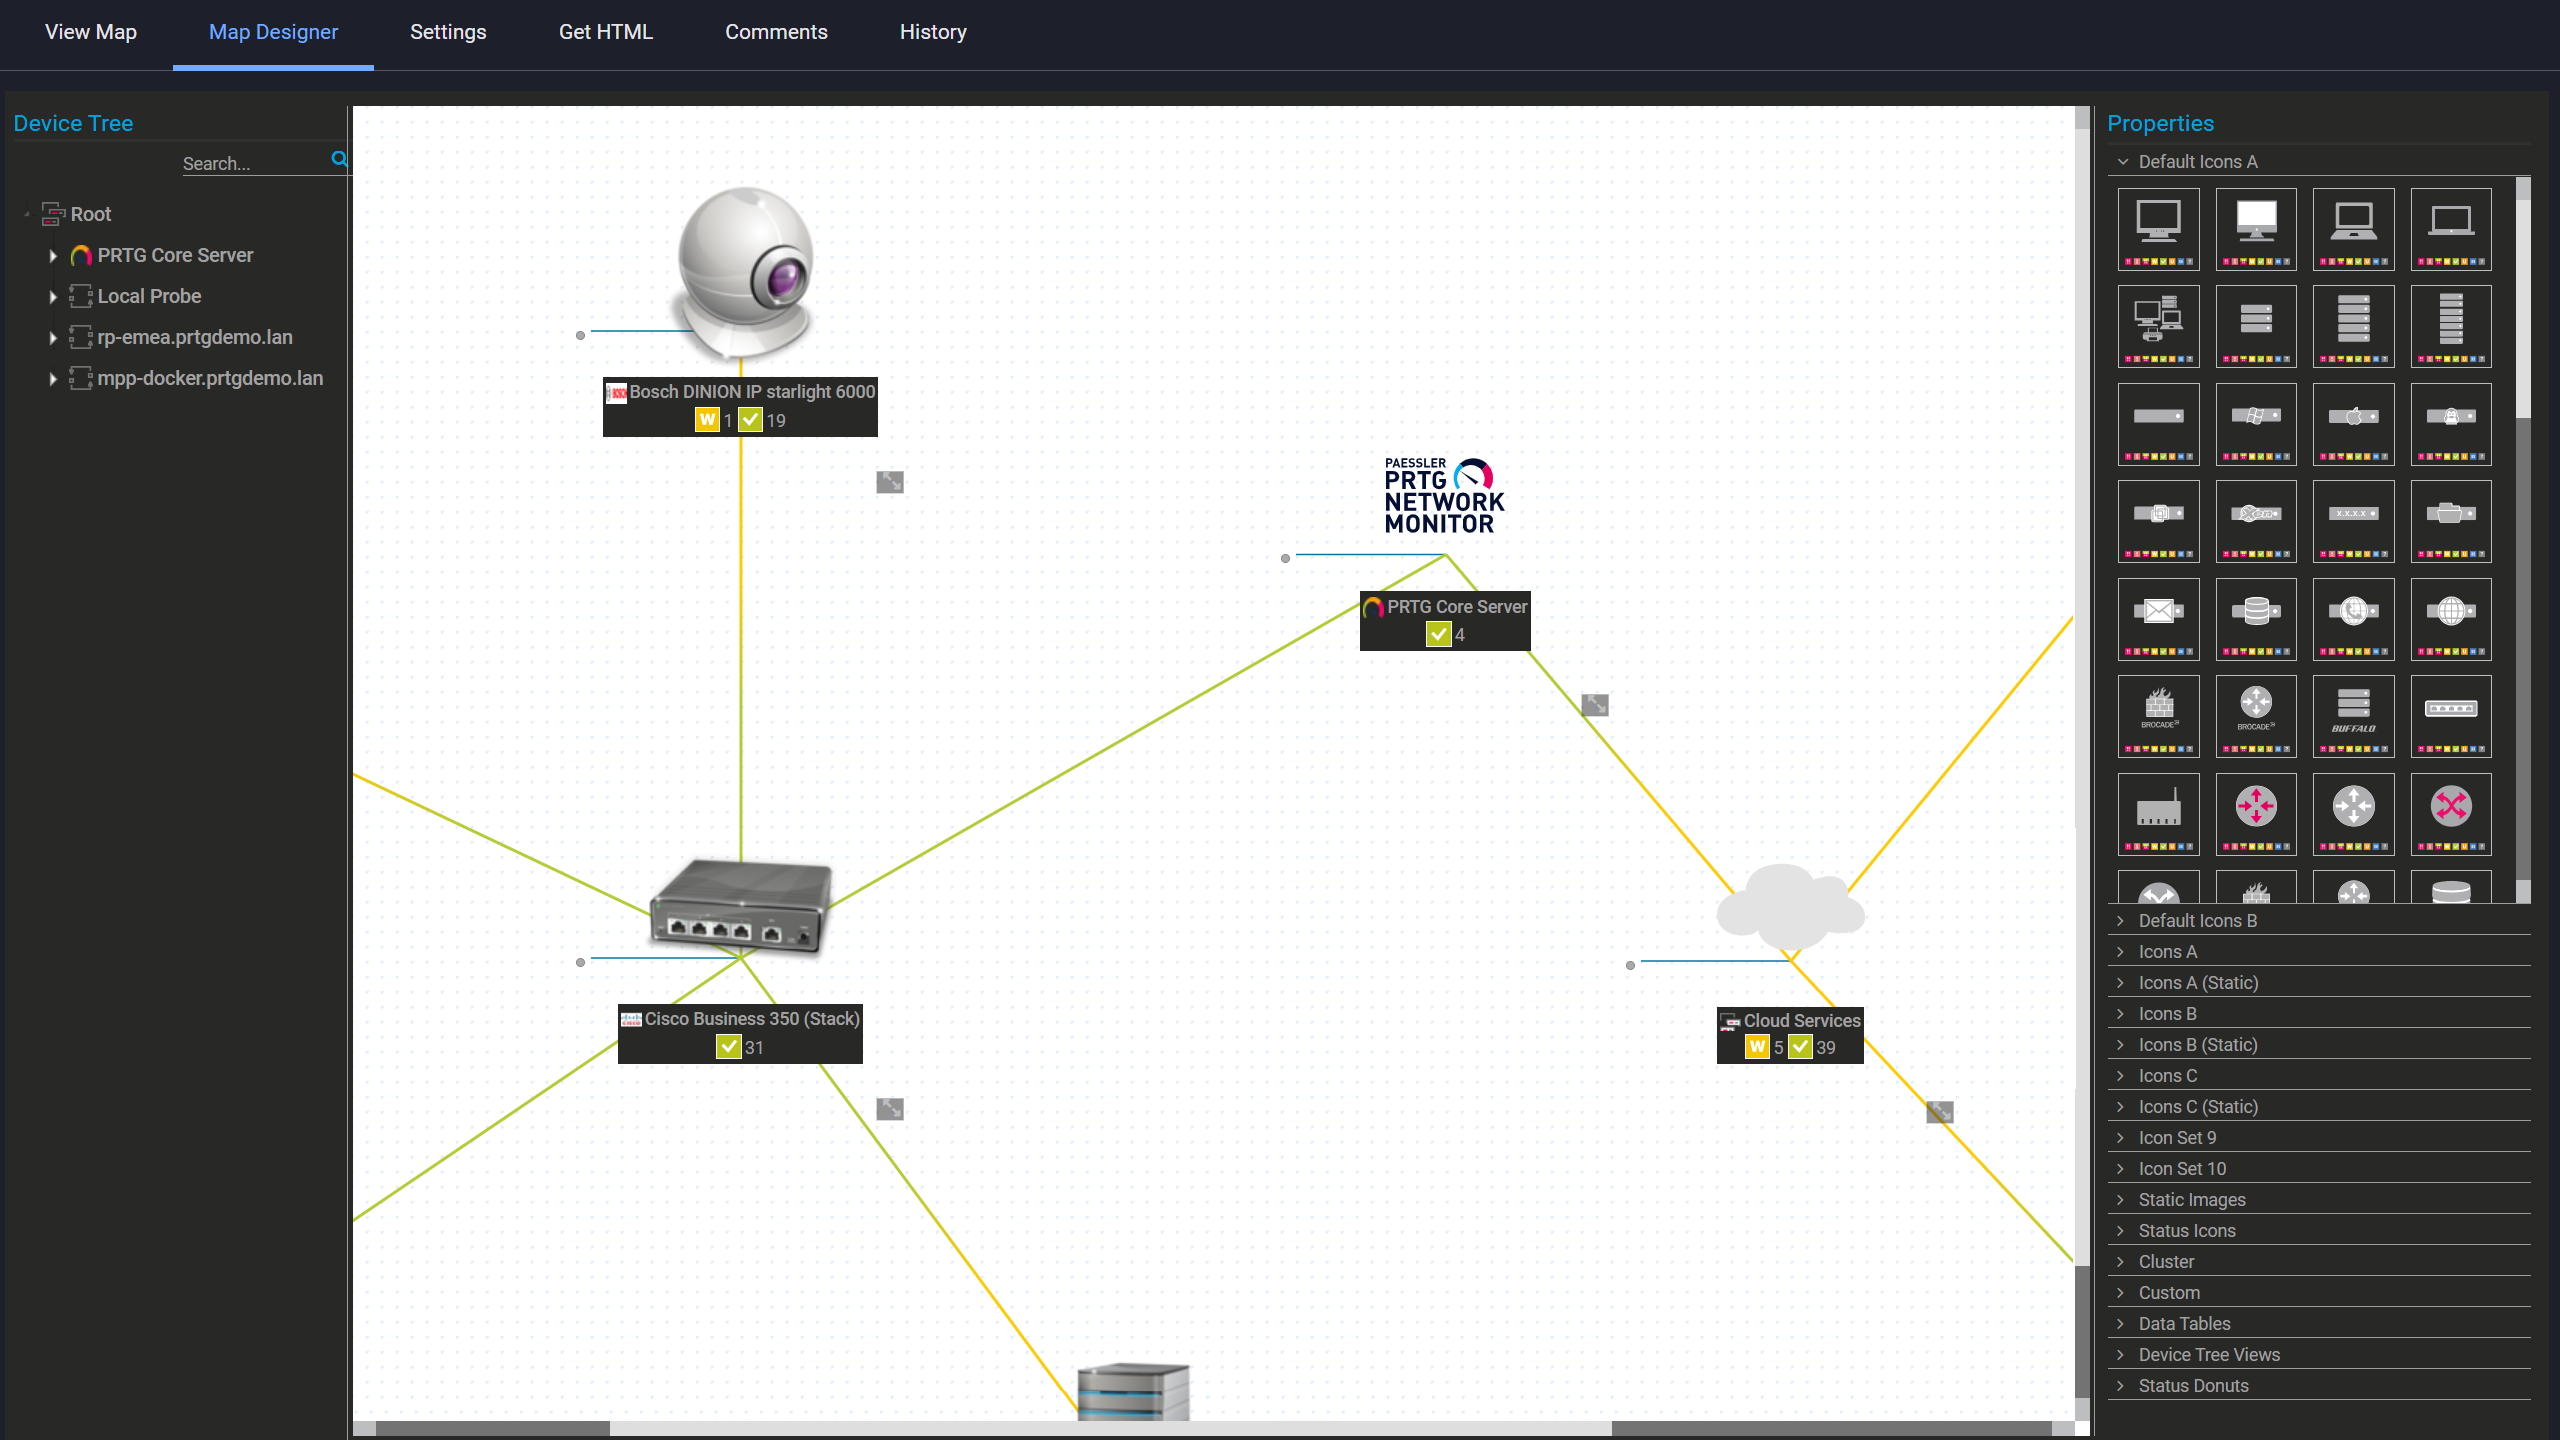
Custom maps with live status

Custom Alerts for Every Inverter Metric That Matters

Manufacturer portals cover fault codes and hard failures well. What PRTG adds is granular per-channel alerting for everything your inverter exposes: DC input voltage and current, AC output power and frequency, inverter temperature, daily energy counters, and operating status codes. You define upper and lower limits per channel. Multi-channel triggers let you combine conditions, e.g. energy output below threshold and inverter temp above normal, so alerts only fire when the combination actually means something. Tracking energy patterns over time also helps you establish seasonal baselines before locking in thresholds. Notifications scale with severity: warnings go to your monitoring app or email while critical alerts trigger SMS, webhooks to your ITSM system, or syslog forwarding to your SIEM.

Where this pays off:

  • Configurable channel limits per inverter or per array, with separate thresholds for different equipment or seasonal baselines
  • Multi-channel logic to cut false positives. Alert only when it actually means something.
  • Notification delivery across the full chain: email, SMS, push, webhooks, SNMP traps, syslog
  • Context-rich alerts with current values, graphs, and device status so your team can assess severity
  • Downtime reduced by routing the alert to the right team with enough context to act on it immediately

See Why IT Professionals Trust PRTG

Start monitoring your infrastructure in minutes. No professional services, no complex configuration, no risk.

Free download
PRODUCT OVERVIEW

Full Visibility Across Every Brand and Protocol

Managing solar installations across multiple sites or mixed equipment brands typically means working with several manufacturer portals in parallel. SolarEdge, SMA, Fronius, Huawei: each exposes solid data about its own devices. PRTG gives you one place where all of it comes together, using protocol-based monitoring instead of vendor-specific integrations. If the inverter speaks Modbus TCP/RTU, SNMP, HTTP REST APIs, MQTT, or OPC UA, PRTG monitors it. SunSpec-compliant registers included. Raw data is stored locally, exportable as CSV, XML, or JSON for analytics tools, business intelligence platforms, or net metering reconciliation.

What you're not buying into:

  • No vendor cloud dependency. PRTG runs on your infrastructure, on-premises or hosted
  • Brand-agnostic visibility across SMA, SolarEdge, Fronius, Huawei, Sungrow, and anything else that speaks an open protocol
  • Data ownership with export via API or scheduled reports for return on investment analysis, energy bill verification, or compliance
  • Mix and match inverter types, power meters, environmental sensors, and networked equipment in one platform

Important note: Consumer-grade or cloud-only inverters that don't expose open interfaces require gateways, manufacturer API access, or firmware supporting local telemetry.

PRTG sunburst chart visualizing the full network hierarchy with color-coded sensor status

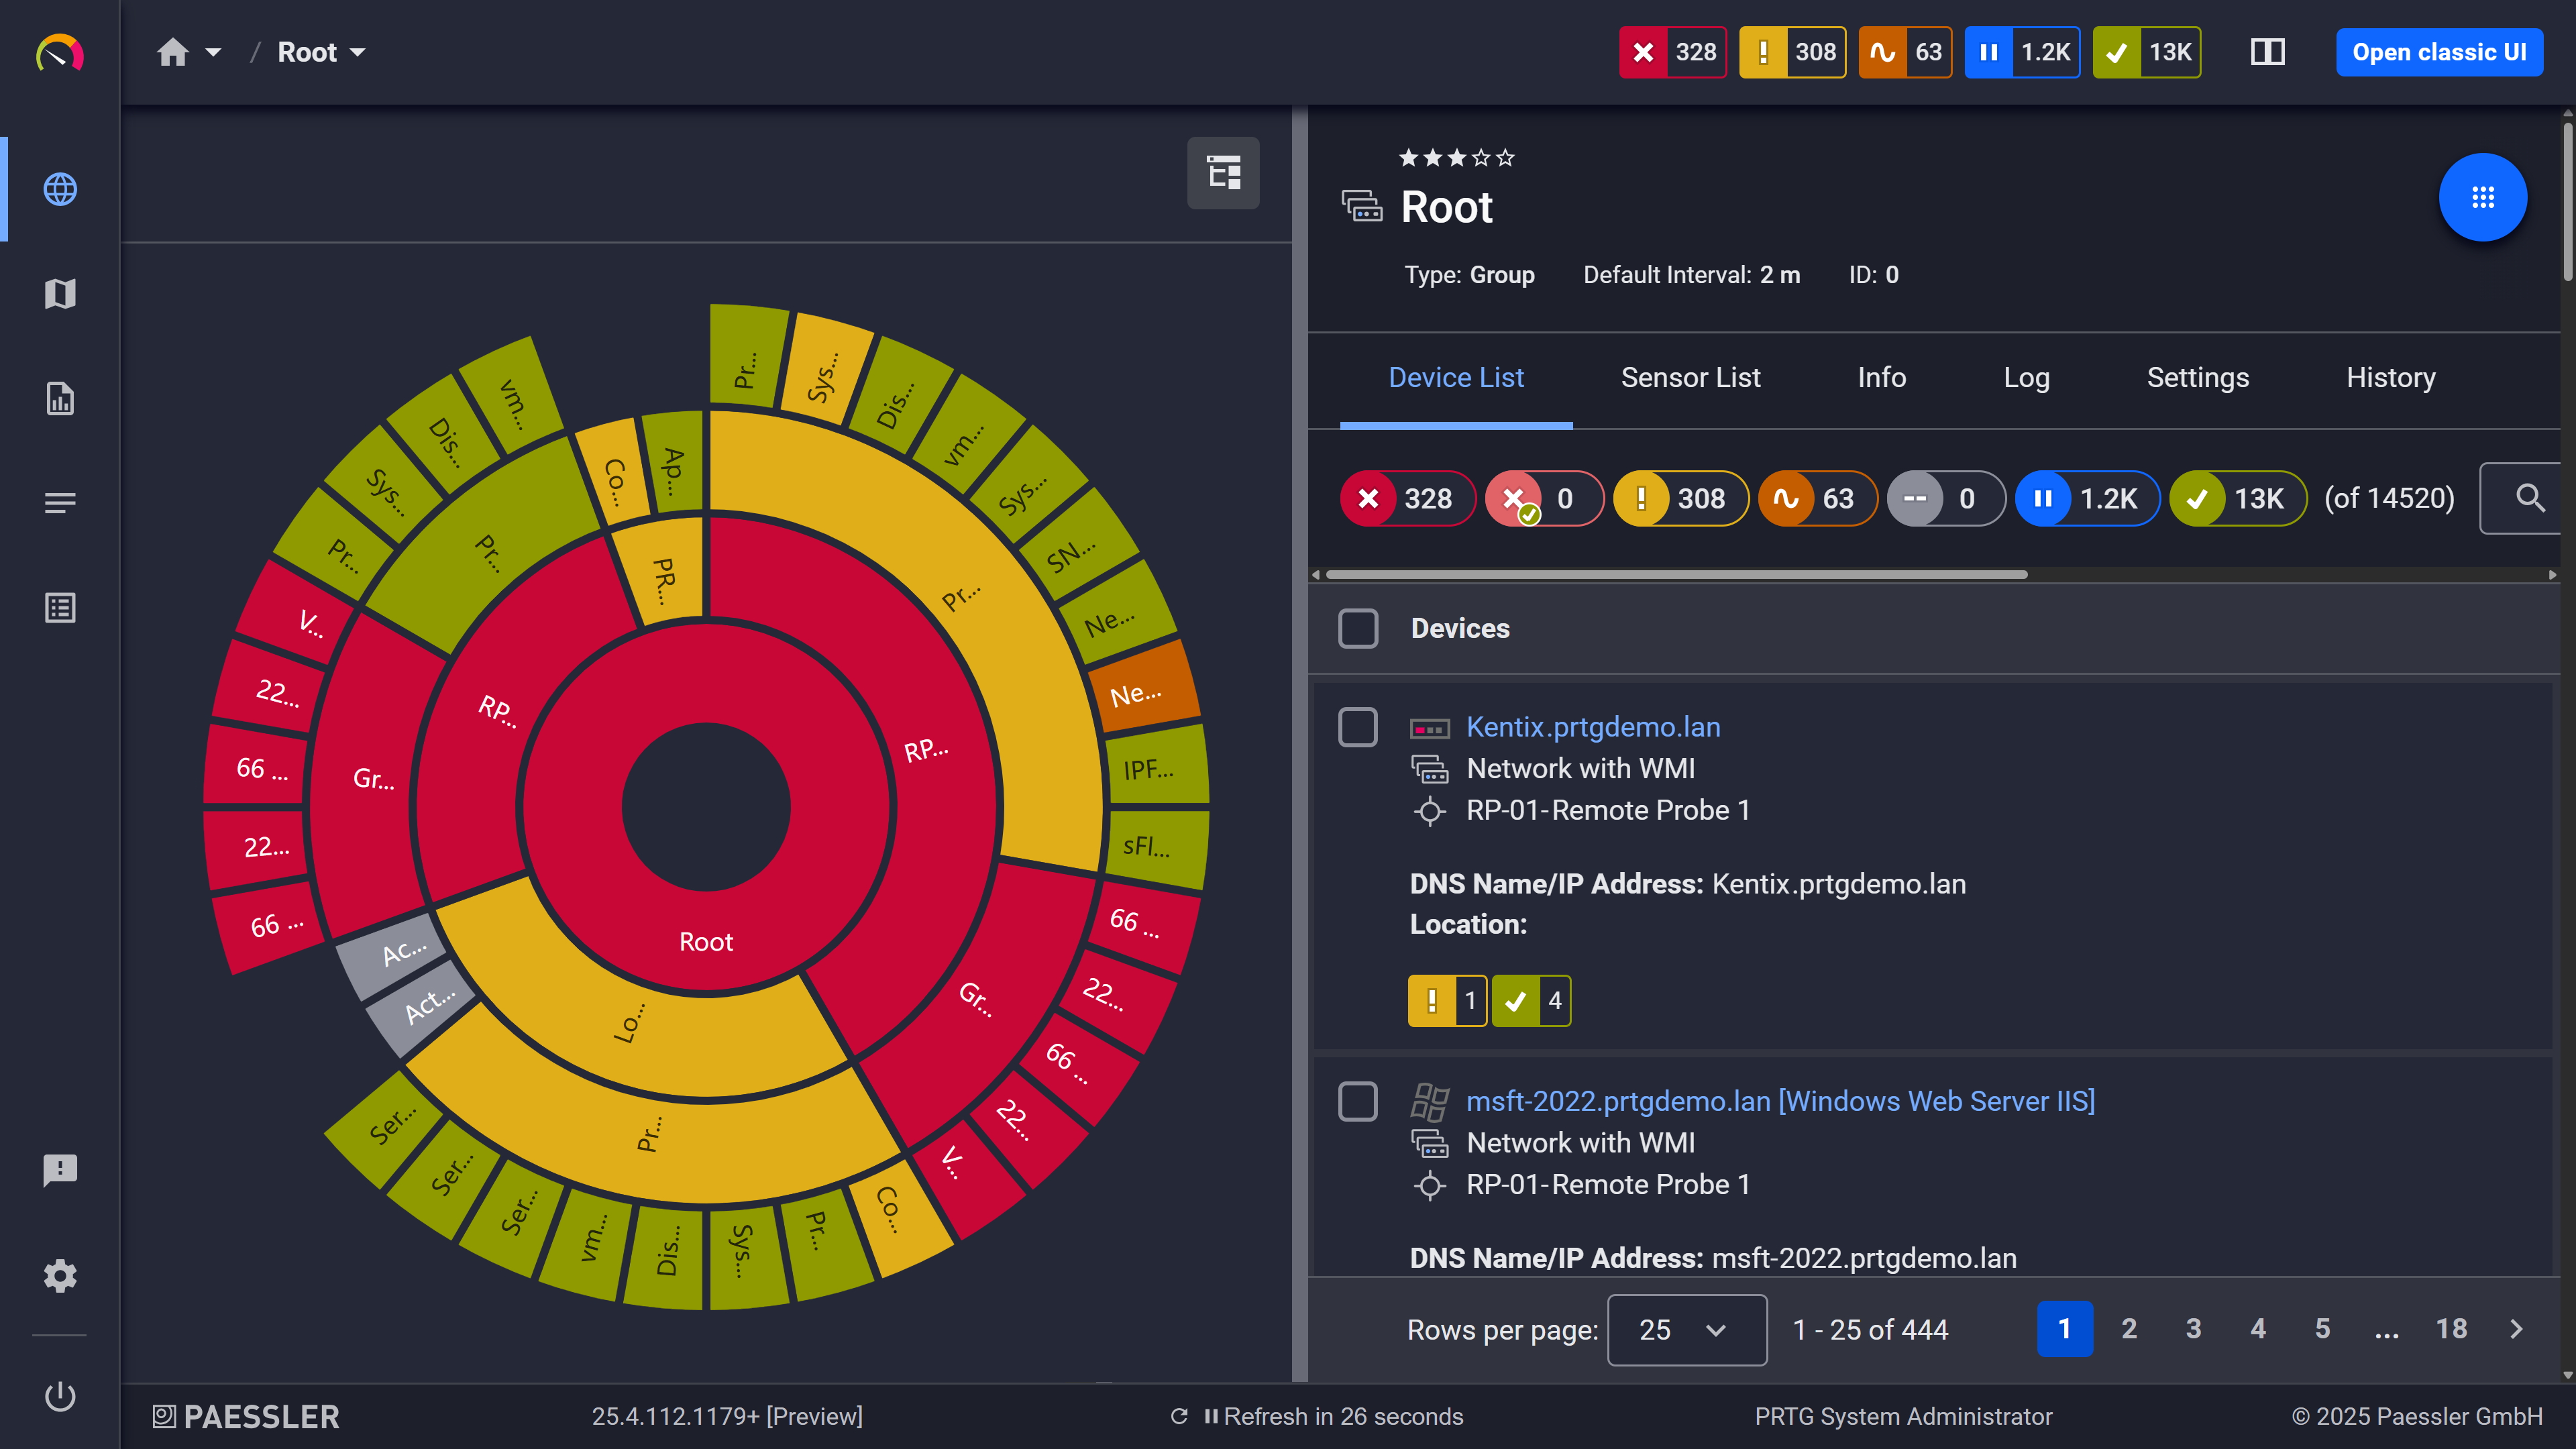
Your entire network, visualized instantly

PRTG web interface showing Probe Health sensor with health and storage gauge widgets

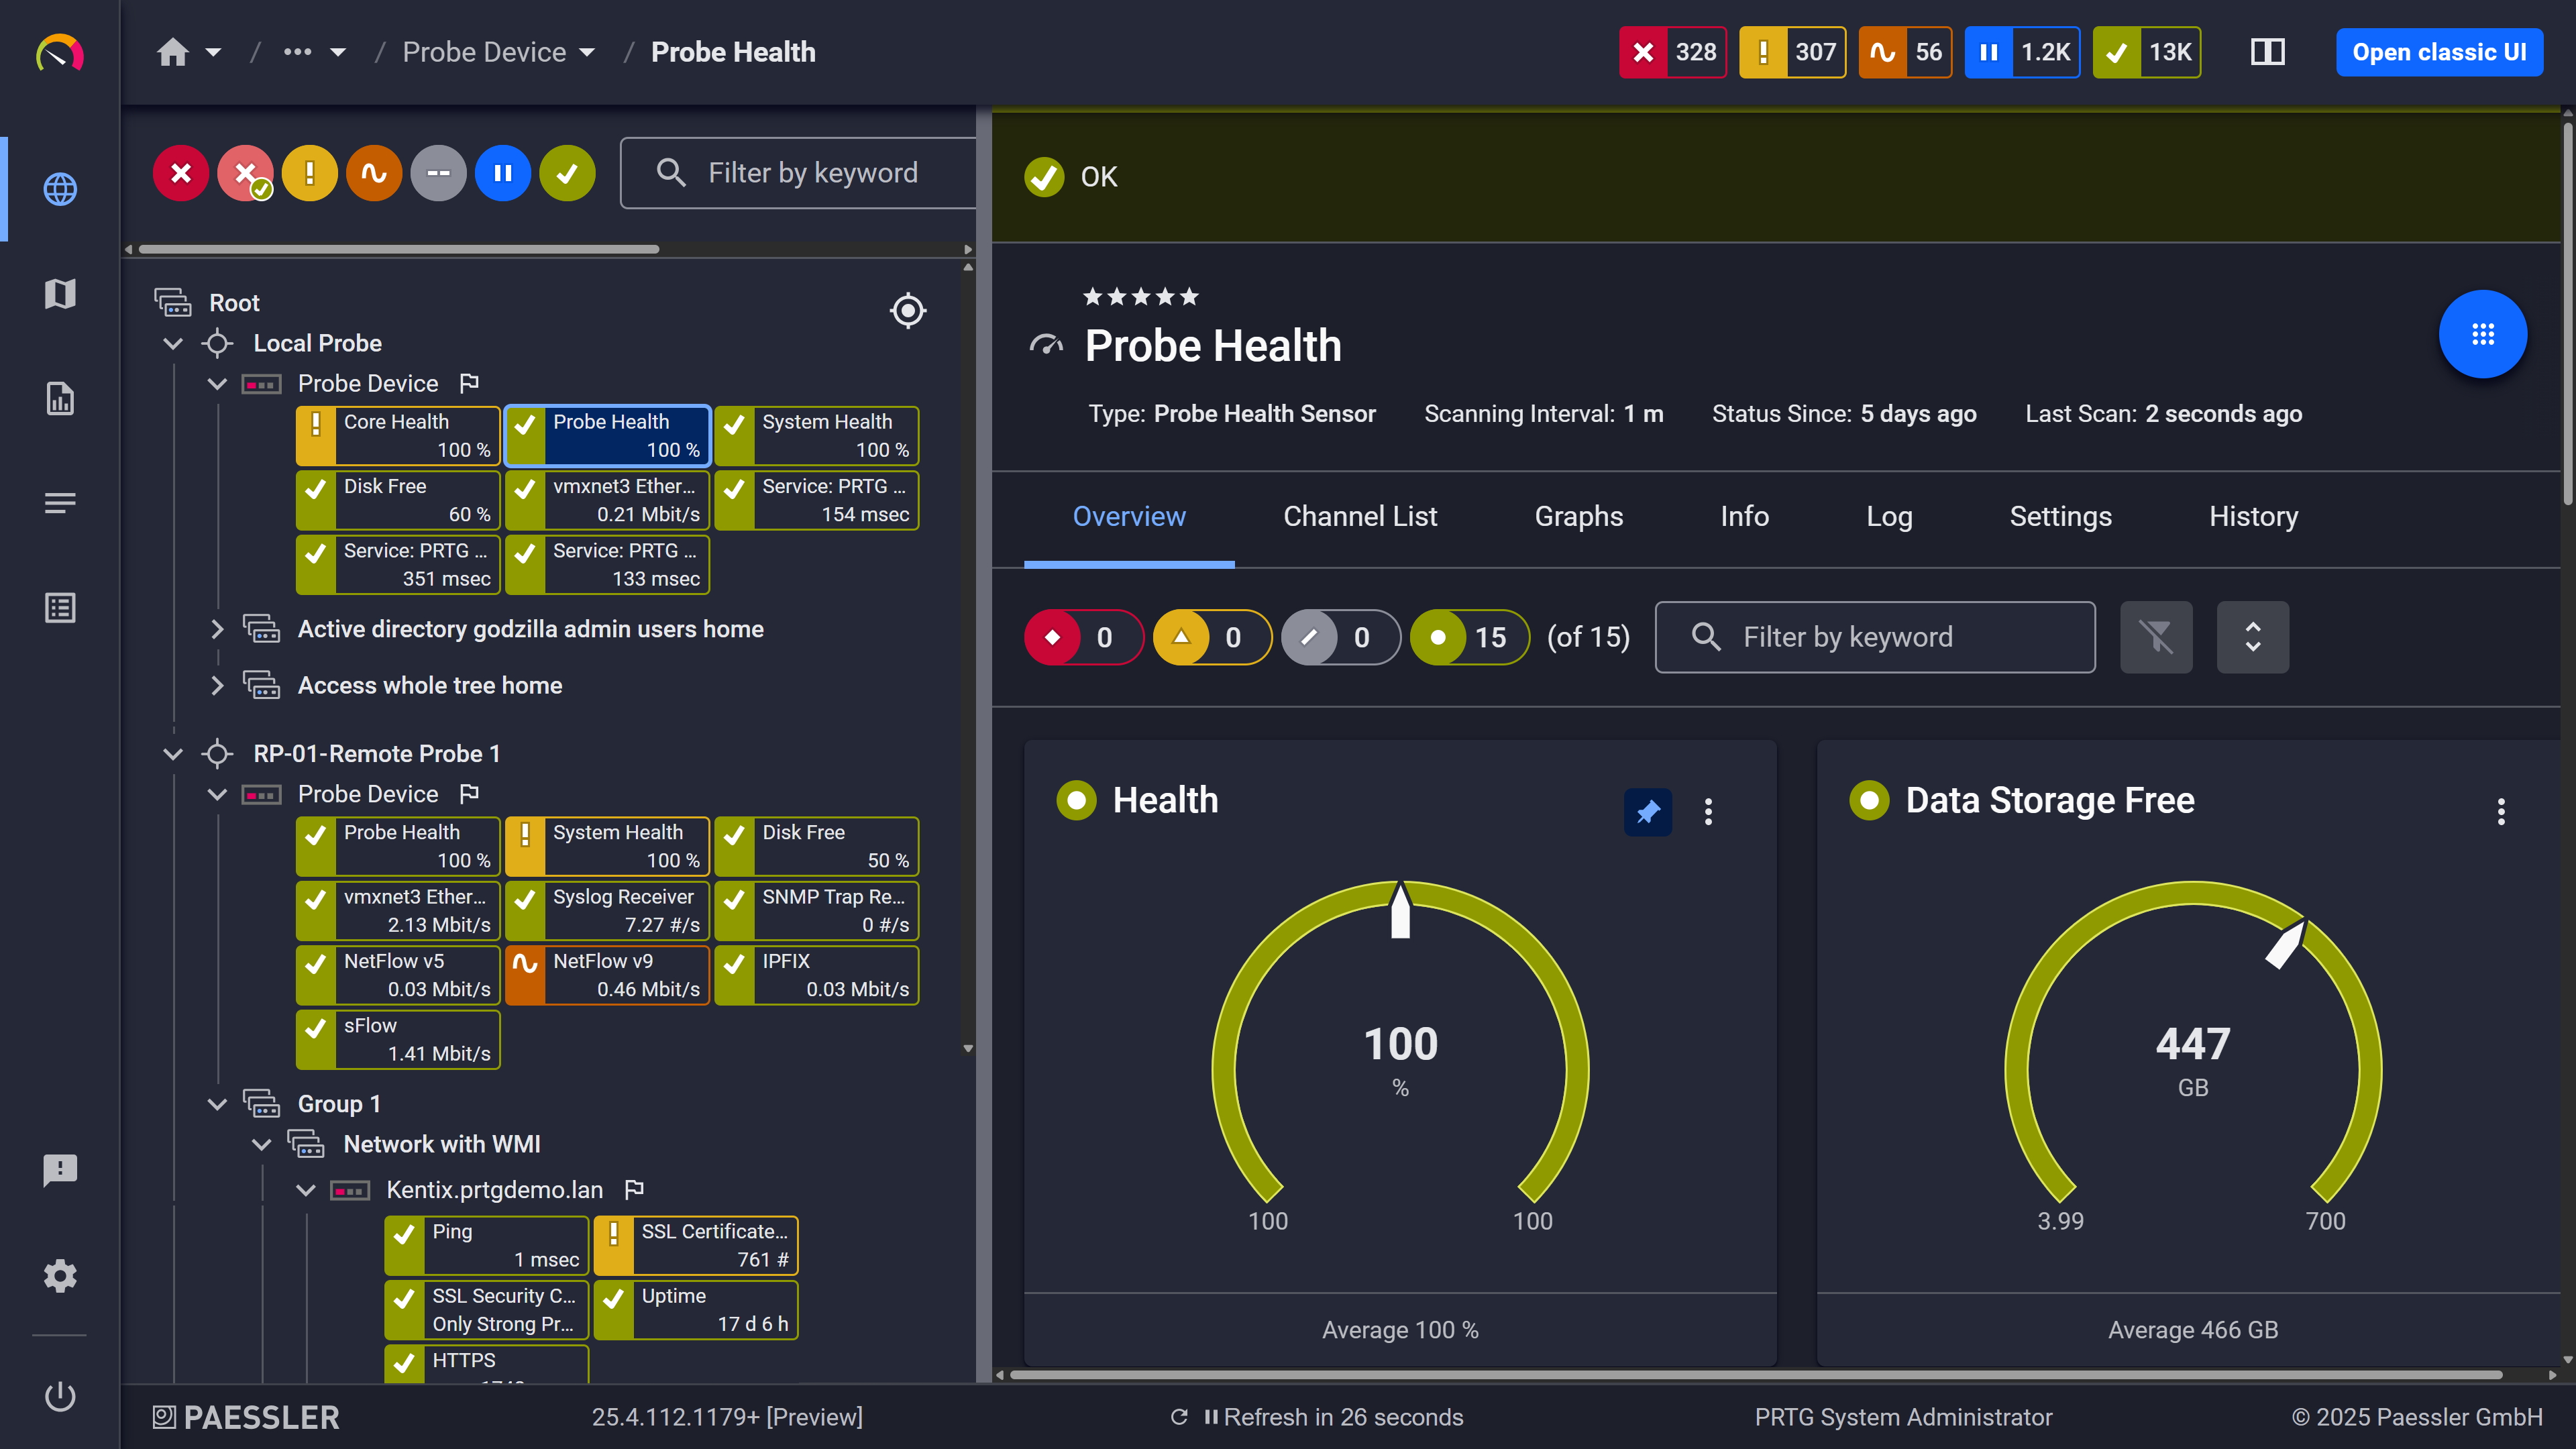
Probe health at a glance

PRTG tickets list showing system notifications, report completions, and update alerts

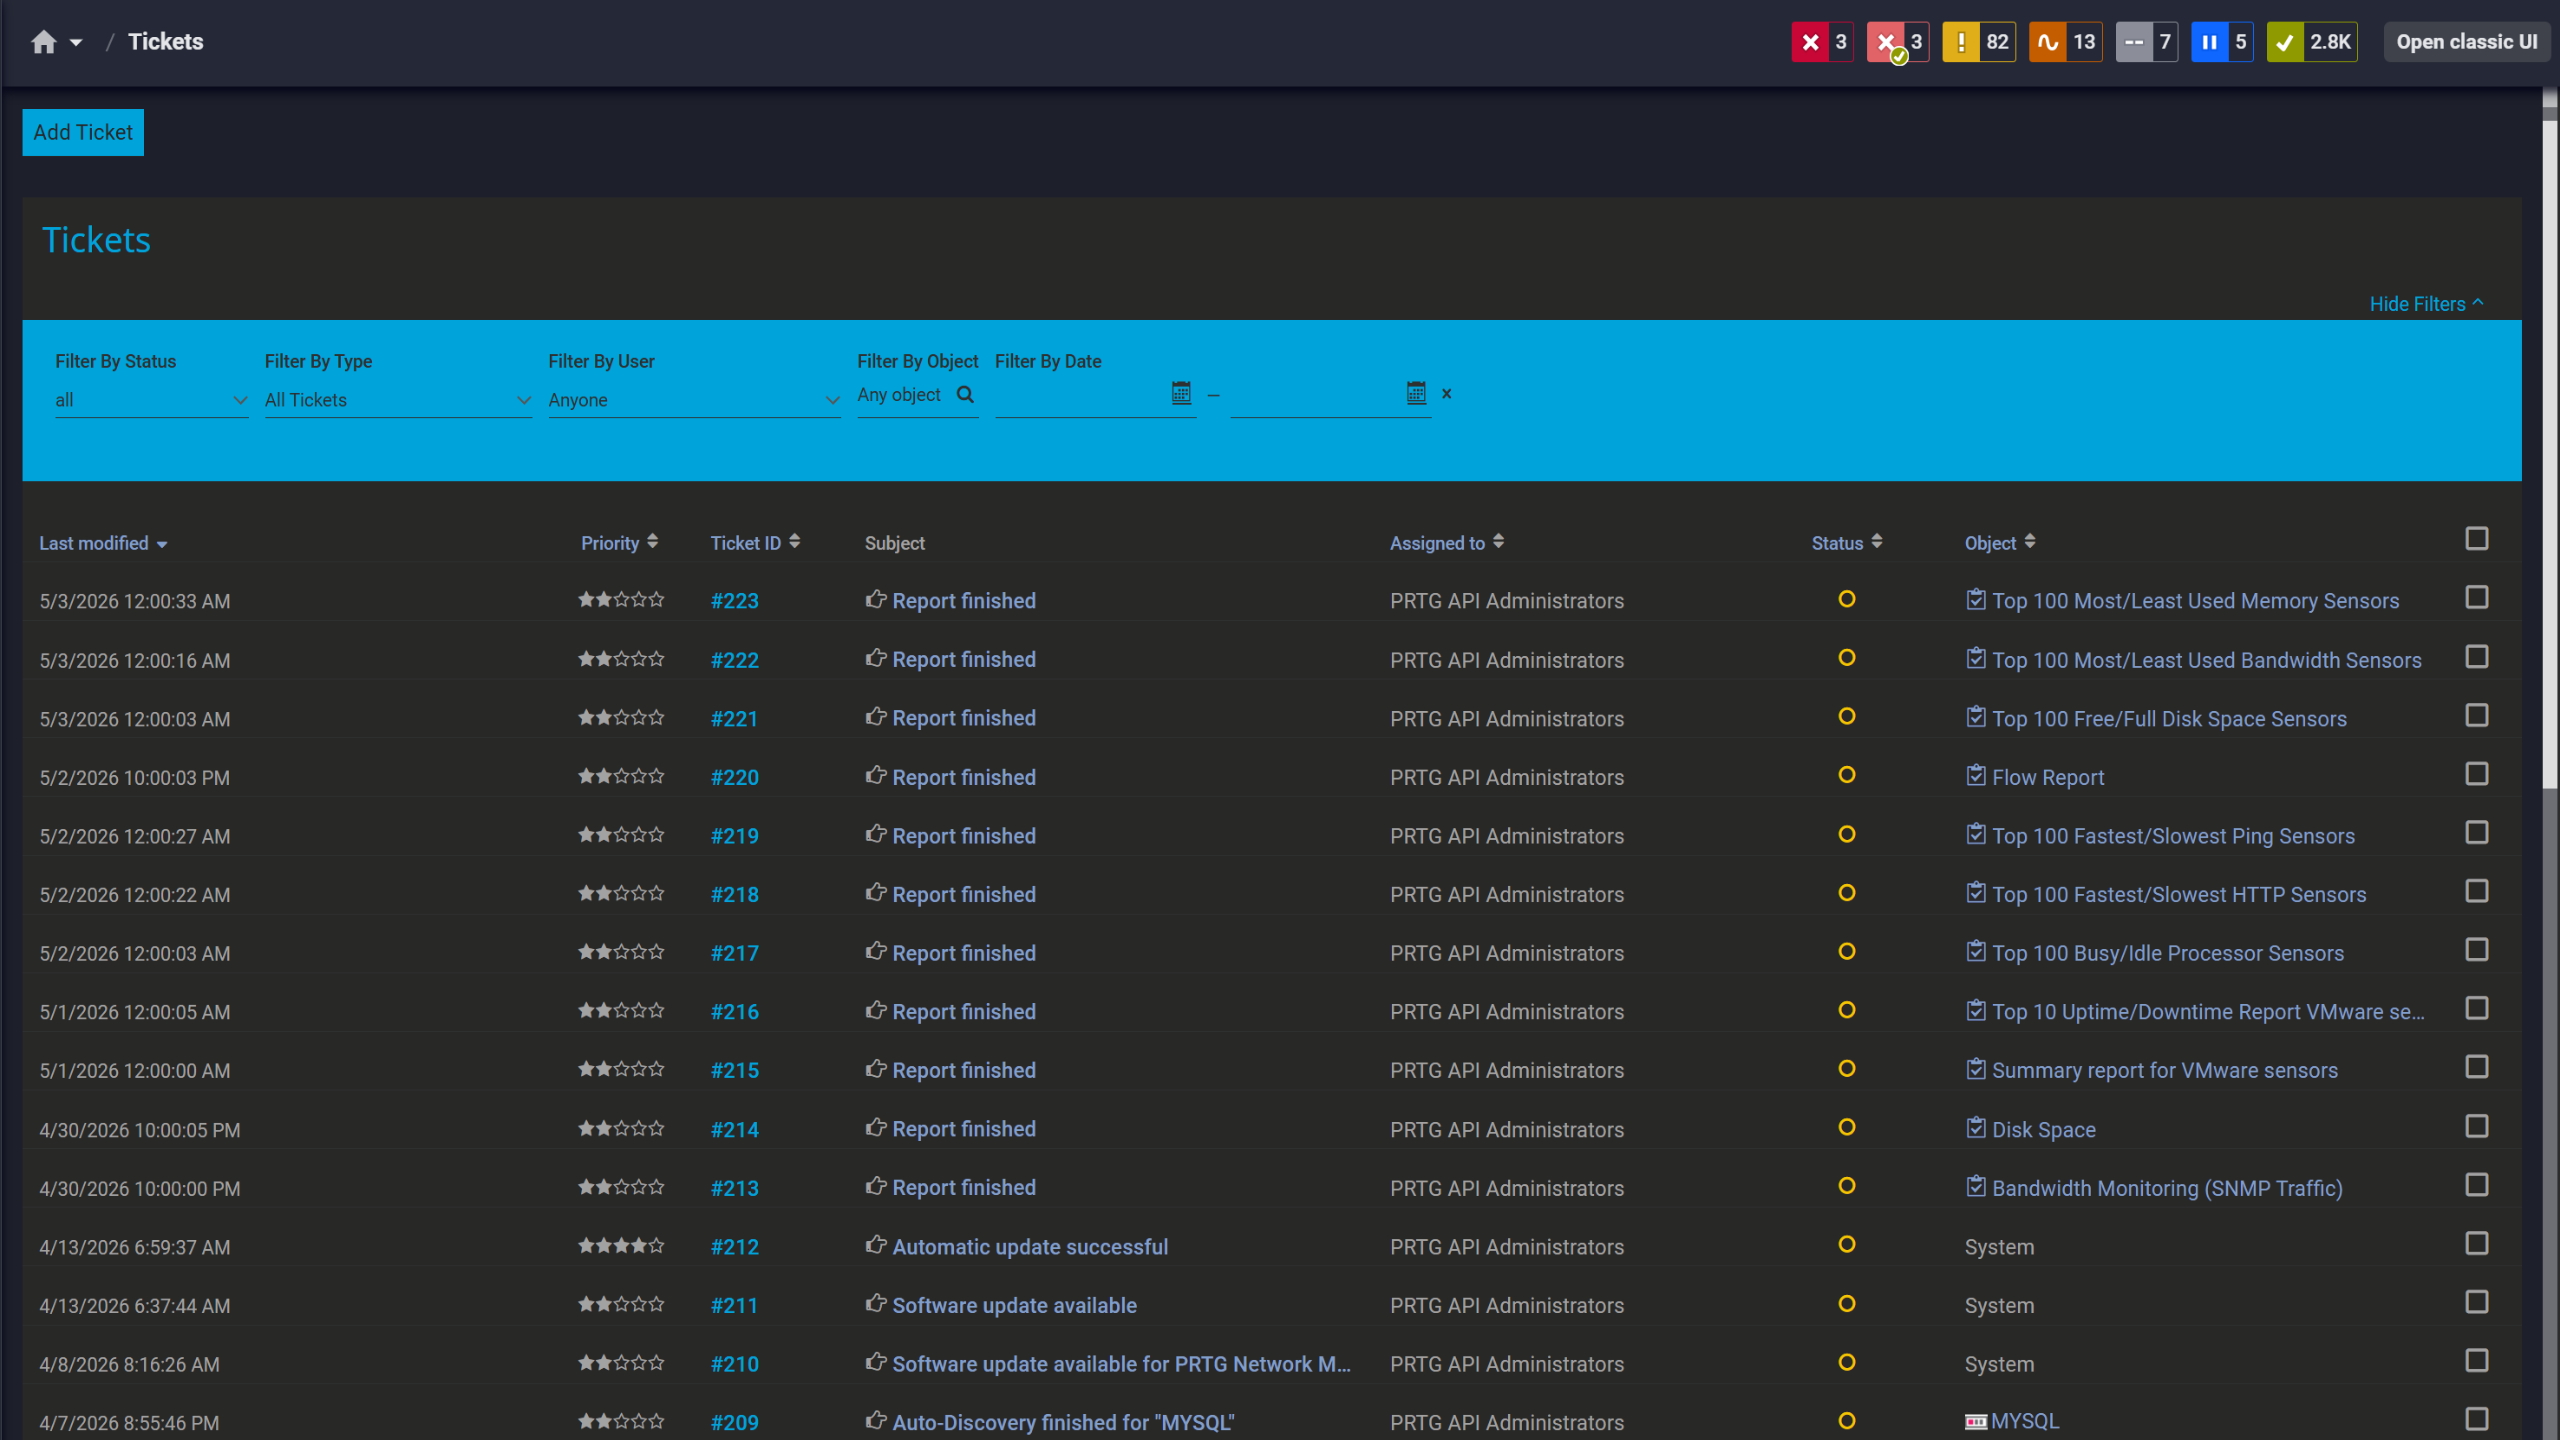
Tickets keep your team aligned

Historical Data, Reporting, and Long-Term Trend Analysis 

Protecting a solar investment over a 10 to 20 year lifespan requires more than alerts. Verifying a return on investment, reconciling net metering credits, demonstrating compliance for renewable energy credits, catching gradual efficiency losses in solar panels that never triggered an alarm: none of that is possible without years of stored telemetry.

PRTG stores time-series data for every monitored channel: DC input, AC output, inverter temperature, energy consumption counters, and more. Retention is configurable based on available disk space and storage plan. You're not locked into a vendor-defined window. Scheduled PDF, HTML, or CSV reports cover daily, monthly, or annual solar production for whoever needs the numbers. Historic graphs let you compare output periods, spot seasonal patterns and identify slow degradation over time to make informed decisions about maintenance and where to focus cost saving efforts.

Long-term visibility includes:

  • Monthly production reports in PDF or HTML for stakeholders, investors, or utility net-metering reconciliation
  • Trend graphs over months or years to catch gradual panel degradation or soiling losses. Requires manual analysis on your end. PRTG gives you the data, not the interpretation
  • Exportable datasets for ROI verification, energy bill cross-checks, or financial reporting integration
  • Configurable retention based on your compliance requirements and available storage. No fixed expiry.

Important note: PRTG provides historical data storage, trend visualization, and reporting. No native predictive analytics, automatic forecasting, or AI-driven anomaly detection. Those capabilities require external analytics platforms consuming PRTG's exported data.

How PRTG Monitors Solar Energy Production 

Your inverters already speak the protocols. Most commercial and industrial PV system equipment exposes telemetry via Modbus, SNMP, HTTP REST APIs, MQTT, or OPC UA: standard protocols used across IT and industrial automation. PRTG uses the same sensors you'd use to monitor network switches, servers, or industrial controllers, configured to read the specific registers, OIDs, or API endpoints your solar installation provides.

Modbus Sensor Setup

Modbus is the most widely supported protocol for solar inverters and power meters. DC input voltage, DC current, DC power, AC output power and frequency, inverter temperature, status codes, cumulative energy usage counters: it's all there if your device exposes it. SunSpec-compliant inverters standardize the register blocks, which speeds up initial setup considerably.

PRTG's Modbus TCP Custom sensor handles networked inverters; Modbus RTU Custom covers RS485 serial devices via gateways. Each sensor supports up to 10 numeric channels, configured per register address, data type, scaling factor, and units. That includes cumulative energy usage counters if your device exposes them. Worth noting: PRTG does not auto-discover register addresses. You need the map from your inverter manufacturer before you start.

REST and Push

Modern inverters, solar gateways, and cloud-connected data loggers either push telemetry as JSON or XML over HTTP, or expose cloud REST APIs for polling. SolarEdge and Enphase both fall into this category.

HTTP IoT Push Data Advanced sensors parse incoming JSON or XML and extract values into channels using JSONPath or XPath. REST Custom v2 sensors poll APIs on a schedule and map responses to channels via template files or inline JSONPath. Two things to sort out before you start: REST sensors need authentication configured for vendor APIs, and HTTP Push sensors require your gateway to reach the PRTG server, so check firewall rules early.

SNMP, MQTT, OPC UA 

Three protocols, three different use cases, and they don't overlap much in practice.

SNMP Custom Advanced sensors work for inverters, networked UPS units, or power meters that expose SNMP OIDs. If your manufacturer provides a MIB file, the SNMP Library sensor can auto-create sensors from it. For solar gateways or IoT-enabled inverters publishing telemetry to MQTT topics via a broker (Mosquitto, AWS IoT Core, Azure IoT Hub), use MQTT Subscribe or MQTT Statistics sensors. PRTG subscribes to the topics and extracts JSON payloads using JSONPath. OPC UA Custom sensors cover industrial solar plants, SCADA systems, or data aggregators exposing NodeIDs via OPC UA servers. Realistically, you'll only see that in large-scale commercial or utility installations where PLCs manage the inverter arrays.

Each protocol requires device support and proper credentials. SNMP v3 encryption adds CPU overhead, worth knowing before rolling it out at scale. MQTT needs broker and topic planning done upfront. OPC UA is the most complex of the three.

Custom Script Sensors

When your inverter or solar gateway uses a proprietary protocol or API format that PRTG's built-in sensors can't handle, you write a custom script. Python, PowerShell, Bash, or a compiled executable: the script fetches telemetry, parses it and returns JSON in PRTG's expected schema. The Script v2 sensor executes the script on the probe and maps the response into channels. EXE/Script Advanced does the same for scripts or binaries that return output to stdout.

Store the script on the PRTG probe, or on the remote probe for distributed sites. The script authenticates to the device or API, retrieves data, transforms it into JSON with channel definitions, and hands it back to PRTG. Requires scripting knowledge and the correct runtime installed on the probe. For distributed solar sites each remote probe needs its own copy of the script, so factor that into your deployment planning.

Dashboards and Reports

PRTG covers most of what solar operations teams actually need on the visualization side: custom geographic or logical maps for multi-site arrays, live dashboards with sensor graphs and status widgets, scheduled PDF/HTML/CSV reports, and raw data export via API for energy management systems or external analytics platforms.

Build dashboards by dragging sensors, graphs, tables, and gauges onto a canvas. The interface is user-friendly enough that  facility managers typically handle their own dashboard setup without IT involvement. The map designer lets you place solar sites on geographic maps and link them to device groups. For reporting, use PRTG's built-in engine or pull raw channel data via the HTTP API into Tableau, Power BI, Grafana, or a custom platform.

Also worth noting: dashboard and map setup takes time. No one-click solar template. Forecasting, predictive maintenance, and anomaly detection are not part of what PRTG does. PRTG gives you the data foundation. The analytics layer is external.

free downLoad

PRTG vs. Manufacturer Portals: What’s the Difference?

Feature

Manufacturer Portals

Manufacturer Portals

PRTG

PRTG

Cross-vendor visibility

Manufacturer Portals
not included

Siloed per manufacturer

PRTG
included

Protocol-based. Monitor any brand in one platform.

Alerting flexibility

Manufacturer Portals
not included

Limited, basic fault notifications

PRTG
included

Fully customizable per-channel thresholds with escalation routing

IT infrastructure integration

Manufacturer Portals
not included

Solar-only, separate from IT monitoring

PRTG
included

Consolidates solar, network, servers, and facilities in one place

Data retention

Manufacturer Portals
not included

Vendor-controlled, often 1 to 3 years

PRTG
included

Configurable. Limited by your storage plan, not a vendor decision.

Data export

Manufacturer Portals
not included

Limited or manual

PRTG
included

API-driven raw data export in CSV, JSON, or XML

Monitoring capabilities

Manufacturer Portals
not included

Device-specific only

PRTG
included

Cross-vendor, cross-protocol, cross-infrastructure

Inverter firmware/settings

Manufacturer Portals
not included

Full access to device-specific controls

PRTG
included

Monitoring and alerting only. No firmware management.

Bottom line: Manufacturer portals provide deep inverter-specific features (firmware updates, configuration changes). PRTG focuses on cross-device visibility, flexible alerting, and long-term data retention for operations and IT teams. Many users keep both: vendor portals for inverter configuration, PRTG for operational monitoring and cross-system troubleshooting.

free downLoad

“In all our tests, PRTG was significantly more reliable and, above all, faster than classic DCIM solutions. We need a solution that gives us a real-time overview of the status of all the data centers we monitor and does not make us wait for what feels like minutes with every click. With PRTG, we have found that solution.”

Ronald Kok, CEO
All IT Rooms

“PRTG is an easy-to-use and comprehensive solution to monitor our Industrial Automation DataCenter (IADC)”

Benjamin Lauterlein, Product Manager
Siemens AG

“We went to the market and looked for a tool that was cost effective, but more importantly, could monitor most or all the items in the data center. PRTG was this tool.”

Lydia Muzar
CLICK-into

Paessler PRTG Network Monitor licenses & pricing

Choose the PRTG Network Monitor subscription that's best for you.

License NameLicense descriptionPriceLicense DetailsGet startedPricing Details
PRTG 500$200per month paid annuallyBuy nowBuy now

Enough to monitor multiple aspects of 50 devices

PRTG 1000$358per month paid annuallyBuy nowBuy now

Enough to monitor multiple aspects of 100 devices

PRTG 2500$742per month paid annuallyBuy nowBuy now

Enough to monitor multiple aspects of 250 devices

PRTG 5000$1,300per month paid annuallyBuy nowBuy now

Enough to monitor multiple aspects of 500 devices

PRTG 10000$1,642per month paid annuallyBuy nowBuy now

Enough to monitor multiple aspects of 1000 devices

Over 100,000 Customers Worldwide Love Paessler  

customer success stories

 Solar Energy Production Monitoring: Frequently Asked Questions


Which solar inverters can PRTG monitor?

Anything that speaks an open protocol. Modbus TCP/RTU, SNMP, REST APIs, MQTT, OPC UA. In practice that means most commercial and industrial inverters from SMA, SolarEdge, Fronius, Huawei, Sungrow. SunSpec-compliant devices are the easiest starting point. Where it gets complicated is consumer-grade or cloud-only hardware that doesn't expose a local interface at all. Those need either a gateway or manufacturer API access, and that adds a dependency you want to know about before you start, not halfway through setup.

Is the setup plug-and-play?

No, not really. SunSpec Modbus is the closest you'll get to straightforward, but you're still going to spend time on register mapping or REST templates depending on what your inverter exposes. Budget an afternoon minimum, more if the manufacturer documentation is bad. Which it sometimes is.

Can PRTG predict inverter failures or do predictive maintenance?

No. Threshold alerts, historical trends, telemetry storage. That's what PRTG does. If a value goes outside the range you defined, you get notified. It won't tell you a failure is coming before the numbers move. For actual predictive maintenance you'd need to push PRTG's data into an external analytics platform that does forecasting.

How long is data stored, and can I generate reports?

As long as your disk holds out. Retention isn't set by a vendor policy, it's just storage. PDF, HTML, CSV reports on whatever time range you need, scheduled or on demand. If you're planning multi-year retention for ROI tracking or compliance, size your storage accordingly upfront. It's one of those things that's annoying to fix retroactively.

Do I need remote probes for multi-site solar installations?

Depends on your network topology. Separate networks, NAT, geographically distributed sites: yes, a remote probe at each location makes sense. If you've got a gateway on-site that can push telemetry via HTTP or MQTT to a central PRTG instance that works too, and sometimes it's the simpler option.

What about PRTG subscriptions and sensor limits?

PRTG offers sensor-based subscriptiontiers: 500, 1000, 2500, 5000, unlimited. Each device or endpoint you monitor counts as one or more sensors depending on how many metrics you pull from it. Script v2 and multi-channel REST sensors are heavier on probe resources than basic SNMP. On larger deployments spread the load across remote probes.

Can PRTG integrate alerts with my ITSM or SIEM platform?

Yes. Webhooks for ServiceNow, Jira, Zendesk. Syslog for Splunk, QRadar, ArcSight. SNMP traps, email, SMS. The API covers anything else.

Can PRTG replace manufacturer dashboards entirely?

For monitoring and alerting, mostly yes. For actually managing devices, no. Firmware updates, configuration changes, inverter-specific diagnostics: that still lives in the manufacturer portal. Most teams keep both running and use PRTG for the operational picture and cross-system correlation, vendor portals when they need to touch the device itself.

Paessler PRTG

Paessler PRTG

Network Monitoring Software – Version 26.1.116.1532 (February 9th, 2026)

Hosting icon

Hosting

Download for Windows and cloud-based version PRTG Hosted Monitor available

Languages icon

Languages

English, German, Spanish, French, Portuguese, Dutch, Russian, Japanese, and Simplified Chinese

test

Monitor everything

Network devices, bandwidth, servers, applications, virtual environments, remote systems, IoT, and more

test

Pricing

Choose the PRTG Network Monitor subscription that's best for you

Discover more monitoring insights and stories

Content illustration

Powerful stories from the monitoring world

  • GRUPOTEC keeps an eye on solar energy production with Paessler ...
  • All about IT, Monitoring, and PRTG
  • All about IT, Monitoring, and PRTG
Support illustration

Resources to master your monitoring challenges

  • How can I propose new features or sensors for PRTG?
  • Device and Sensor Setup
  • I run PRTG on VMware. How can I obtain best performance?
Solution illustration

Solutions for all your monitoring needs

  • Solar Energy Production Monitoring
  • Monitoring Data Centers
  • Energy Efficiency Monitoring
PRTG Logo

Start Monitoring with PRTG and see how it can make your network more reliable and your job easier.

Free download
PRODUCT OVERVIEW

Products

  • Paessler PRTG
    Paessler PRTGMonitor your whole IT infrastructure
    • PRTG Network Monitor
    • PRTG Enterprise Monitor
    • PRTG Hosted Monitor
    • PRTG UVexplorer
    • PRTG extensions
      Extensions for Paessler PRTGExtend your monitoring to a new level
  • Icon Features
    FeaturesExplore all monitoring features

Monitoring with PRTG

  • Network monitoring
  • Bandwidth monitoring
  • SNMP monitoring
  • Network mapping
  • Wi-Fi monitoring
  • Server monitoring
  • Network traffic analyzer
  • NetFlow monitoring
  • Syslog server

Useful Links

  • PRTG Manual
  • Knowledge Base
  • Customer Success Stories
  • About Paessler
  • Subscribe to newsletter
  • PRTG Support
  • PRTG Consulting
  • PRTG Feedback & Roadmap

Contact

Paessler GmbH
Thurn-und-Taxis-Str. 14, 
90411 Nuremberg 
Germany

[email protected]

+49 911 93775-0

  • Contact us
©2026 Paessler GmbHTerms & ConditionsPrivacy PolicyImprintReport VulnerabilityDownload & InstallSitemap
Manual License Activation Manual License Activation Manual License Activation