Custom alerts and data visualizations let you quickly identify and prevent low storage space, downtime, bandwidth bottlenecks, and other performance issues.
Monitoring QNAP NAS devices with generic tools is like configuring a server manually. Or, well… eating soup with a fork.
Possible. But why go through all that trouble, when there are dedicated tools that make the process much easier?
Paessler PRTG's purpose-built sensors are designed to work seamlessly with any QNAP-manufactured NAS device. That means setup is much quicker. And, more importantly, your QNAP network environment is more comprehensive, accurate, and reliable. Because, to do a specialized task well, you need a specialist tool.

And when we say simple, we mean PRTG will handle most of the work. Our Auto-Discovery scans your network for QNAP devices on launch, and adds them to your monitoring environment.
That's it. Really. Once they're in your dashboard, PRTG starts tracking them straight away.
Addressing low memory, downtime, bottlenecks that can slow down access to data, and other performance issues is great. But preventing them from happening is much, much better.
PRTG automatically alerts you via email, SMS, or push notification (with our mobile apps for iOS and Andoid) when important health indicators are at risk of underperforming, so you can swoop in and save the day.
As QNAP NAS systems often contain multiple physical hard disks which in turn are combined with logical disks, monitoring them can become complex. Not with PRTG.
Keep an eye on the remaining amount of storage space, make sure backups work correctly and storage capacity is properly distributed – all from one central place.
PRTG can monitor NAS devices by other manufacturers too, including Buffalo TS, LenovoEMC, and Synology. In fact, while you're at it, while not keep an eye on your whole network?
With more than 250 preconfigured sensors, PRTG makes this a quick and straightforward process.
Diagnose network issues by continuously tracking physical and logical drives and system health, next to virtual machines (VMs), access control devices, Wi-Fi routers, and all other components that make up your network. Show availability, storage, traffic, and other key metrics in real time. Visualize monitoring data in clear graphs and dashboards to identify problems more easily. Gain the overview you need to troubleshoot bottlenecks, underperformance, and other NAS-related network issues.

Device tree view of the complete monitoring setup

Custom PRTG dashboard for keeping an eye on the entire IT infrastructure

Live traffic data graph in PRTG
“All-around winning
network monitor”
“The real beauty of PRTG is the endless possibilities it offers”
“PRTG Network Monitor
is very hard to beat”
PRTG comes with more than 250 native sensor types for monitoring your entire on-premises, cloud, and hybrid cloud environment out of the box. Check out some examples below!
The SNMP QNAP Physical Disk sensor monitors a physical disk in a Quality Network Appliance Provider (QNAP) network-attached storage (NAS) . It can show the following:
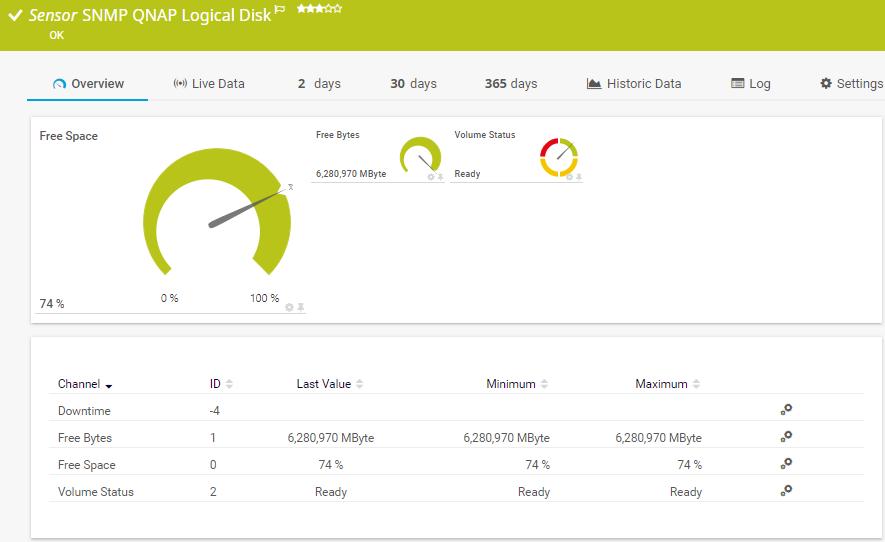
The SNMP QNAP Logical Disk sensor monitors a logical disk in a Quality Network Appliance Provider (QNAP) network-attached storage (NAS) . It can show the following:
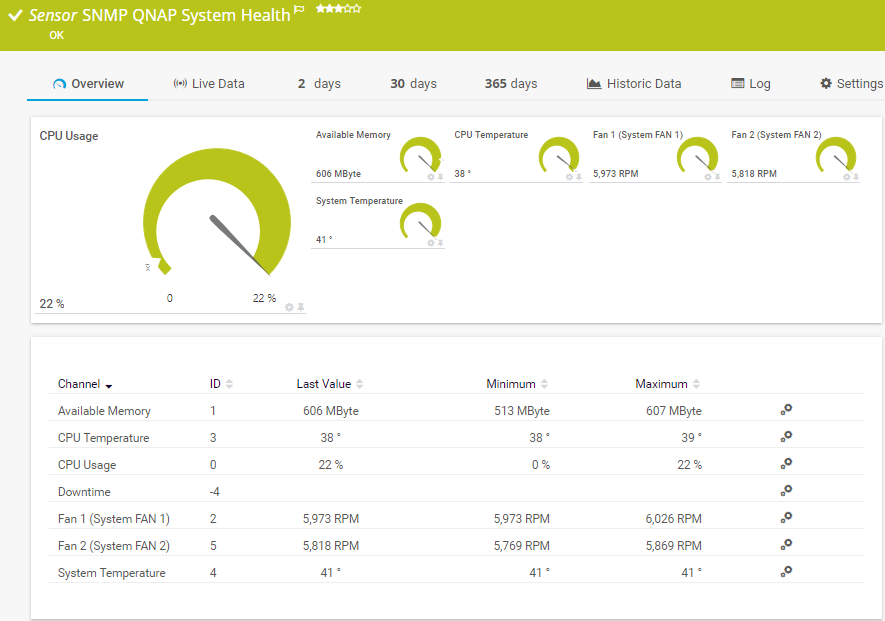
The SNMP QNAP System Health sensor monitors the system health of a Quality Network Appliance Provider (QNAP) network-attached storage (NAS) . It can show the following:
See the PRTG Manual for a list of all available sensor types.

Real-time notifications mean faster troubleshooting so that you can act before more serious issues occur.
PRTG is set up in a matter of minutes and can be used on a wide variety of mobile devices.


“Excellent tool for detailed monitoring. Alarms and notifications work greatly. Equipment addition is straight forward and server initial setup is very easy. ...feel safe to purchase it if you intend to monitor a large networking landscape.”
Partnering with innovative IT vendors, Paessler unleashes synergies to create
new and additional benefits for joined customers.
IT that works constitutes a business-critical basis for a company's success. Availability and security must be defined for the respective purpose and closely monitored – by OT and IT alike.
Integrating monitoring results from PRTG into NetBrain maps makes the foundation for network automation.
With ScriptRunner Paessler integrates a powerful event automation platform into PRTG Network Monitor.
Custom alerts and data visualizations let you quickly identify and prevent low storage space, downtime, bandwidth bottlenecks, and other performance issues.
Network Monitoring Software – Version 26.1.116.1532 (February 9th, 2026)
Download for Windows and cloud-based version PRTG Hosted Monitor available
English, German, Spanish, French, Portuguese, Dutch, Russian, Japanese, and Simplified Chinese
Network devices, bandwidth, servers, applications, virtual environments, remote systems, IoT, and more
Choose the PRTG Network Monitor subscription that's best for you


QNAP is a company from Taiwan and stands for “Quality Network Appliance Provider”. QNAP Systems, Inc. offers network solutions for file sharing and virtualization and is also a well-known manufacturer of NAS (Network Attached Storage) devices.
QNAP monitoring is nothing means monitoring NAS systems from the manufacturer QNAP. Among other things, it lets you monitor:
QNAP monitoring software like PRTG lets you keep a constant eye on all these values and parameters. As a result, you'll ensure data is safely stored and easily accessible at all times.
PRTG is a proprietary network management and monitoring tool that tracks and analyzes any QNAP device that's connected to your LAN, WAN, or VPN. Available for Windows- and Linux-based systems or as a cloud-hosted solution, it helps you spot storage, memory, traffic, speed, and other issues, so you can prevent bottlenecks and ensure your organization's critical data remains secure.
PRTG's sensors monitor QNAP devices using SNMP. Each sensor tracks a specific parameter. Pick your preferred warning and error thresholds, and you'll get a text, email, or in-app notification if performance is at risk of falling below them.
First things first, make sure you meet the system requirements and that SNMP is enabled on both your network and your NAS devices. In QNAP, the "Enable SNMP" toggle switch is on the control panel's homepage. In Windows, you'll find it in the system settings. Once that's done, double-click the .exe file. PRTG will automatically detect any SNMP-enabled QNAP devices on your network and add them to your monitoring environment.
In PRTG, “sensors” are the basic monitoring elements. One sensor usually monitors one measured value in your network, for example the traffic of a switch port, the CPU load of a server, or the free space on a disk drive. On average, you need about 5-10 sensors per device or one sensor per switch port.
Paessler conducted trials in over 600 IT departments worldwide to tune its network monitoring software closer to the needs of sysadmins. The result of the survey: over 95% of the participants would recommend PRTG – or already have.

Paessler PRTG is used by companies of all sizes. Sysadmins love PRTG because it makes their job a whole lot easier.
Bandwidth, servers, virtual environments, websites, VoIP services – PRTG keeps an eye on your entire network.
Everyone has different monitoring needs. That’s why we let you try PRTG for free.