
- English
- Deutsch
- Español
- Français
- Italiano
- Português
Monitoring a single Synology NAS through DSM is straightforward enough. The problem shows up when you have ten, fifty, or two hundred of them spread across sites, subnets, and locations. Logging into each DSM control panel individually to check disk status, volume health, and system temperatures stops being practical fast. What most teams need is a single view that covers all devices without manual polling.
Paessler PRTG connects to Synology DiskStation and RackStation devices via SNMP, collecting system health data, physical disk status, logical volume capacity, and performance metrics across the full fleet. Enable SNMP in DSM, run auto-discovery, and preconfigured sensors appear without manual configuration per device. The same threshold-based alerting applies whether you have one unit at HQ or hundreds at remote sites, with remote probes bringing distributed locations into a single centralized view. Supported protocols include SNMP v2c and v3 for system health, disk, and capacity monitoring, plus Network Share (SMB/CIFS) sensors for backup destination verification and File and Folder sensors for log monitoring.

With several Synology DSM boxes on different subnets or locations, checking each DSM control panel separately gets slow fast. Hardware and disk problems are easy to miss in the gaps between manual checks. At 20 or 200 Synology devices, you need centralized visibility, not hours of dashboard-hopping every week.
PRTG auto-discovers Synology devices once SNMP is enabled and applies predefined templates so sensors start collecting SNMP metrics right away. One dashboard covers current status, trends, and alerts for all NAS devices. Whether your units are on the same local network or spread across remote sites via VPN, PRTG remote probes bring everything into one view.
What that looks like in practice:
Synology hardware gives you early signals worth acting on. Temperature readings, fan status, physical disk condition, these metrics are available continuously if you're collecting them. PRTG uses SNMP Synology System Health, Physical Disk, and Logical Disk sensors to track hardware and volume status across your devices. Set threshold-based alerts and your team gets notified when conditions shift, with enough lead time to schedule maintenance rather than respond to an outage. Historical data also helps narrow down root causes faster when correlating metrics with performance changes.
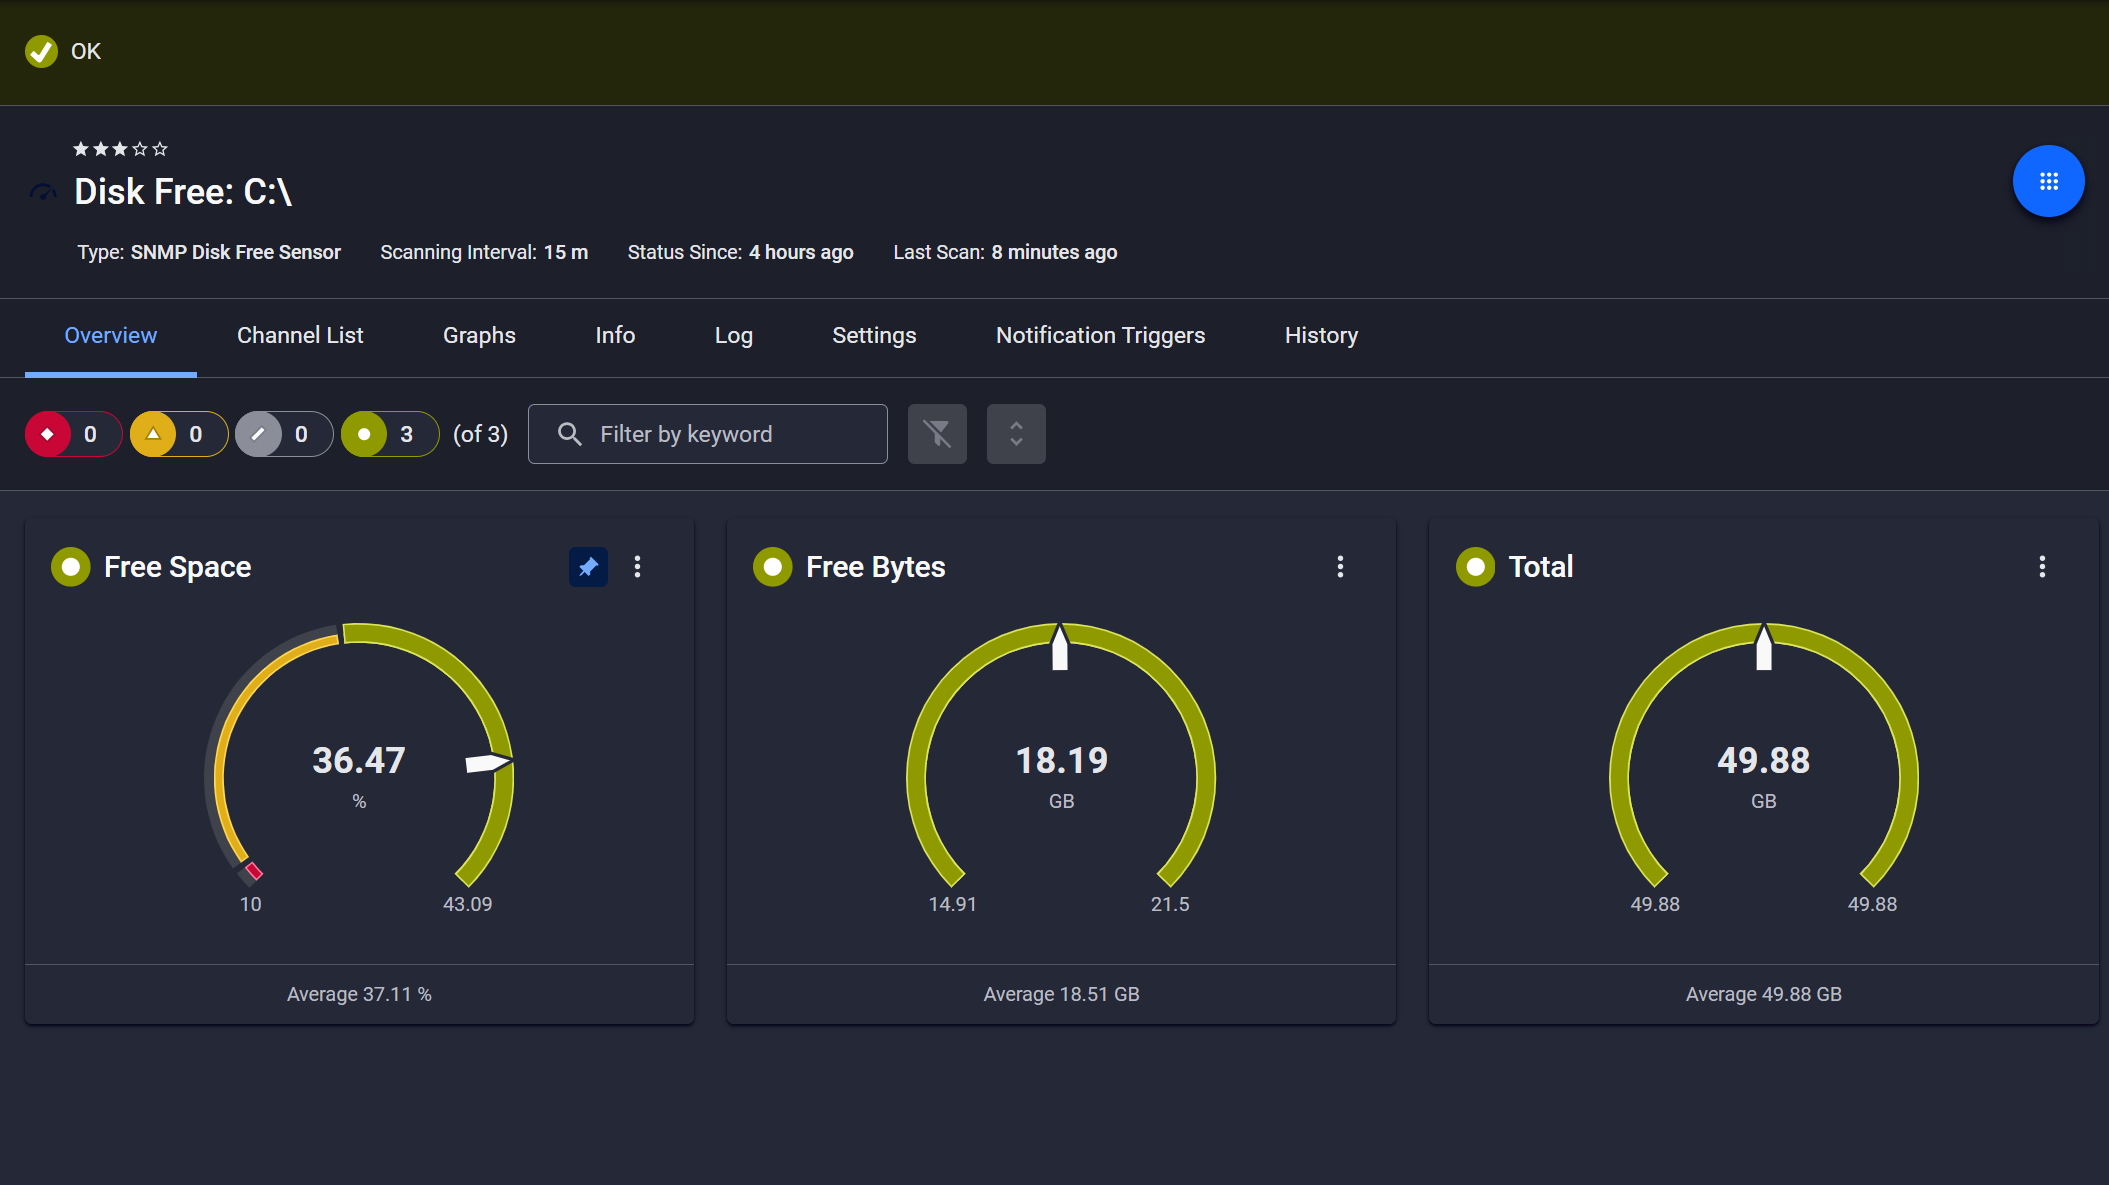
Disk space monitored, alerts ready
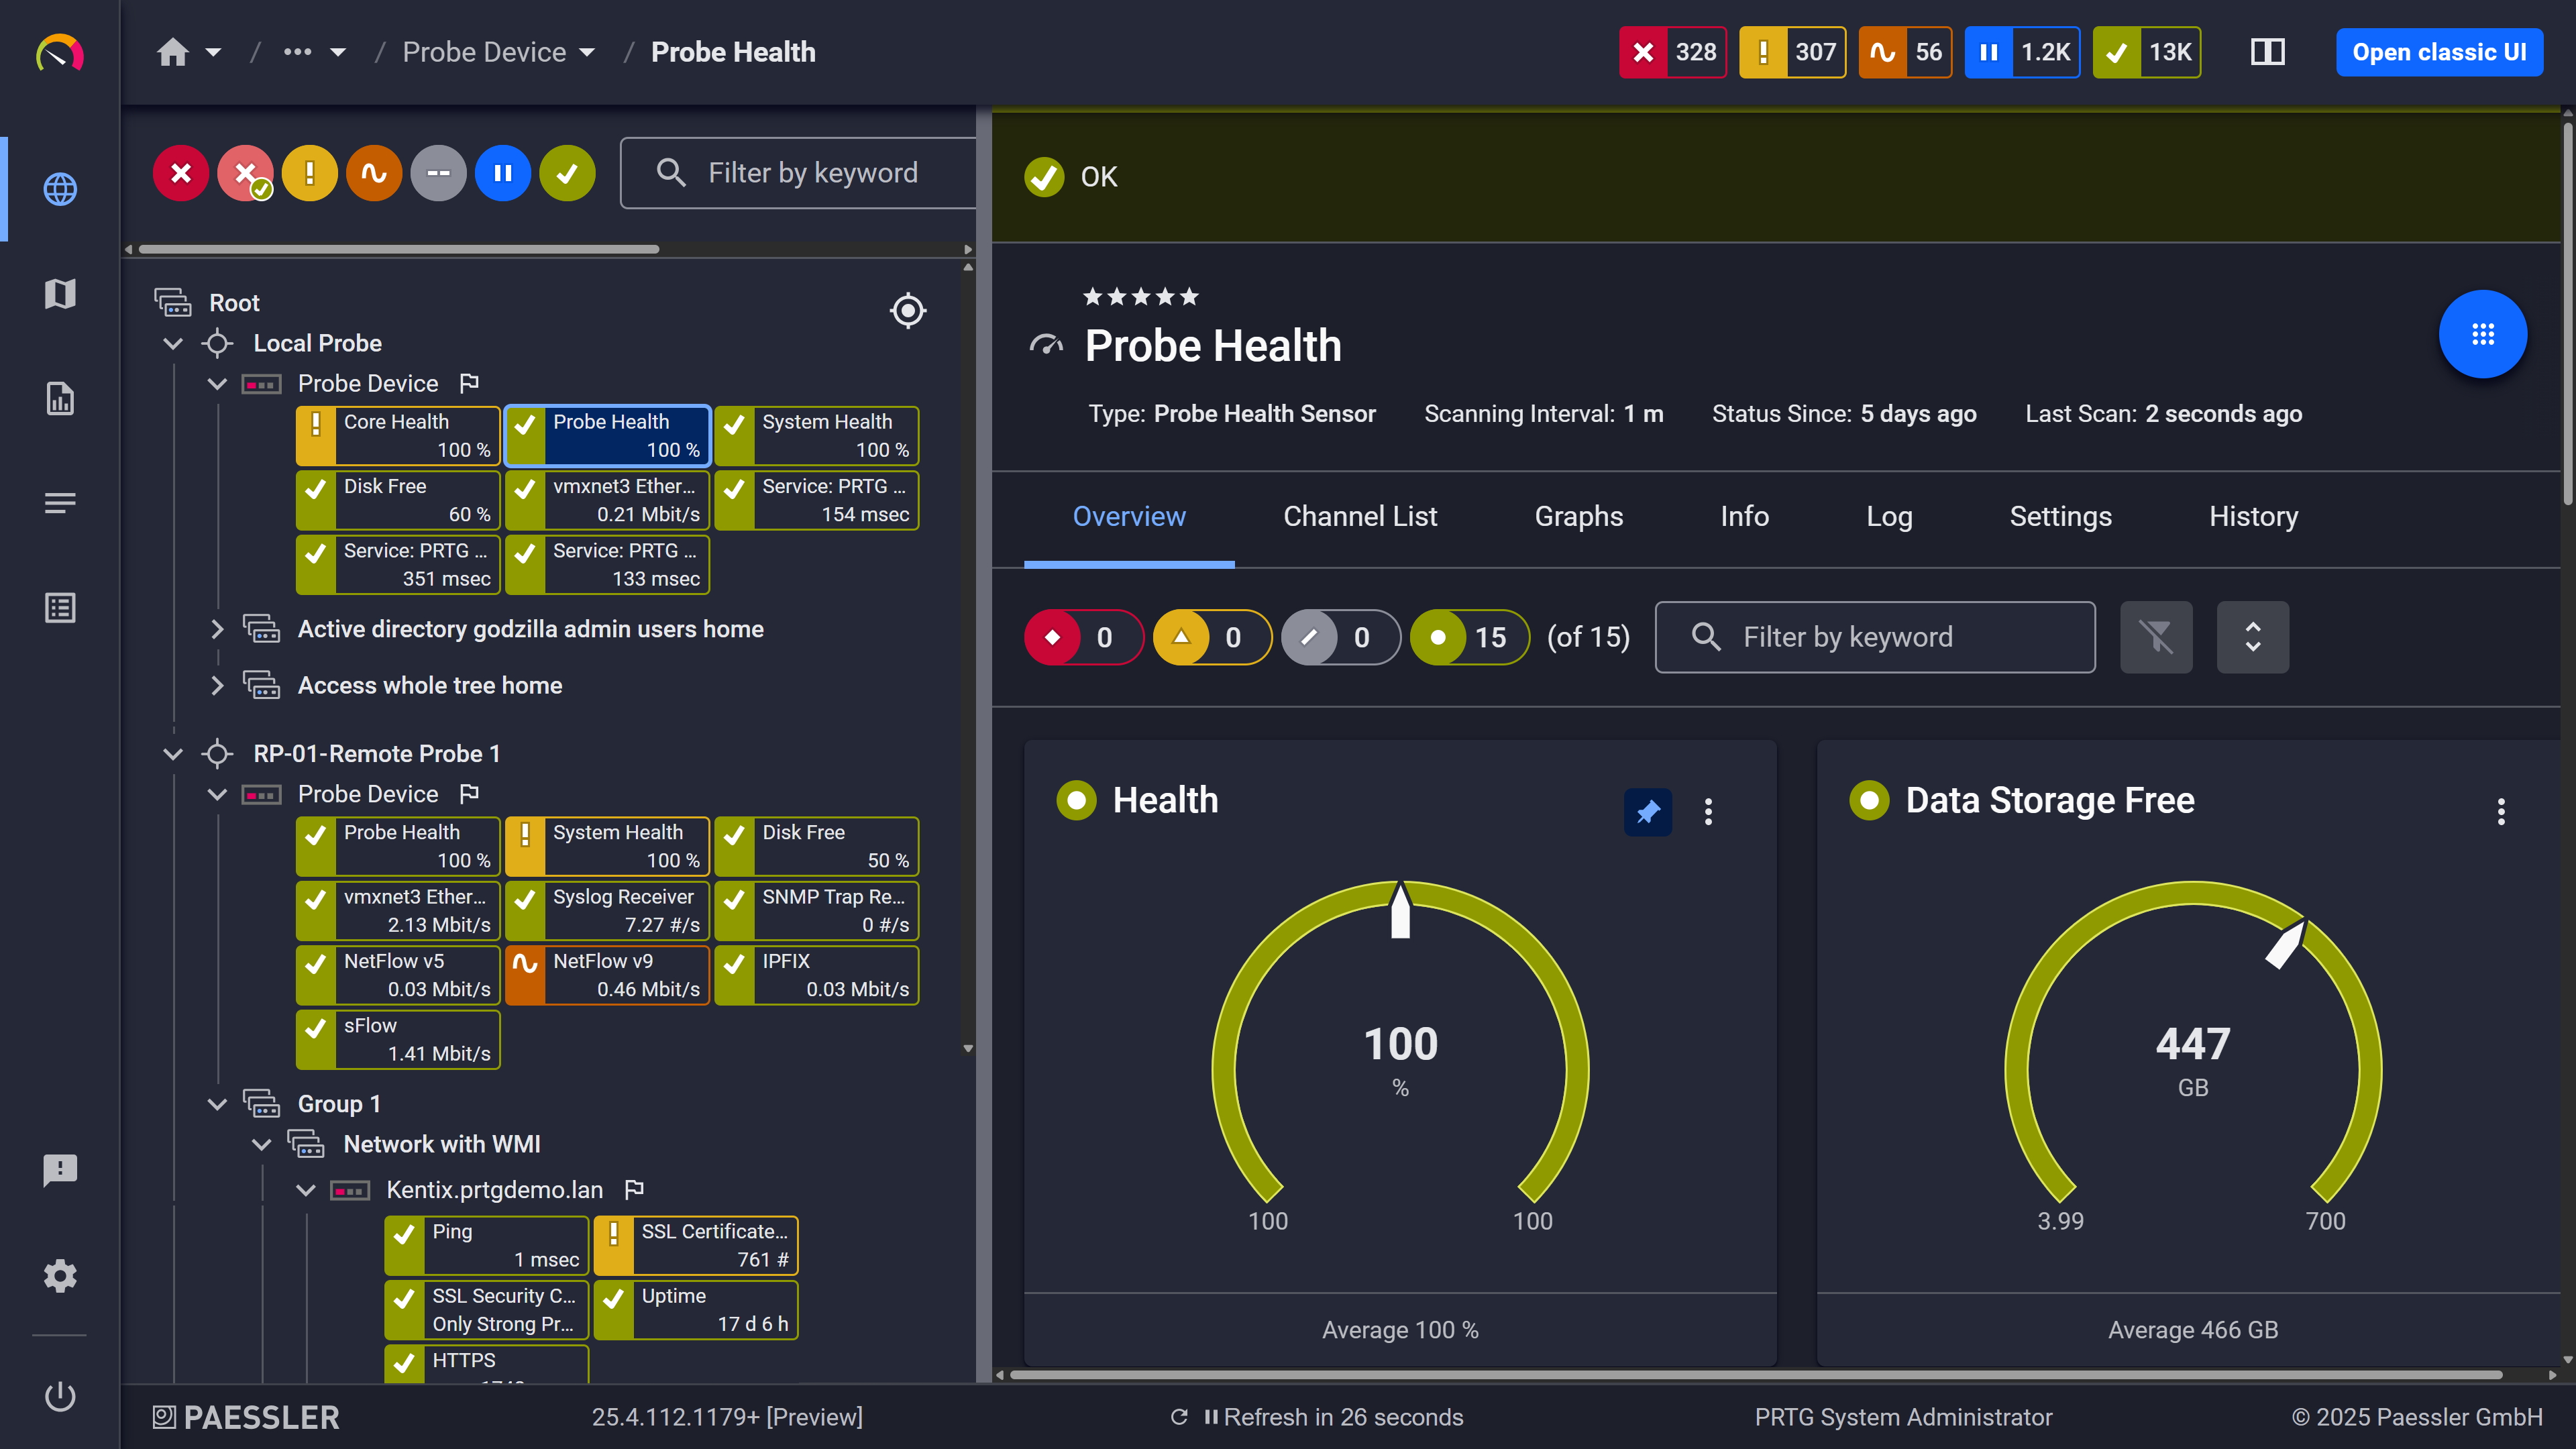
Probe health at a glance

Live graphs, real-time performance data
Synology volumes expose their health state through SNMP, and PRTG surfaces that data continuously. The SNMP Synology Logical Disk sensor tracks each volume's operational status and alerts when it enters a Warning or Down condition, including states like Repairing, Syncing, Degrade, or Crashed. Your team knows about the condition at the next scan interval, with time to investigate before backup jobs, snapshots, or recordings are affected.
Start monitoring your infrastructure in minutes. No professional services, no complex configuration, no risk.
Grafana-based stacks require Docker containers, SNMP exporters, custom dashboards, and ongoing maintenance. For a lean IT team already handling servers, networks, backups, and user support, that's a real time investment before you see a single metric.
PRTG provides auto-discovery and device templates that create the right sensors for physical disk, logical disk, and system health automatically. Enable SNMP on your Synology units, run auto-discovery, sensors appear. No scripting. If you need additional OIDs beyond the predefined sensors, PRTG supports MIB files and SNMP Library or SNMP Custom sensors. Worth noting that requires correct SNMP and MIB support on the DSM side.

Scheduled reports, always on time

Full device list, instant overview
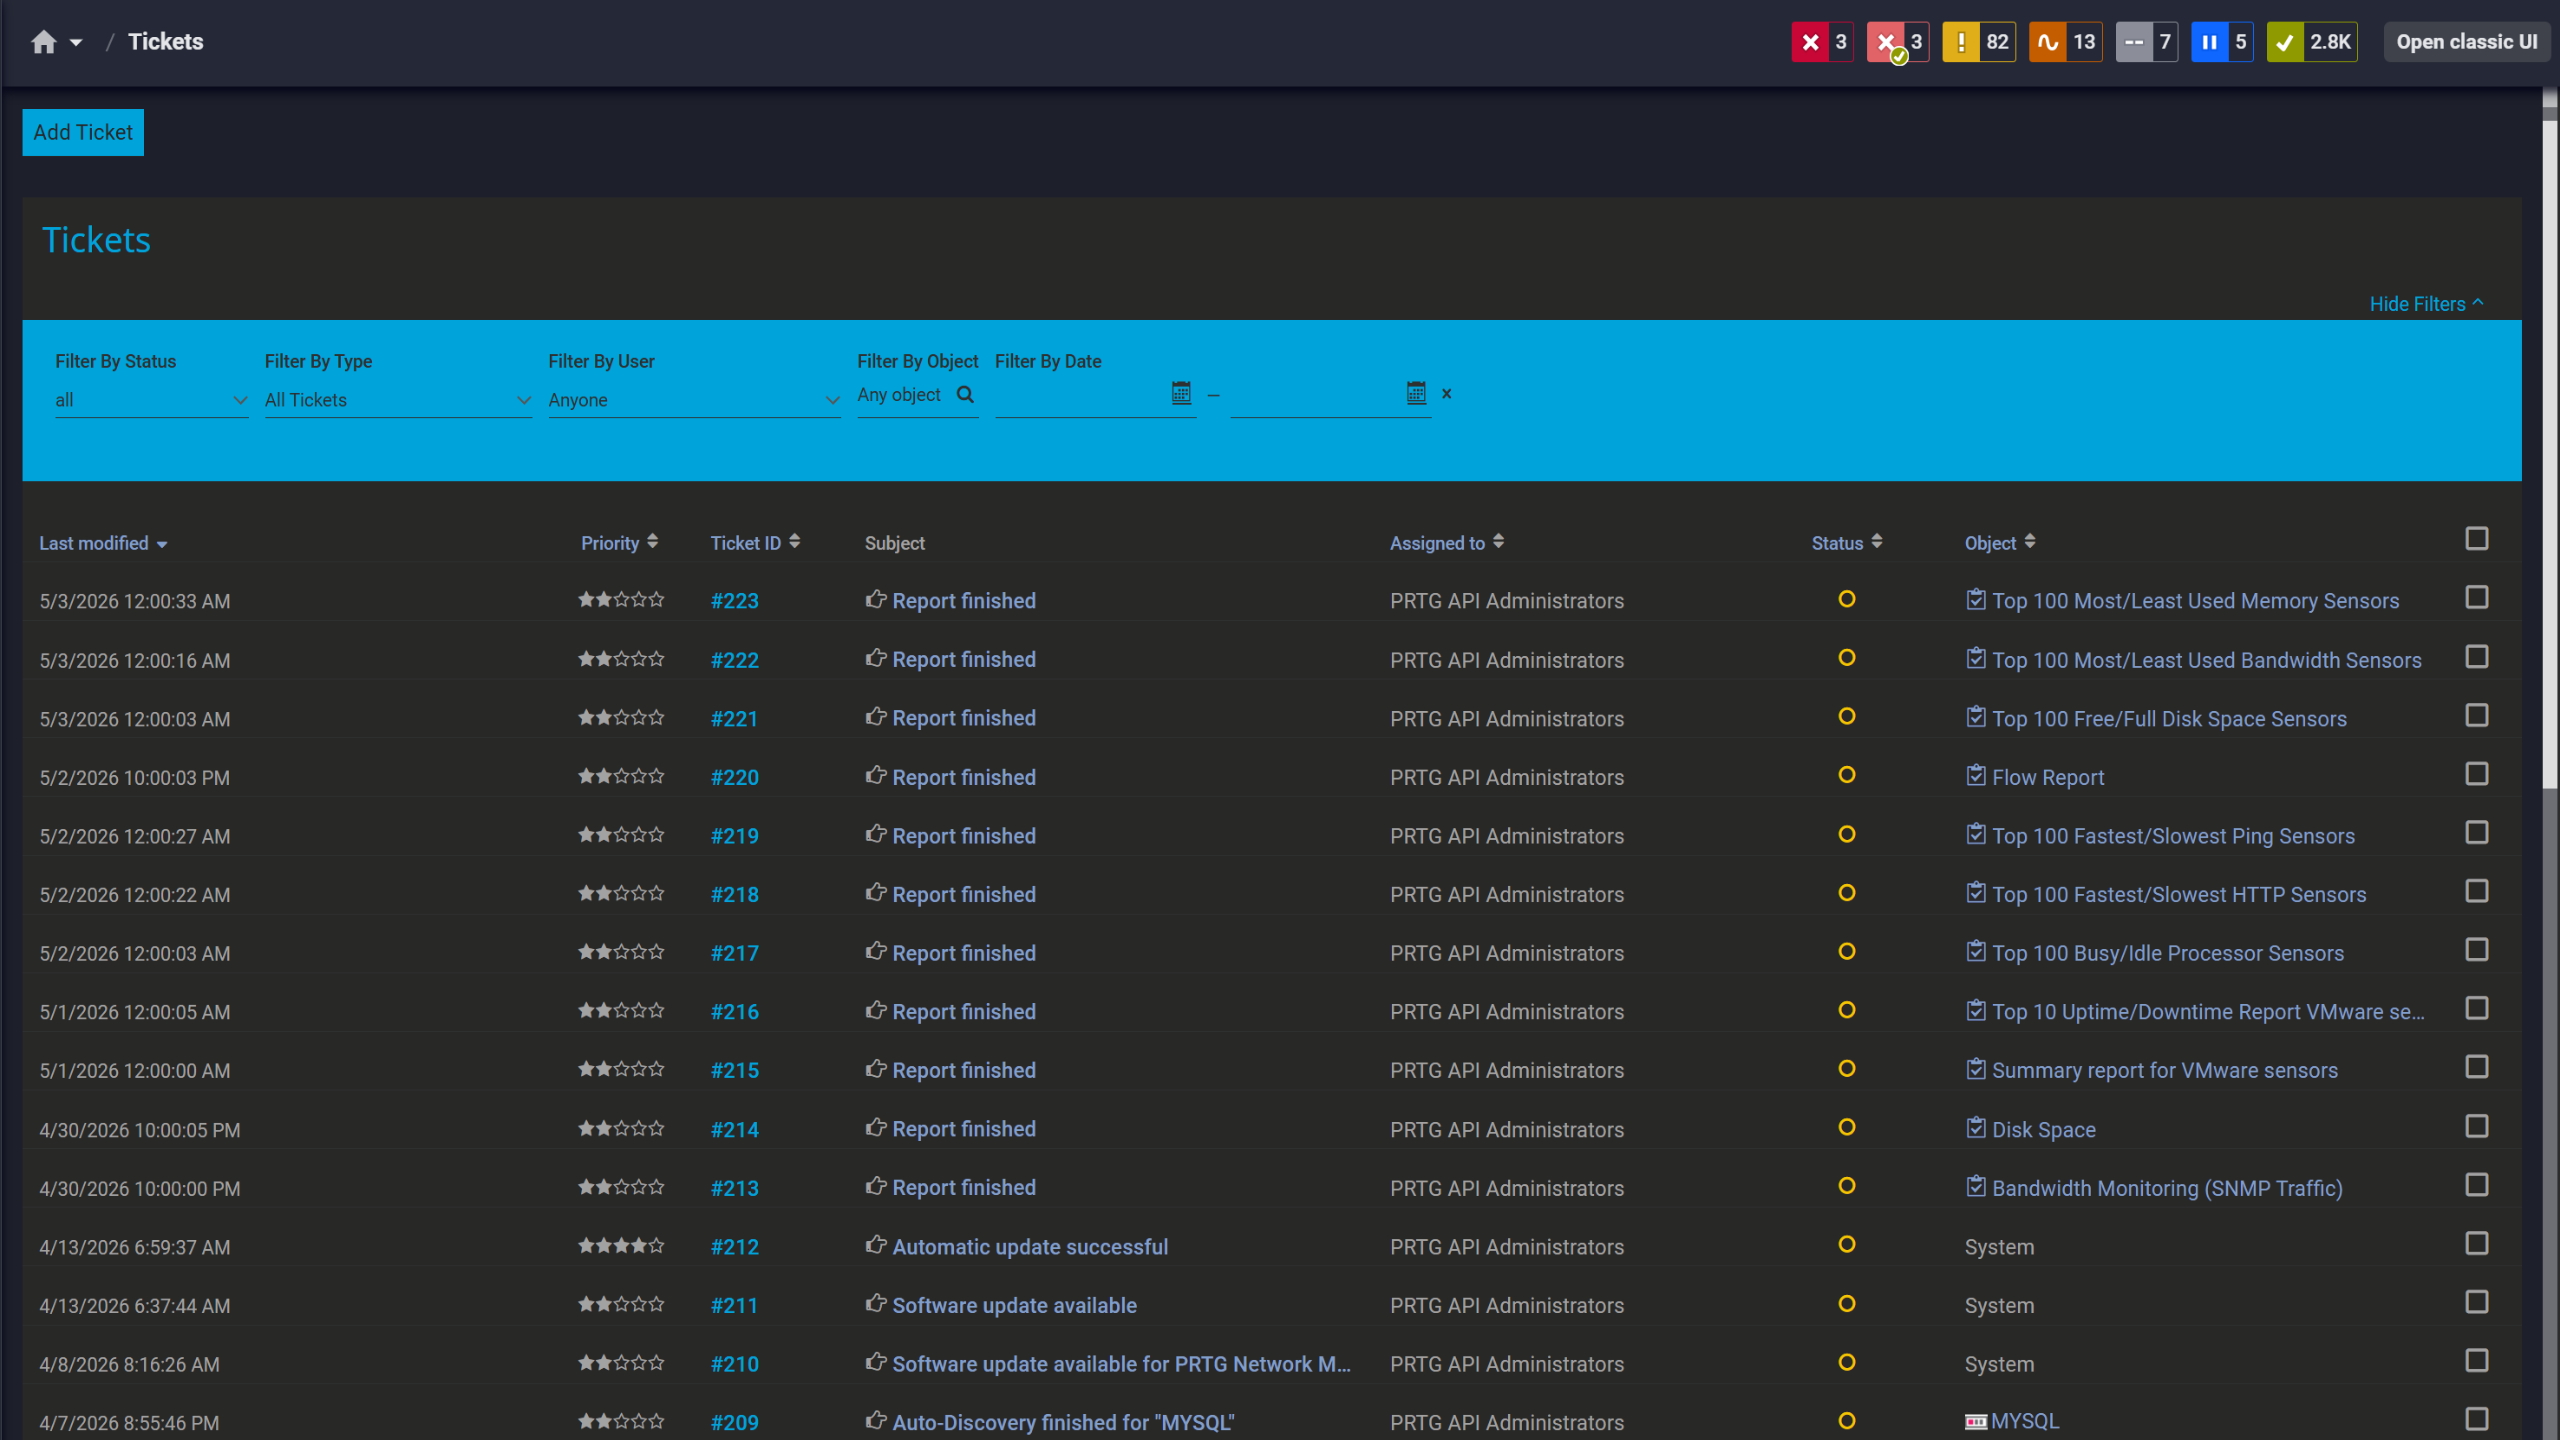
Tickets keep your team aligned
PRTG monitors Synology NAS devices through SNMP sensors that collect system health, disk status, and capacity metrics. Each sensor breaks down into individual channels (CPU load, temperature, disk status, and others), giving you granular visibility into DSM device health. Here's what each sensor covers and how to use them.
Monitoring Task | Manual DSM Dashboard Checks Manual DSM Dashboard Checks | PRTG Network Monitor PRTG Network Monitor |
|---|---|---|
Multi-Device Visibility | Manual DSM Dashboard Checks Log into each DSM individually (10-60+ min/day for 20+ devices) | PRTG Network Monitor Centralized dashboard shows all devices at once (2-5 min/day) |
Disk Health Monitoring | Manual DSM Dashboard Checks Check Storage Manager manually per device | PRTG Network Monitor SNMP Synology Physical Disk sensor monitors all disks automatically |
Capacity Alerting | Manual DSM Dashboard Checks Manual checks or basic DSM email notifications | PRTG Network Monitor Customizable multi-threshold alerts (warning at 80%, error at 90%) |
Mobile Access | Manual DSM Dashboard Checks DSM mobile app (per-device only) | PRTG Network Monitor PRTG iOS/Android apps (all devices, all metrics, push notifications) |
Historical Trend Data | Manual DSM Dashboard Checks Limited to DSM Resource Monitor graphs per device | PRTG Network Monitor Historical data across all Synology devices with customizable timeframes |
Hardware Health Monitoring | Manual DSM Dashboard Checks Check each device's Control Panel > Info Center manually | PRTG Network Monitor SNMP Synology System Health sensor monitors temperature, fans, power, CPU, memory automatically |
Time Investment (Daily Management) | Manual DSM Dashboard Checks High (manual checks across multiple devices) | PRTG Network Monitor Low (alerts only when thresholds are met) |
Choose the PRTG Network Monitor subscription that's best for you.
| License Name | License description | Price | License Details | Get started | Pricing Details | |
|---|---|---|---|---|---|---|
| PRTG 500 | $200 | per month paid annually | Buy nowBuy now | Enough to monitor multiple aspects of 50 devices | ||
| PRTG 1000 | $358 | per month paid annually | Buy nowBuy now | Enough to monitor multiple aspects of 100 devices | ||
| PRTG 2500 | $742 | per month paid annually | Buy nowBuy now | Enough to monitor multiple aspects of 250 devices | ||
| PRTG 5000 | $1,300 | per month paid annually | Buy nowBuy now | Enough to monitor multiple aspects of 500 devices | ||
| PRTG 10000 | $1,642 | per month paid annually | Buy nowBuy now | Enough to monitor multiple aspects of 1000 devices |

Start in DSM. Control Panel, Terminal & SNMP, then the SNMP tab. Enable v2c or v3 there (v3 if you care about securing SNMP traffic), set your community string or credentials, port 161 by default. Then add the device in PRTG. Auto-discovery handles sensor creation via the Synology device template, so system health, physical disk, and logical disk sensors appear without manual setup. That's roughly it.
Quite a bit out of the box. System health covers CPU load, fan status, temperatures, and power supply. Physical disk tracking runs per drive, so you get temperature and status individually rather than a single aggregate. Logical volumes give you capacity and health status. Memory availability is in there too.
Beyond the predefined sensors you can pull additional OIDs via MIB import, though what's actually exposed depends on your DSM version and how SNMP is configured on that specific unit.
That's the main point of running PRTG for this. All your NAS devices show up in one place. Remote sites behind VPN or on separate networks get covered through PRTG remote probes, and their data lands in the same central view as everything else. You're not logging into anything separately.
Both work. V3 adds encrypted authentication, which matters if SNMP traffic crosses segments outside your direct control. The configuration has to match on both sides though. Authentication protocol, privacy protocol, credentials, all of it needs to be consistent between DSM and the PRTG device settings. When v3 sensors come back empty, a credential mismatch is almost always why.
Yes, though it's a few more steps. Import the MIB files into PRTG's MIB importer, then build an SNMP Library Sensor or SNMP Custom Advanced sensor around the OIDs you need. Mostly relevant when the standard sensors don't surface something specific to your DSM setup or hardware configuration.
PRTG covers the hardware and storage layer underneath it. So volume capacity, CPU load under recording workloads, system health, network throughput, those are all visible. What PRTG doesn't touch is anything camera-specific. No stream analysis, no motion event data, nothing from the Surveillance Station application layer itself. If recording stops because a volume filled or the system is overloaded, PRTG shows you the cause. What triggered the camera-side issue is a different question.
When a sensor crosses a threshold PRTG fires a notification through whichever channel you've configured. Email and SMS are the basics. Push notifications through the iOS and Android apps work well for on-call coverage since you don't need to be in front of anything. Slack and Microsoft Teams are also supported if your team routes alerts there. You can assign different methods to different severity levels, so warnings and errors don't necessarily land the same way.
No, and the overlap is smaller than it looks. Active Insight is Synology's own service, cloud-based, built around DSM-specific health data and events. PRTG is on your infrastructure side and covers the broader environment: the NAS alongside your network devices, servers, and applications. Monitoring data stays local, thresholds are yours to set, and it fits into whatever alerting or workflow setup you already have. Running both makes sense if you want Synology-native visibility through Active Insight and unified infrastructure monitoring through PRTG.
Network Monitoring Software – Version 26.3.124.1727 (September 16, 2026)
Download for Windows and cloud-based version PRTG Hosted Monitor available
English, German, Spanish, French, Portuguese, Dutch, Russian, Japanese, and Simplified Chinese
Network devices, bandwidth, servers, applications, virtual environments, remote systems, IoT, and more
Choose the PRTG Network Monitor subscription that's best for you



