Custom alerts and data visualization make it easy to monitor, identify, and prevent cloud platform issues.
Maintaining a cloud could be such a great job. After all, what IT professional doesn't enjoy modern technology? Regularly working on new, exciting topics and learning new things are a wonderful thing. If there weren't disturbances like poor response times, provider issues, or unavailable data centers.
But there is a great, user-friendly solution that will allow you to focus on the exiting tasks: Paessler PRTG.
With helpful features such as application performance monitoring, our cloud monitoring software helps you turn observability problems into brief distractions. No matter if you are responsible for a hybrid cloud or other cloud environments.

Diagnose network issues by continuously tracking cloud applications. Show private cloud, hybrid cloud and other key metrics in real time. Visualize monitoring data in clear graphs and dashboards to identify problems more easily. Gain the overview you need to troubleshoot your entire cloud platform.

Device tree view of the complete monitoring setup
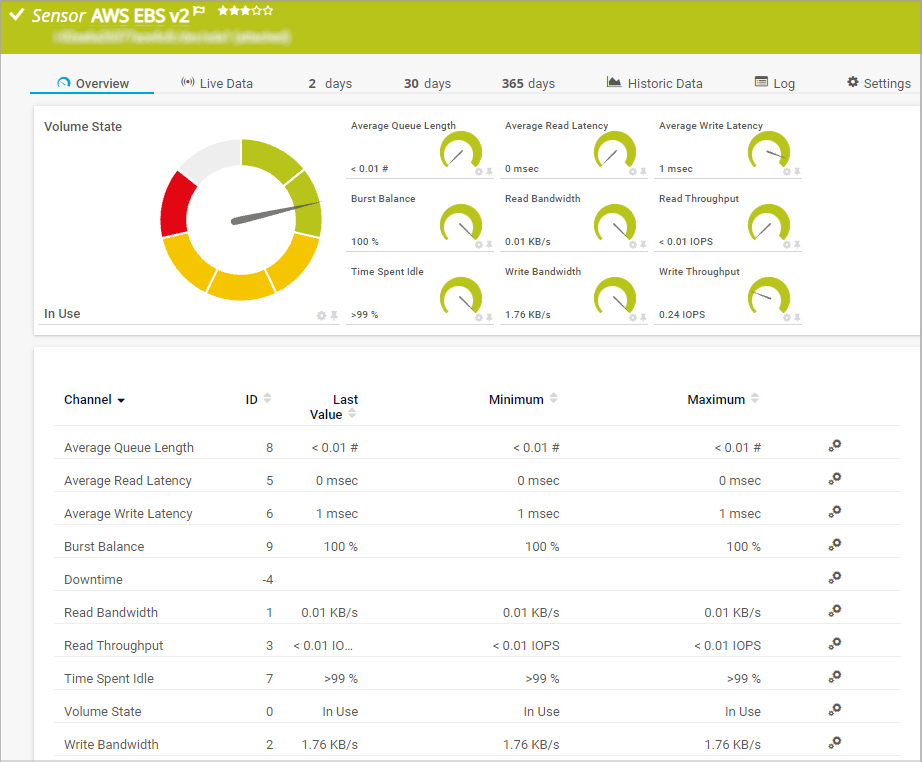
Preconfigured AWS EBS v2 sensor in PRTG

Custom PRTG dashboard for keeping an eye on the entire IT infrastructure
“All-around winning
network monitor”
“The real beauty of PRTG is the endless possibilities it offers”
“PRTG Network Monitor
is very hard to beat”
A standout cloud performance monitoring tool has two main superpowers. First, it has the right sensors to find the root cause of problems in your multi-cloud environment. Second, it makes your life easier with out-of-the-box, quality-of-life features.
What’s better than real-time alerts? That’s right, customizable real-time alerts. You don’t just get notifications when your thresholds are exceeded. Depending on the severity of the event, only the people or groups you select are alerted as a first step.
They don’t even have to be at their workstation. With the PRTG apps for iOS and Android, everyone stays informed wherever they are.
There are so many monitoring software options out there that it’s easy to get overwhelmed. The issue with a lot of them is that they only cover one specific monitoring area. Instead of trying to manage multiple tools simultaneously, check out PRTG.
You want to monitor your bandwidth? Check. You need reliable hardware monitoring? Check. And if you want to integrate your entire OT network in addition to your IT infrastructure, PRTG can handle it, too.
Do you want to spend hours setting up your monitoring environment? We don’t. That is the reason why we have developed PRTG to be up and running in a matter of minutes.
With useful out-of-the-box settings, dashboards, and our convenient Auto-Discovery function, you can get your entire monitoring environment up and running in just a few clicks. You can fine-tune everything knowing that your infrastructure is already fully monitored.
Stakeholders have different needs when it comes to the reports they get from the monitoring team. Nothing new here. Also, not entirely new, but useful, is that PRTG not only collects all the data you want, but it also has built-in reporting so you can provide everyone involved with the right data from the very first second.
You can have your data prepared exactly as you need it for the presentation. All your decisions going forward will be based purely on the data you collect.
PRTG comes with more than 250 native sensor types for monitoring your entire on-premises, cloud, and hybrid cloud environment out of the box. Check out some examples below!
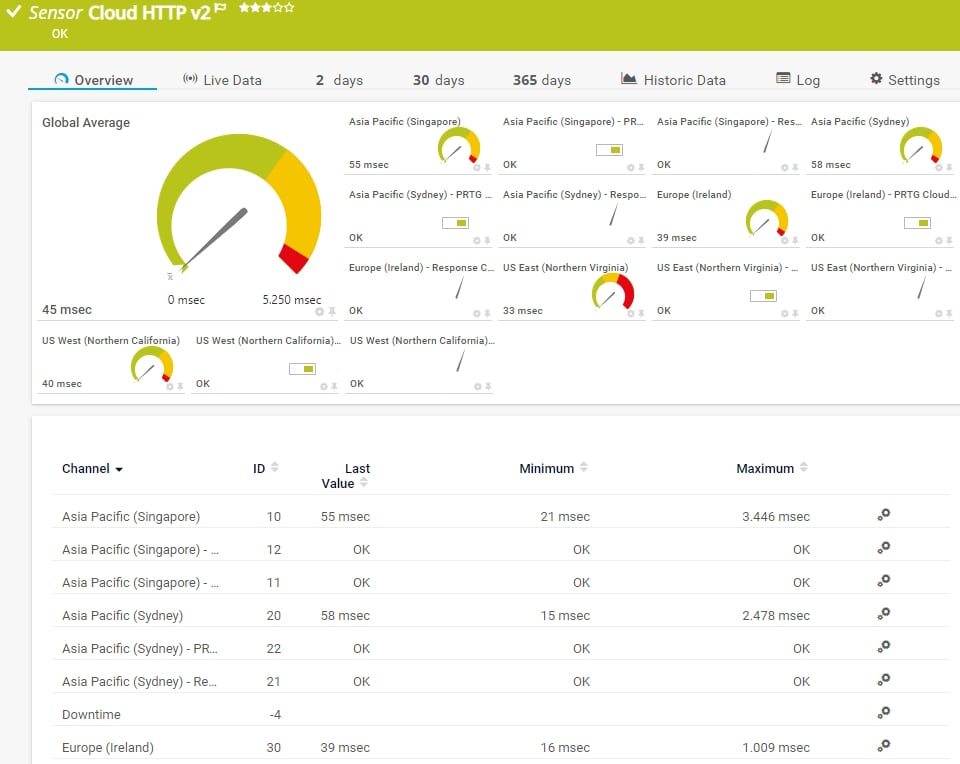
The Cloud HTTP v2 sensor monitors the loading time of a web server via HTTP from different locations worldwide (Asia Pacific: Singapore, Asia Pacific: Sydney, Europe: Ireland, US East: Northern Virginia, US West: Northern California) via the PRTG Cloud. It can show the following:
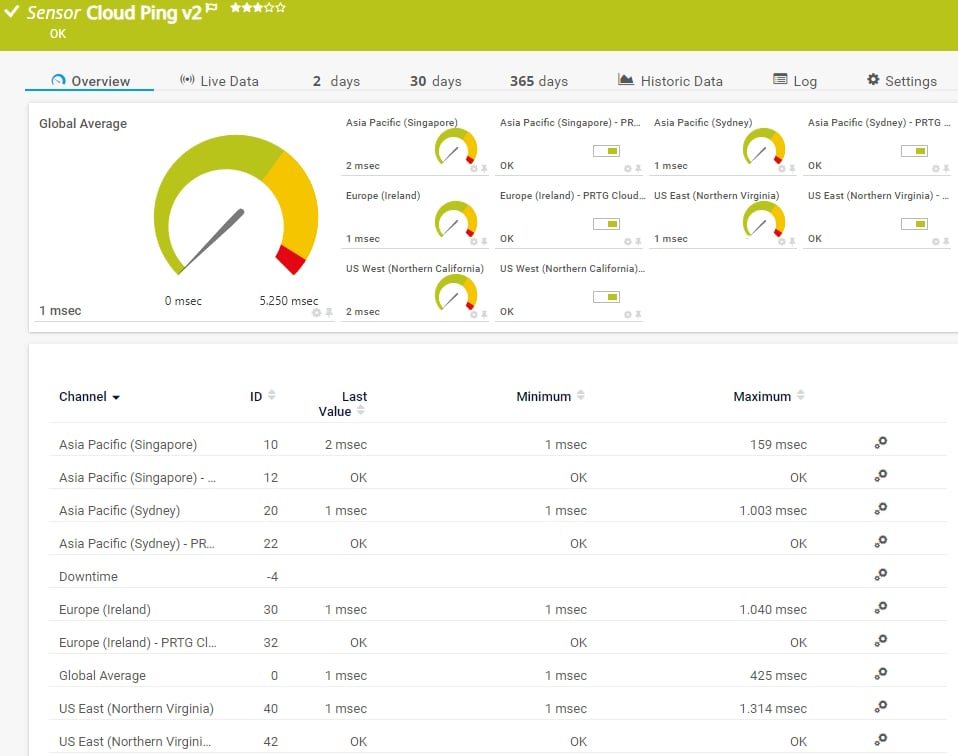
The Cloud Ping v2 sensor monitors the Transmission Control Protocol (TCP) ping times to its parent device from different locations worldwide (Asia Pacific: Singapore, Asia Pacific: Sydney, Europe: Ireland, US East: Northern Virginia, US West: Northern California) via the PRTG Cloud. It can show the following:
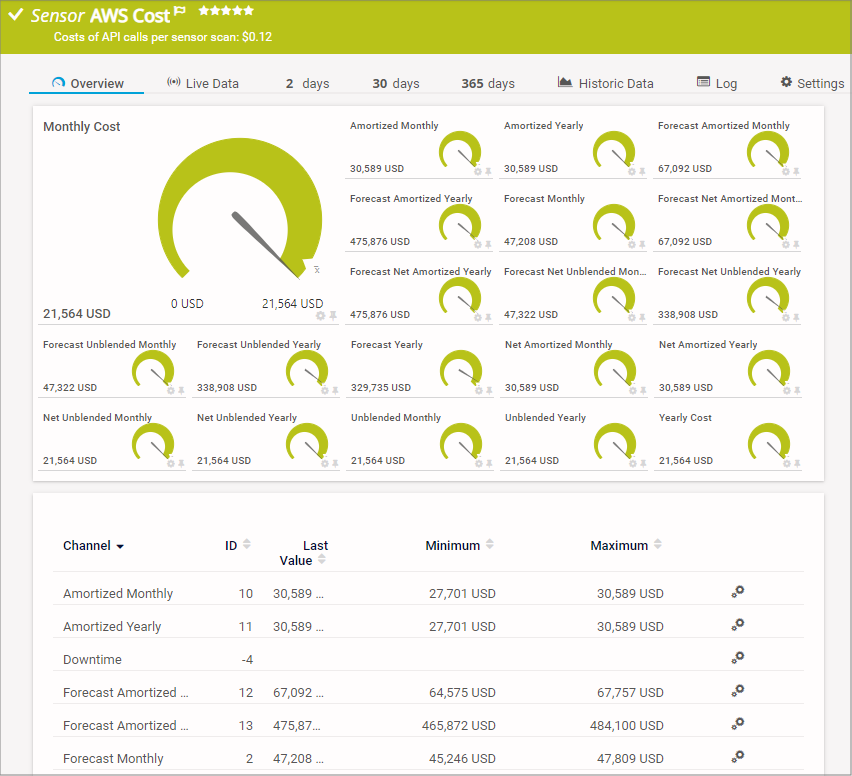
The AWS Cost sensor monitors the cost of an Amazon Web Services (AWS) account by reading its data from the AWS Cost Explorer API. It can show the following:
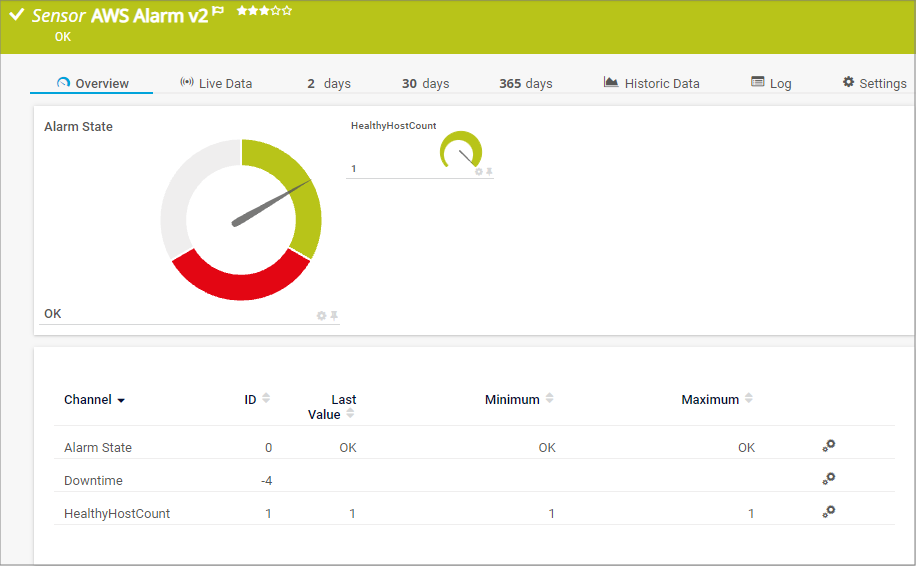
The AWS Alarm v2 sensor monitors the status of an Amazon Web Services (AWS) alarm by reading its data from Amazon CloudWatch via the AWS API. It can show the following:
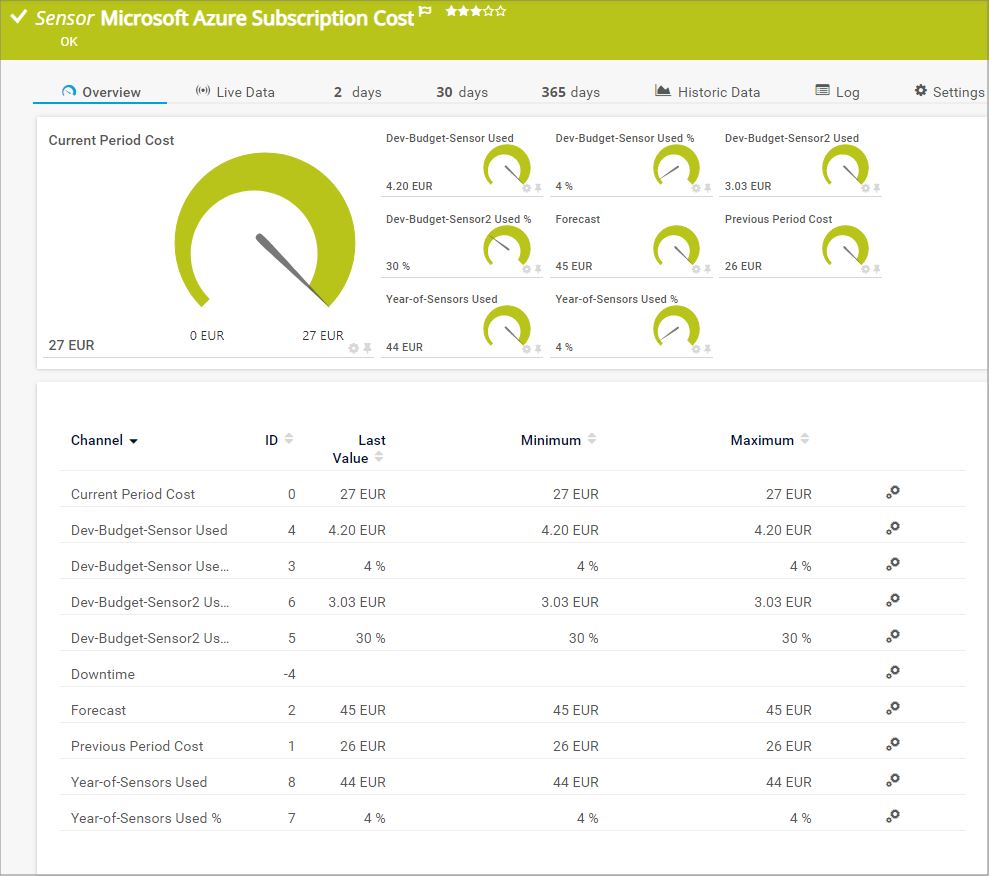
The Microsoft Azure Subscription Cost sensor monitors the cost in a Microsoft Azure subscription. It can show the following:
See the PRTG Manual for a list of all available sensor types.

Custom alerts and data visualization make it easy to monitor, identify, and prevent cloud platform issues.
PRTG is set up in a matter of minutes and can be used on a wide variety of mobile devices.

Paessler is a certified partner in the Amazon Web Services ecosystem, which includes a growing community of software vendors who are building solutions on cloud computing.
What does this mean for you?
Partnering with innovative IT vendors, Paessler unleashes synergies to create
new and additional benefits for joined customers.
baramundi and PRTG create a secure, reliable and powerful IT infrastructure where you have everything under control - from the traffic in your firewall to the configuration of your clients.
Combining their tools to a powerful solution for advanced analysis and automation, KnowledgeRiver and Paessler enable IT teams to ensure best performance for their infrastructure and networks.
Integrating monitoring results from PRTG into NetBrain maps makes the foundation for network automation.
Real-time alerts and custom notifications make it easy to solve issues with your cloud infrastructure.
Network Monitoring Software – Version 26.1.116.1532 (February 9th, 2026)
Download for Windows and cloud-based version PRTG Hosted Monitor available
English, German, Spanish, French, Portuguese, Dutch, Russian, Japanese, and Simplified Chinese
Network devices, bandwidth, servers, applications, virtual environments, remote systems, IoT, and more
Choose the PRTG Network Monitor subscription that's best for you


Cloud performance monitoring is different from monitoring your physical server on-premise. With cloud monitoring you track and analyze the status of your cloud infrastructure and applications. It helps you spot and fix problems that affect cloud performance, so everything runs smoothly and to yours and your users satisfaction.
For years, the number of businesses that use cloud services like Google Cloud, AWS or Microsoft Azure has been increasing. In many ways it has changed the way you have to work, from DevOps engineer to people who are just starting with cloud-native development. Therefore monitoring the performance of your (public) cloud environment is the key to keep your cloud infrastructure efficient, reliable, and cost-effective. It lets you manage resources proactively, helps you to minimize downtime, and makes the overall user experience better.
While both AWS and Azure monitoring have a lot in common, the specific metrics and tools used can end up being quite different. PRTG provides custom sensors and dashboards for each platform, so you can monitor things exactly the way you want to.
Cloud performance issues can lead to increased latency and therefore slower speeds, more downtime, and higher costs. These issues can affect how happy users are, how much productive you and your users can work in the cloud and in the worst-case decrease profitability.
In PRTG, “sensors” are the basic monitoring elements. One sensor usually monitors one measured value in your network, for example the traffic of a switch port, the CPU load of a server, or the free space on a disk drive. On average, you need about 5-10 sensors per device or one sensor per switch port.
Paessler conducted trials in over 600 IT departments worldwide to tune its network monitoring software closer to the needs of sysadmins. The result of the survey: over 95% of the participants would recommend PRTG – or already have.

Paessler PRTG is used by companies of all sizes. Sysadmins love PRTG because it makes their job a whole lot easier.
Bandwidth, servers, virtual environments, websites, VoIP services – PRTG keeps an eye on your entire network.
Everyone has different monitoring needs. That’s why we let you try PRTG for free.