- English
- Deutsch
- Español
- Français
- Italiano
- Português
Windows infrastructure monitoring means keeping track of a lot of moving parts: servers, workstations, services, event logs, application health, and distributed sites. The challenge is doing that without deploying and maintaining agents on every machine, and without manually correlating data across separate tools when something goes wrong.
Paessler PRTG connects to Windows systems via WMI and performance counter APIs, giving you real-time visibility into CPU load, memory, disk I/O, service status, event logs, and application health across your entire environment with it’s out-of-the-box network discovery. Custom PowerShell scripts extend coverage to whatever built-in sensors don't cover out of the box.
Supported Windows environments and technologies: Windows Server (2016, 2019, 2022, 2025), Windows 10, Windows 11, Active Directory, Hyper-V, IIS, SQL Server, Microsoft Exchange, file servers, DNS, DHCP monitoring, Remote Desktop Services, Azure hybrid environments, WMI, performance counters, event logs, Windows services, Windows Update status

CPU spikes and memory leaks don't announce themselves. Performance degrades gradually, and by the time help desk tickets start arriving, the damage is already done. PRTG tracks CPU load, memory usage, disk I/O, and network traffic in real time using performance counters and WMI sensors. You set thresholds once. From that point on, PRTG watches continuously and alerts you the moment something starts trending the wrong way.
A stopped Windows service can take down more than you'd expect. SQL Server stops, and an entire application stack goes offline. IIS application pools crash, Active Directory replication lags. These failures cascade quickly, and downtime from them adds up fast. Getting services back manually takes time you often don't have. PRTG's WMI Service sensor keeps continuous watch on service status, startup type, and dependencies across all your servers. The moment a critical service stops unexpectedly, you get notified. Not after someone complains. Immediately.
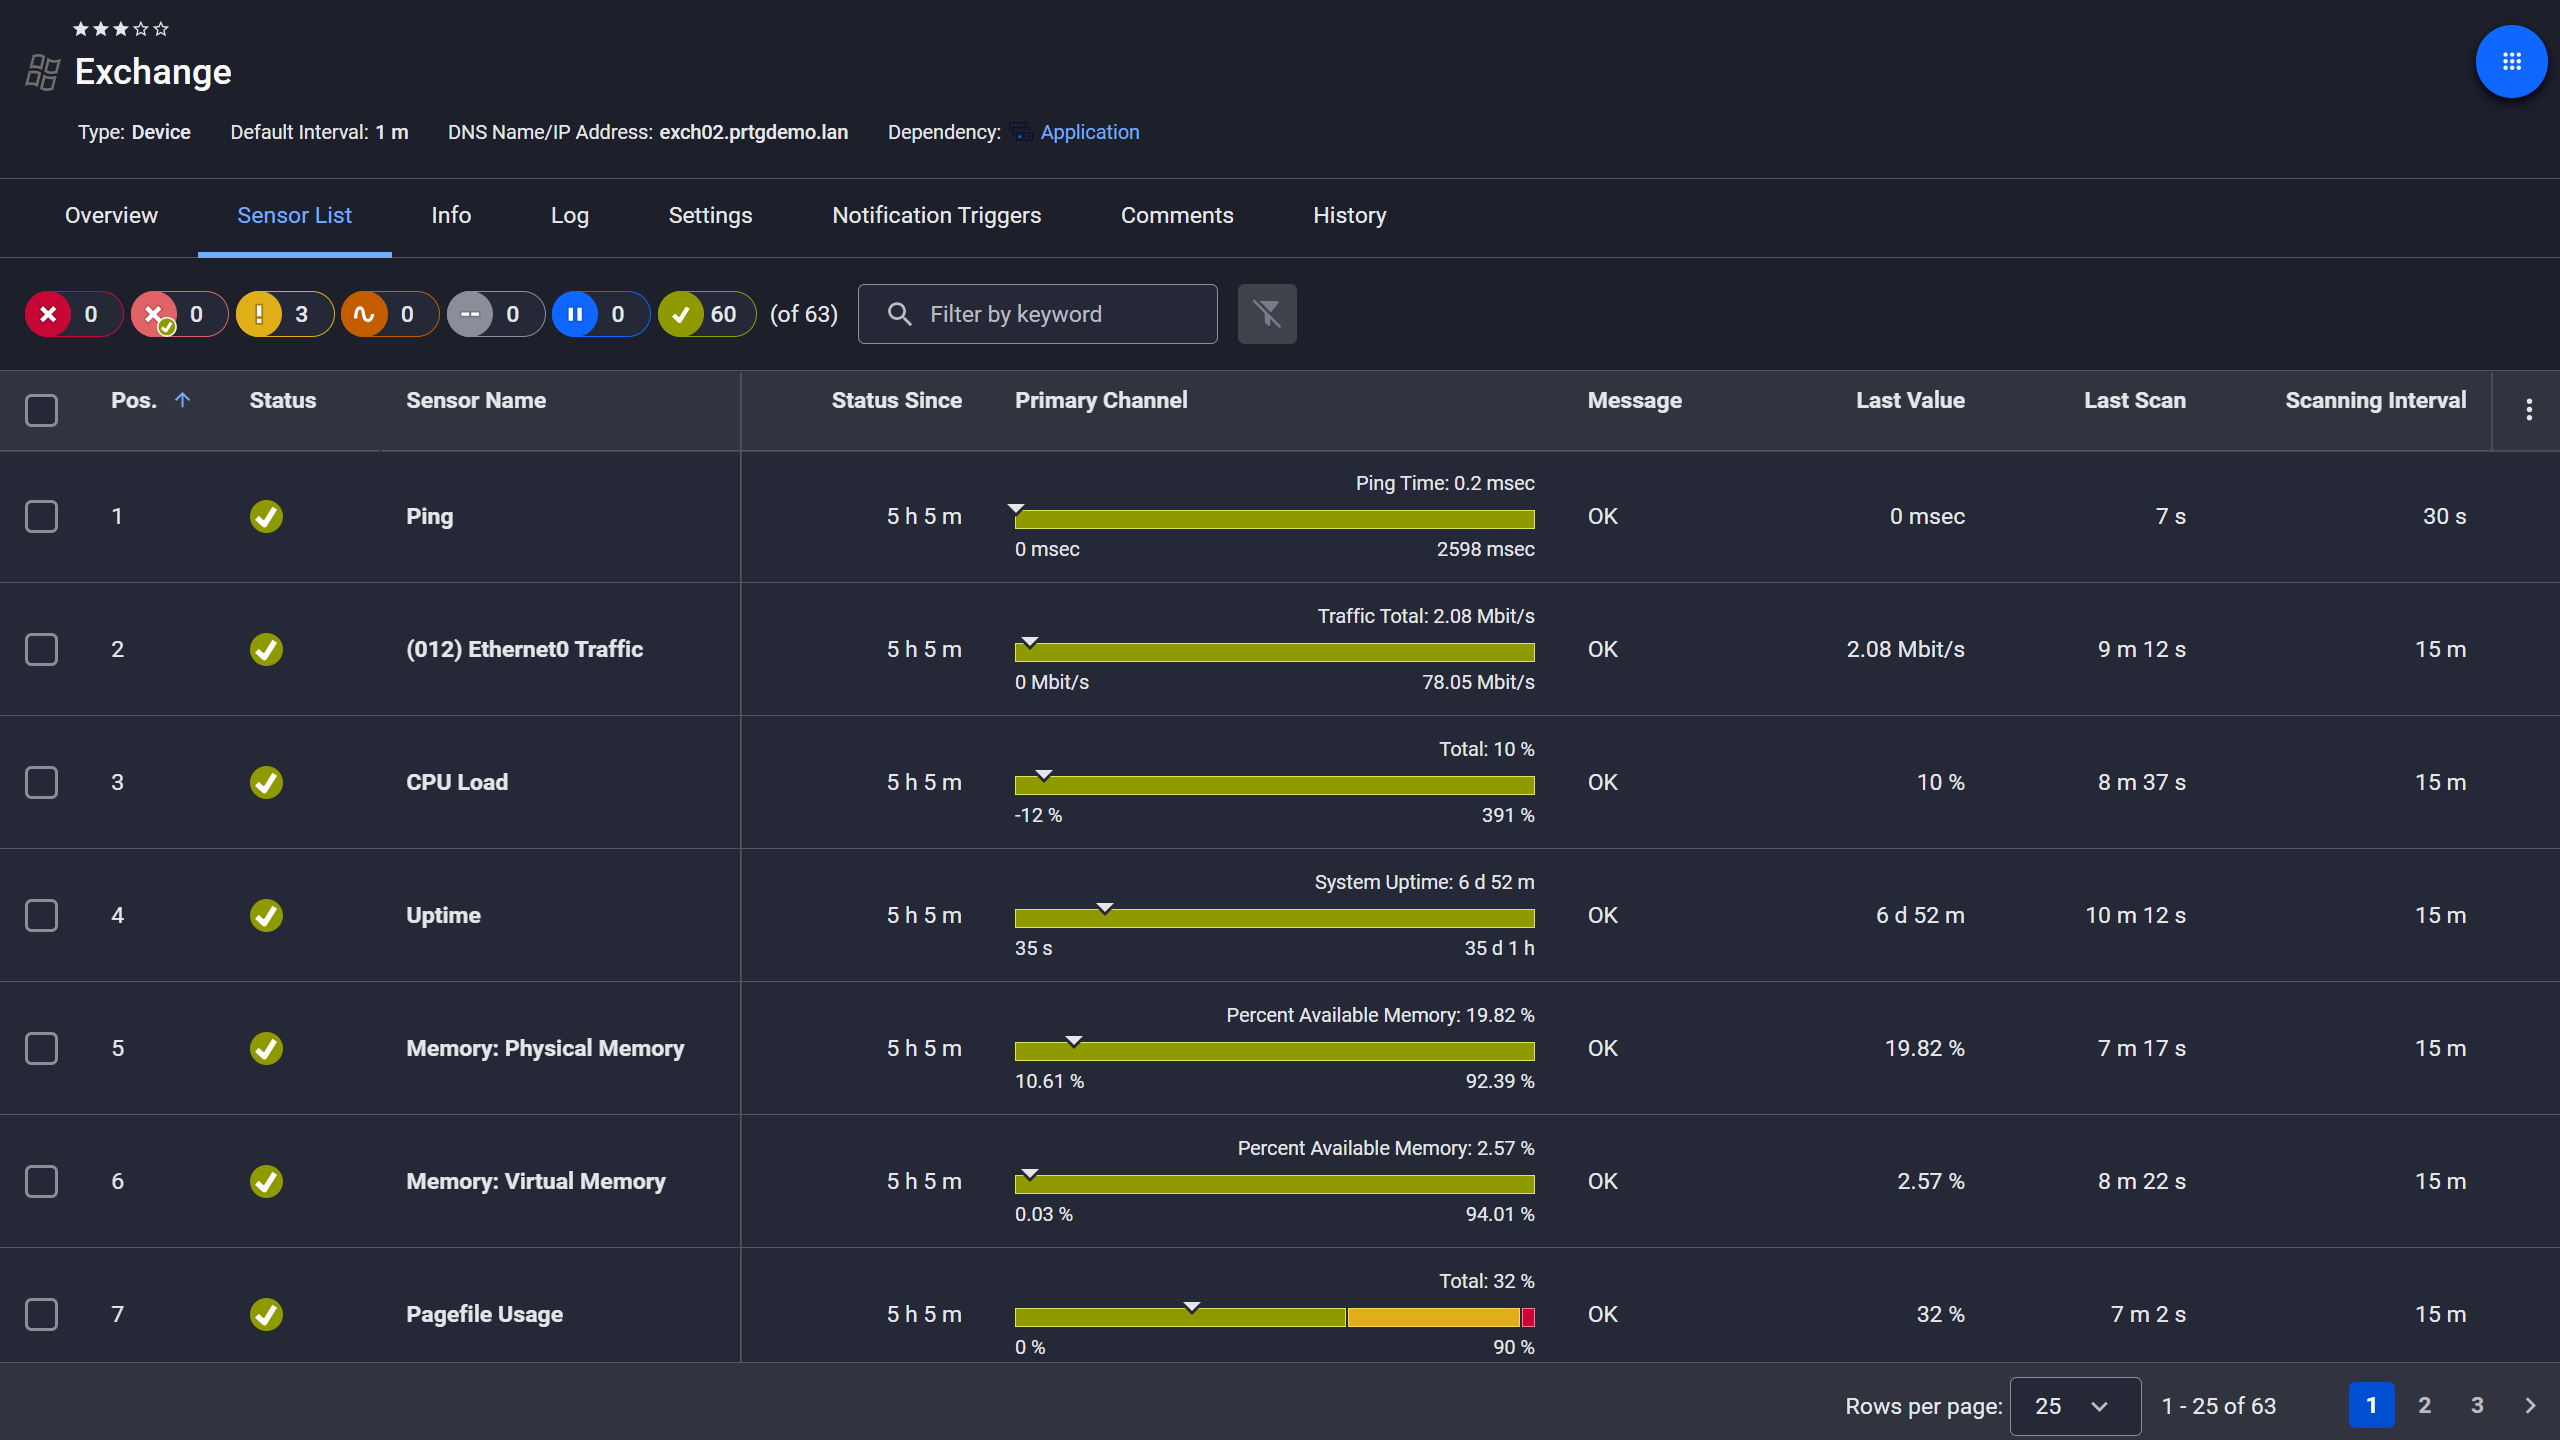
Exchange server, fully under control
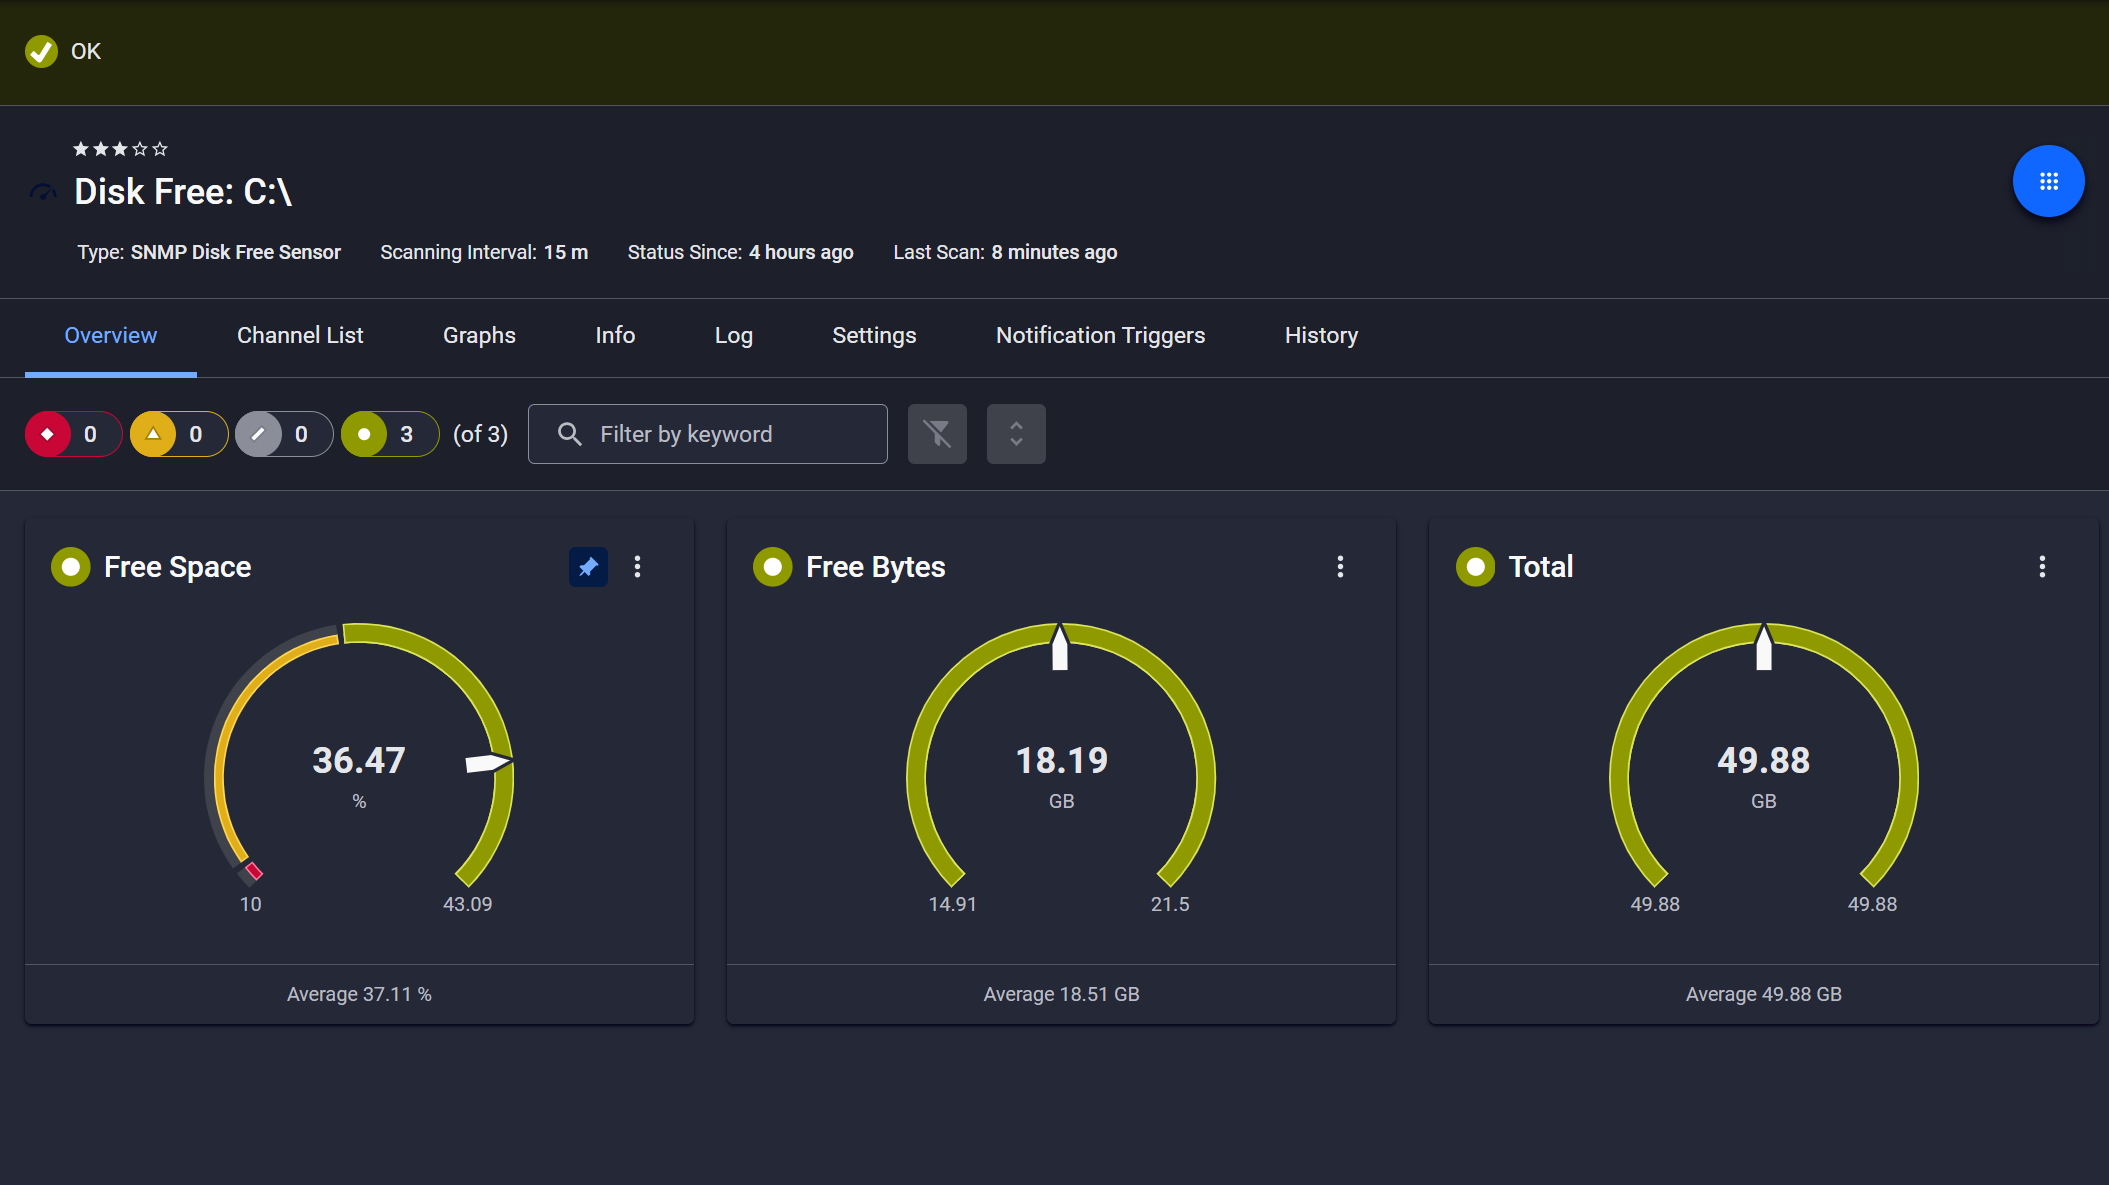
Disk space monitored, alerts ready

Live graphs, real-time performance data
Windows event logs are relentless. Thousands of entries every day, most of them irrelevant. The real question is whether critical errors are actually getting noticed or just buried in the noise. Most teams either ignore logs entirely or spend hours digging through them reactively after something breaks. PRTG's Event Log sensor monitors System, Application, and Security logs with precise filters. Specific event IDs, severity levels, event sources. You define what matters, and PRTG alerts you when it happens. Failed backups, security incidents, service crashes. Nothing else gets through.
Start monitoring your infrastructure in minutes. No professional services, no complex configuration, no risk.
Branch offices and Azure environments tend to become infrastructure monitoring blind spots. Not because anyone planned it that way, but because separate monitoring tools end up covering separate locations, and correlating data manually across them isn't realistic at scale. PRTG's remote probe architecture handles this directly. Probes run locally at each site, handle monitoring tasks there, and report back to the central server via encrypted connections. On-premises servers, remote sites, and Azure-hosted Windows VMs. One platform, one set of dashboards, full observability.

Full device list, instant overview

Scheduled reports, always on time
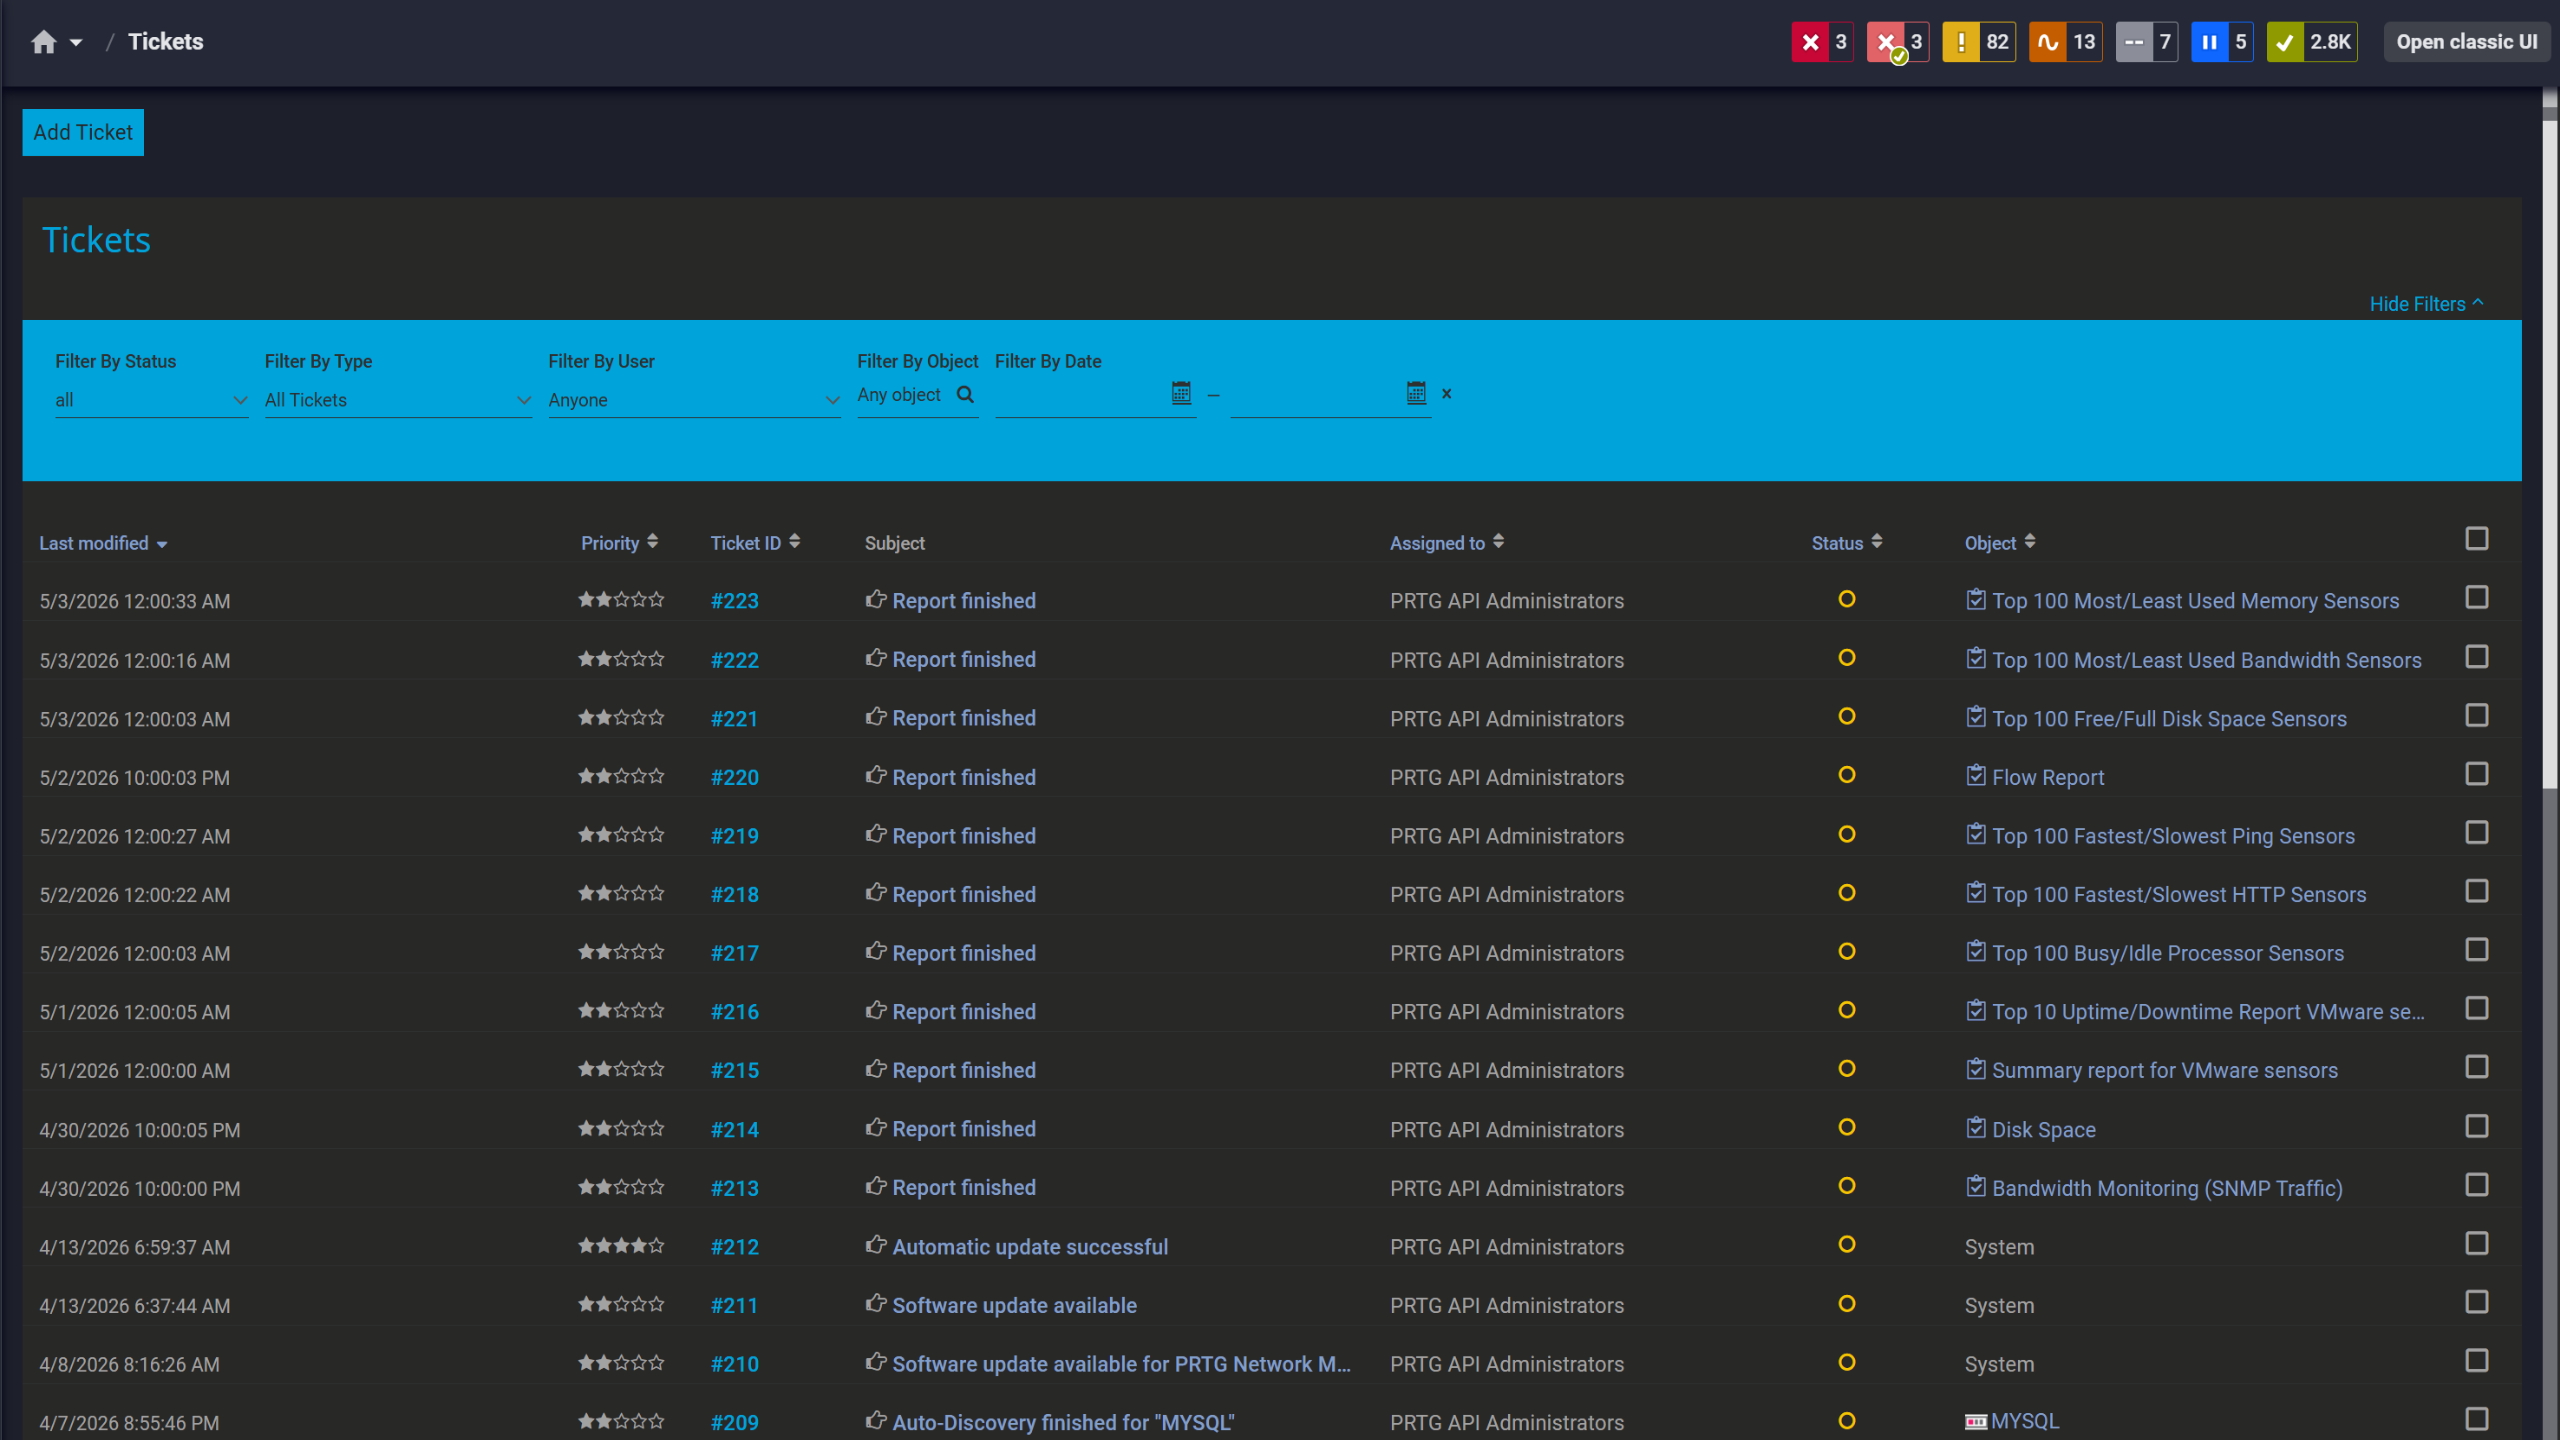
Tickets keep your team aligned
A server can look perfectly healthy and still be causing problems. IIS application pools crash while operating system metrics look fine. Active Directory replication lags, authentication slows, users start complaining about login times. SQL Server query performance degrades under load. PRTG’s application monitoring goes beyond the OS layer. IIS, SQL Server, Hyper-V, Active Directory. You get visibility into whether the applications your business depends on are actually functioning, not just whether the underlying server is up.
PRTG uses several monitoring technologies depending on what you're tracking and how your environment is structured. No agents required on every device. Here's a breakdown of how it actually works.
FEATURE | Manual Manual | PRTG PRTG |
|---|---|---|
Monitor Windows Server CPU, memory, and disk performance | Manual Log into each server individually. Open Performance Monitor or Task Manager. Check current utilization manually. Export to spreadsheets. Repeat for every server. Correlate data across systems by hand. | PRTG Automated performance counter sensors track CPU, memory, disk I/O, and network metrics across all servers. Server monitoring software with centralized dashboards that provide real-time visualization, historical trending, and threshold-based alerting. |
Track Windows service status across your IT infrastructure | Manual RDP into each server. Open Services console (services.msc). Check critical services manually. Note failures. Maintain a spreadsheet to track state over time. | PRTG WMI Service sensors monitor service status, startup type, and dependencies across all servers automatically. Instant alerts when critical services stop. Dependency mapping shows downstream impact. |
Monitor Windows Event Logs for critical errors and security events | Manual Open Event Viewer on each server. Filter through thousands of entries. Search manually for specific event IDs or error patterns. Export relevant events. Correlate across servers. | PRTG Event Log sensors continuously monitor System, Application, and Security logs with customizable filters. Alert on critical events automatically. Centralized visibility reduces troubleshooting time significantly. |
Check Windows Update status and patch compliance | Manual Log into each server and workstation. Open Windows Update. Check pending updates and last installation date. Document status manually. Repeat monthly. | PRTG Windows Update sensors automatically track patch status, pending updates, and last successful installation. Compliance reports generated automatically. Alerts on missing critical patches. |
Monitor distributed Windows infrastructure across branch offices and cloud | Manual Maintain separate monitoring solutions per location. VPN into branch offices to check servers. Log into Azure Portal separately for cloud VMs. Correlate data across locations manually. | PRTG Centralized control covers on-premises servers, branch office systems, and Azure VMs from one platform. Encrypted remote probe connections eliminate VPN dependency. Cross-site topology maps visualize enterprise-wide dependencies. |
Choose the PRTG Network Monitor subscription that's best for you.
| License Name | License description | Price | License Details | Get started | Pricing Details | |
|---|---|---|---|---|---|---|
| PRTG 500 | $200 | per month paid annually | Buy nowBuy now | Enough to monitor multiple aspects of 50 devices | ||
| PRTG 1000 | $358 | per month paid annually | Buy nowBuy now | Enough to monitor multiple aspects of 100 devices | ||
| PRTG 2500 | $742 | per month paid annually | Buy nowBuy now | Enough to monitor multiple aspects of 250 devices | ||
| PRTG 5000 | $1,300 | per month paid annually | Buy nowBuy now | Enough to monitor multiple aspects of 500 devices | ||
| PRTG 10000 | $1,642 | per month paid annually | Buy nowBuy now | Enough to monitor multiple aspects of 1000 devices |

PRTG covers Windows 10 and 11 on the workstation side, and Windows Server from 2008 R2 through 2022. Most sensors support 2008 R2 and later, though some functionality, like specific Hyper-V sensors or certain PowerShell-based sensors, requires newer server versions. The PRTG core server and probes themselves need Windows Server 2016 or later. If you're working with older or unusual configurations, check the individual sensor documentation in the PRTG manual. Compatibility specifics vary by sensor.
PRTG licensing is sensor-based, not device-based. That distinction matters. A typical Windows server uses somewhere between 10 and 30 sensors depending on what you're tracking: CPU, memory, disk, network, services, event logs, applications. License tiers run from 100 sensors up through 500, 1,000, 2,500, 5,000, and unlimited XL options. There's also a free version capped at 100 sensors, which works well for testing or smaller environments.
No. PRTG uses agentless monitoring via WMI, Performance Counters, SNMP, and PowerShell. What you do need: WMI and Remote Registry services enabled on target systems, plus appropriate Windows credentials configured in PRTG. Domain credentials are the cleaner option for larger environments. No per-device software to deploy, patch, or maintain.
Yes, and the alert is immediate. PRTG's WMI Service sensor monitors service status, startup type, and dependencies in real time. You define which services matter: SQL Server, IIS, Active Directory, custom application services. The moment something stops unexpectedly or changes state, notifications go out via email, SMS, push notification, or your ITSM system. Dependency tracking shows which downstream applications are affected, so you're not left guessing about the scope of impact.
On-premises systems use WMI, Performance Counters, and PowerShell sensors. For Azure-hosted Windows VMs, you have two options. Azure API sensors track cloud-level metrics like VM status and resource consumption. Alternatively, if network connectivity allows via VPN, ExpressRoute, or public IP with appropriate firewall rules, you can treat the Azure VM as a standard Windows system and monitor it directly with WMI and Performance Counters. Either way, both environments show up in the same PRTG dashboards with the same alerting and reporting.
Performance Counters are faster and more efficient. Use them for CPU, memory, disk I/O, network traffic, and application-level metrics like IIS and SQL Server. Low overhead, high granularity, real-time data. WMI covers the scenarios Performance Counters can't handle: Windows services, event logs, hardware details, custom queries. The trade-off is overhead. In larger environments, PRTG recommends keeping WMI sensor counts below roughly 200 per probe and distributing load across multiple probes. PRTG sensors default to Performance Counters and fall back to WMI automatically when needed, so in many cases the choice is made for you.
Network Monitoring Software – Version 26.1.116.1532 (February 9th, 2026)
Download for Windows and cloud-based version PRTG Hosted Monitor available
English, German, Spanish, French, Portuguese, Dutch, Russian, Japanese, and Simplified Chinese
Network devices, bandwidth, servers, applications, virtual environments, remote systems, IoT, and more
Choose the PRTG Network Monitor subscription that's best for you


