Custom alerts and data visualization let you quickly identify and prevent congestion, server overload, security vulnerabilities, and other network issues.
Rogue Windows processes drain precious network resources, create security vulnerabilities, and disrupt your organization.
But how do you keep track of them all when a single Windows application can run dozens of processes? And when there are multiple metrics to monitor for each process?
With Paessler PRTG, it's all done for you.
Our sophisticated sensors collect mission-critical real-time and historical data in one place for effortless troubleshooting and pinpoint-accurate resource optimization and capacity planning. And, with powerful alert automations running in the background, you'll never miss a potentially serious performance issue or security threat.

Install and configure PRTG in minutes. Its automatic network discovery discovers all Windows devices and processes in your IT infrastructure and automatically adds them to your monitoring setup.
What’s more: PRTG has a simple and intuitive user interface that makes it easy to learn how to use it, even for people that have no deep technical knowledge.
You don't need to monitor the performance indicators of different Windows processes manually – PRTG collects monitoring data from various sources and stores and visualizes it in a central system.
View all your Windows process data in a single pane of glass via charts, graphs, and dashboards that you can easily customize using our built-in drag-and-drop editor.
PRTG offers a large list of preconfigured report templates that you can use to view monitoring data for a day, a month, or any time period you choose.
Edit templates and ready-made reports, configure the report generation period, select the required sensors, create reports on demand, or set a schedule for automatic report generation.
Diagnose network issues by continuously tracking Windows process and network activity, file systems, and other Windows process information. Show active processes, CPU usage and memory load, hidden, orphaned, and unsigned or suspicious processes, network connections, bandwidth, and other key metrics in real time. Visualize monitoring data in clear graphs and dashboards to identify problems more easily. Gain the overview you need to troubleshoot congestion, Windows server overload, and other network issues.

Device tree view of the complete monitoring setup

Custom PRTG dashboard for keeping an eye on the entire IT infrastructure

Live traffic data graph in PRTG
“All-around winning
network monitor”
“The real beauty of PRTG is the endless possibilities it offers”
“PRTG Network Monitor
is very hard to beat”
Minimal manual intervention and zero specialist knowledge required. Download PRTG, key in an IP address range, and the Auto-Discovery will track down every Windows device and process on your network, assign the appropriate sensors, and start monitoring. Job done.
See how many (and which) Windows processes are running at any point throughout the day and optimize your network on the fly. PRTG also stores historical process data, making it easy to see how memory usage, loads, and other metrics change over time, and plan accordingly.
Is it a legitimate process, or malware? Built-in alerts tell you when there’s an issue, so you can nip it in the bud. Plus, PRTG monitors firewalls, operating systems, and other network components, encrypts connections, and uses secure protocols to keep your data safe.
Why make do with procmon and other Windows sysinternals’ interfaces, when you can tailor your monitoring environment to suit? With the ability to create your own dashboards, alert thresholds, and reporting templates, PRTG gives you the flexibility you need, and then some.
PRTG comes with more than 250 native sensor types for monitoring your entire on-premises, cloud, and hybrid cloud environment out of the box. Check out some examples below!
The Windows Process sensor monitors a Windows process via Windows Management Instrumentation (WMI) or Windows performance counters. It can show the following:
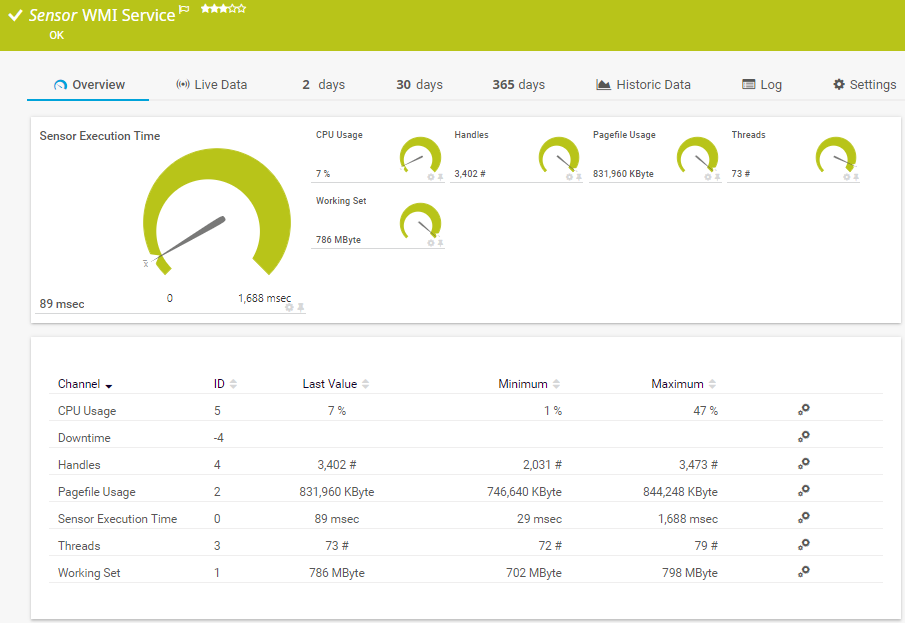
The WMI Service sensor monitors a Windows service. It can show the following:
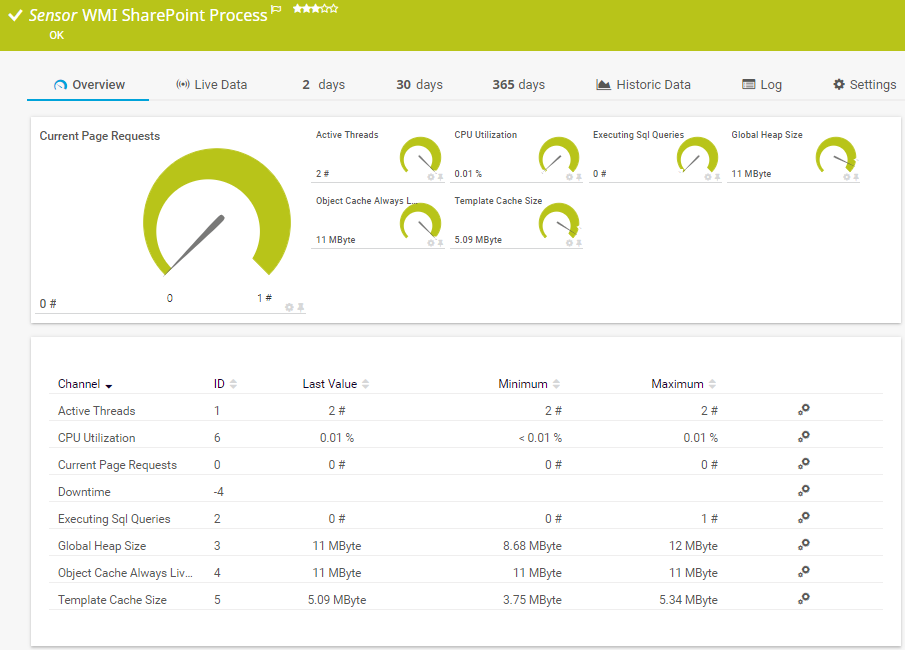
The WMI SharePoint Process sensor monitors a Microsoft SharePoint server. It can show the following:
The Event Log (Windows API) sensor monitors event log entries via the Windows API. It can show the following:
See the PRTG Manual for a list of all available sensor types.

Custom alerts and data visualization let you quickly identify and prevent congestion, server overload, security vulnerabilities, and other network issues.
PRTG is set up in a matter of minutes and can be used on a wide variety of mobile devices.


“Excellent tool for detailed monitoring. Alarms and notifications work greatly. Equipment addition is straight forward and server initial setup is very easy. ...feel safe to purchase it if you intend to monitor a large networking landscape.”
Partnering with innovative IT vendors, Paessler unleashes synergies to create
new and additional benefits for joined customers.
Combining PRTG’s broad monitoring feature set with IP Fabric’s automated network assurance creates a new level of network visibility and reliability.
Combining their tools to a powerful solution for advanced analysis and automation, KnowledgeRiver and Paessler enable IT teams to ensure best performance for their infrastructure and networks.
Integrating monitoring results from PRTG into NetBrain maps makes the foundation for network automation.
Real-time notifications mean faster troubleshooting so that you can act before more serious issues occur.
Network Monitoring Software – Version 26.1.116.1532 (February 9th, 2026)
Download for Windows and cloud-based version PRTG Hosted Monitor available
English, German, Spanish, French, Portuguese, Dutch, Russian, Japanese, and Simplified Chinese
Network devices, bandwidth, servers, applications, virtual environments, remote systems, IoT, and more
Choose the PRTG Network Monitor subscription that's best for you

Windows processes are specific tasks that are carried out when you launch an .exe file. A single application can run dozens or even hundreds of processes simultaneously. So, if they aren’t working as they should – for example because they get stuck or don’t complete fast enough – this impacts your resources and, in turn, your network’s performance.
Windows process monitoring is the continuous evaluation of various parameters of a Windows process to assess how well it performs its functions and whether it is working at all. For example, you can track the number of system resources used by a process, whether a process is active, and more.
Windows process monitoring allows you to identify bottlenecks in the program's operation, detect malfunctions in advance before they lead to program failures, find the root causes of issues, and eliminate them.
The average large enterprise uses 976 applications, each of which likely runs dozens of processes, so you do the math. How can you stay on top of all of them, ensuring they’re not hogging resources or, worse, attempts by bad actors to access your network? Especially when there’s so much else on your to-do list?
You could use Microsoft’s sysinternals. But many of those utilities only work if you already know what you’re looking for. And even those that enable you to continuously log data, like Task Manager and Process Explorer, don’t have built-in alert capabilities or other automations.
A good Windows process monitor, on the other hand, can both continuously log data and alert you if something doesn’t look quite right. Plus, it brings all your data together in one place, so you always know what’s going on at a glance, which saves time, avoidable disruption, and headaches.
PRTG monitors Windows processes using Windows Management Instrumentation or Windows performance counters. Each sensor monitors a particular metric, such as CPU usage or thread activity, which you specify when setting it up. With support for unlimited hardware, software, and virtual devices, it doesn’t matter how large or complex your network is – PRTG can easily scale with you as you grow.
PRTG supports unlimited hardware, software, and virtual devices. That said, the Windows process sensor has a high performance impact, so we recommend running not more than 200 instances of it on a single probe.
In PRTG, “sensors” are the basic monitoring elements. One sensor usually monitors one measured value in your network, for example the traffic of a switch port, the CPU load of a server, or the free space on a disk drive. On average, you need about 5-10 sensors per device or one sensor per switch port.
Paessler conducted trials in over 600 IT departments worldwide to tune its network monitoring software closer to the needs of sysadmins. The result of the survey: over 95% of the participants would recommend PRTG – or already have.

Paessler PRTG is used by companies of all sizes. Sysadmins love PRTG because it makes their job a whole lot easier.
Bandwidth, servers, virtual environments, websites, VoIP services – PRTG keeps an eye on your entire network.
Everyone has different monitoring needs. That’s why we let you try PRTG for free.