• Company
    • About Us
    • Case Studies
    • Press Center
    • Careers
    • Blog
    • Contact us
  • Contact us
  • Login
 
  • English
    • Deutsch
    • Español
    • Français
    • Italiano
    • Português
Paessler
                    - The Monitoring Experts
  • Products
    • Paessler PRTG
      Paessler PRTGMonitor your whole IT infrastructure
      • PRTG Network Monitor
      • PRTG Enterprise Monitor
      • PRTG Hosted Monitor
      • PRTG UVexplorer
      • PRTG extensionsExtensions for Paessler PRTGExtend your monitoring to a new level
    • Icon Features
      FeaturesExplore all monitoring features
      • Maps & dashboards
      • Alerts & notifications
      • Multiple user interfaces
      • Distributed monitoring
      • Customizable reporting
  • Solutions
    • Industries
      IndustriesMonitor various industry sectors
      • Industrial
      • Healthcare
      • Data Center
      • Education
      • Finance
      • Government
    • IT Topics
      IT TopicsMonitor all areas of IT
      • Network Monitoring
      • Bandwidth Monitoring
      • SNMP Monitor
      • Network Mapping
      • WiFi Monitoring
      • Server Monitoring
  • Pricing
  • Resources
    • Getting Started
      Getting StartedModules for self-paced learning
    • How-to Guides
      How-to GuidesGet the most out of PRTG
    • Videos & Webinars
      Videos & WebinarsLearn from Paessler experts
    • IT  Knowledge
      IT KnowledgeExpand your IT knowledge
    • PRTG Manual
      PRTG ManualFull documentation
    • Knowledge Base
      Knowledge BaseShare community knowledge
    • PRTG Sensor Hub
      PRTG Sensor HubGet sensors, scripts & templates
    • Trainings
      PRTG TrainingLearn how to work with PRTG
  • Partners
    • Icon Handshake
      Become a PartnerFor resellers and channel partners
    • Icon MSP
      Become an MSPDeliver monitoring as a managed service
    • icon partner
      Partner PortalLog in to your partner account
    • Deal Registration
      Deal RegistrationRegister your sales opportunities
    • icon search
      Find a PartnerFind partners selling Paessler products
    • icon technology
      Technology AlliancesSee Paessler technology partnerships
    • Partner HubTools for Your Success
  • Company
    • About Us
    • Case Studies
    • Press Center
    • Careers
    • Blog
    • Contact us
  • Contact us
  • Login
  • English
    • Deutsch
    • Español
    • Français
    • Italiano
    • Português
  • Get a quote
  • Free trial

Full Network Activity Monitor  

Monitor traffic, bandwidth, devices, and data flows across your entire network. From one place.  

Free download
PRODUCT OVERVIEW

How Do You Monitor All Network Activity Across Devices, Sites, and Traffic Types in One Place? 

A network activity monitor pulls data from routers, switches, firewalls, access points, and servers, then reports what is actually happening across them: traffic volumes, device availability, response times, network usage. Getting that data into one place requires support for multiple collection methods, since different device types and hardware generations speak different protocols. The mix typically includes flow exports, SNMP polling, packet header analysis, and availability checks.  

Paessler PRTG handles all of these with dedicated sensors for each method, configurable polling intervals, and up to 12 months of stored data per sensor. Results land in dashboards, per-sensor graphs, and exportable reports. Cross a threshold and PRTG fires a notification via email, SMS, or push, whichever channel you configure. 

PRTG monitors network activity via: NetFlow v5/v9 · IPFIX · sFlow · SNMP v1/v2c/v3 · Packet Sniffer · Ping v2 · QoS Round Trip · DNS · Routers · Switches · Firewalls · Wi-Fi Access Points · VPN Gateways · Linux/Windows/Docker hosts  

Download PRTG Trial

What you will find on this page

  • Complete Network Visibility
  • How PRTG Monitors Network Activity
  • Manual Network Activity Monitoring vs. PRTG
  • FAQs

PRTG is compatible with all major vendors, products, and systems

compatible with all major vendors, products, and systems

Complete Network Visibility, From Traffic to Trends

What's Using Your Bandwidth and How Much 

PRTG's network traffic monitoring breaks down traffic by type and protocol. Not a raw utilization number.  

Flow data comes in from routers and switches through the NetFlow v5 Sensor, NetFlow v9 Sensor, IPFIX Sensor, or sFlow Sensor. PRTG reports it per interface, by traffic type and protocol. IPv4 and IPv6 both work for NetFlow and IPFIX. The sFlow Sensor is IPv4 only. If your hardware doesn't export flow data, the Packet Sniffer Sensor steps in and analyzes packet headers directly on the probe's local network adapter. Header analysis only, no payload inspection. One thing worth knowing: your router or switch does the exporting. PRTG receives that data. It doesn't generate it.  

  • Receives flow data via NetFlow v5 Sensor, NetFlow v9 Sensor, IPFIX Sensor, and sFlow Sensor from compatible routers and switches
  • Supports IPv4 and IPv6 traffic
  • Identifies bottlenecks by breaking traffic down by type and protocol per interface
  • Packet Sniffer Sensor covers local adapter traffic where flow export isn't available (header analysis only, no payload inspection)
  • Displays bandwidth and data usage by protocol per sensor over time
RTG web interface showing live performance graphs for a Probe Health sensor

Live graphs, real-time performance data
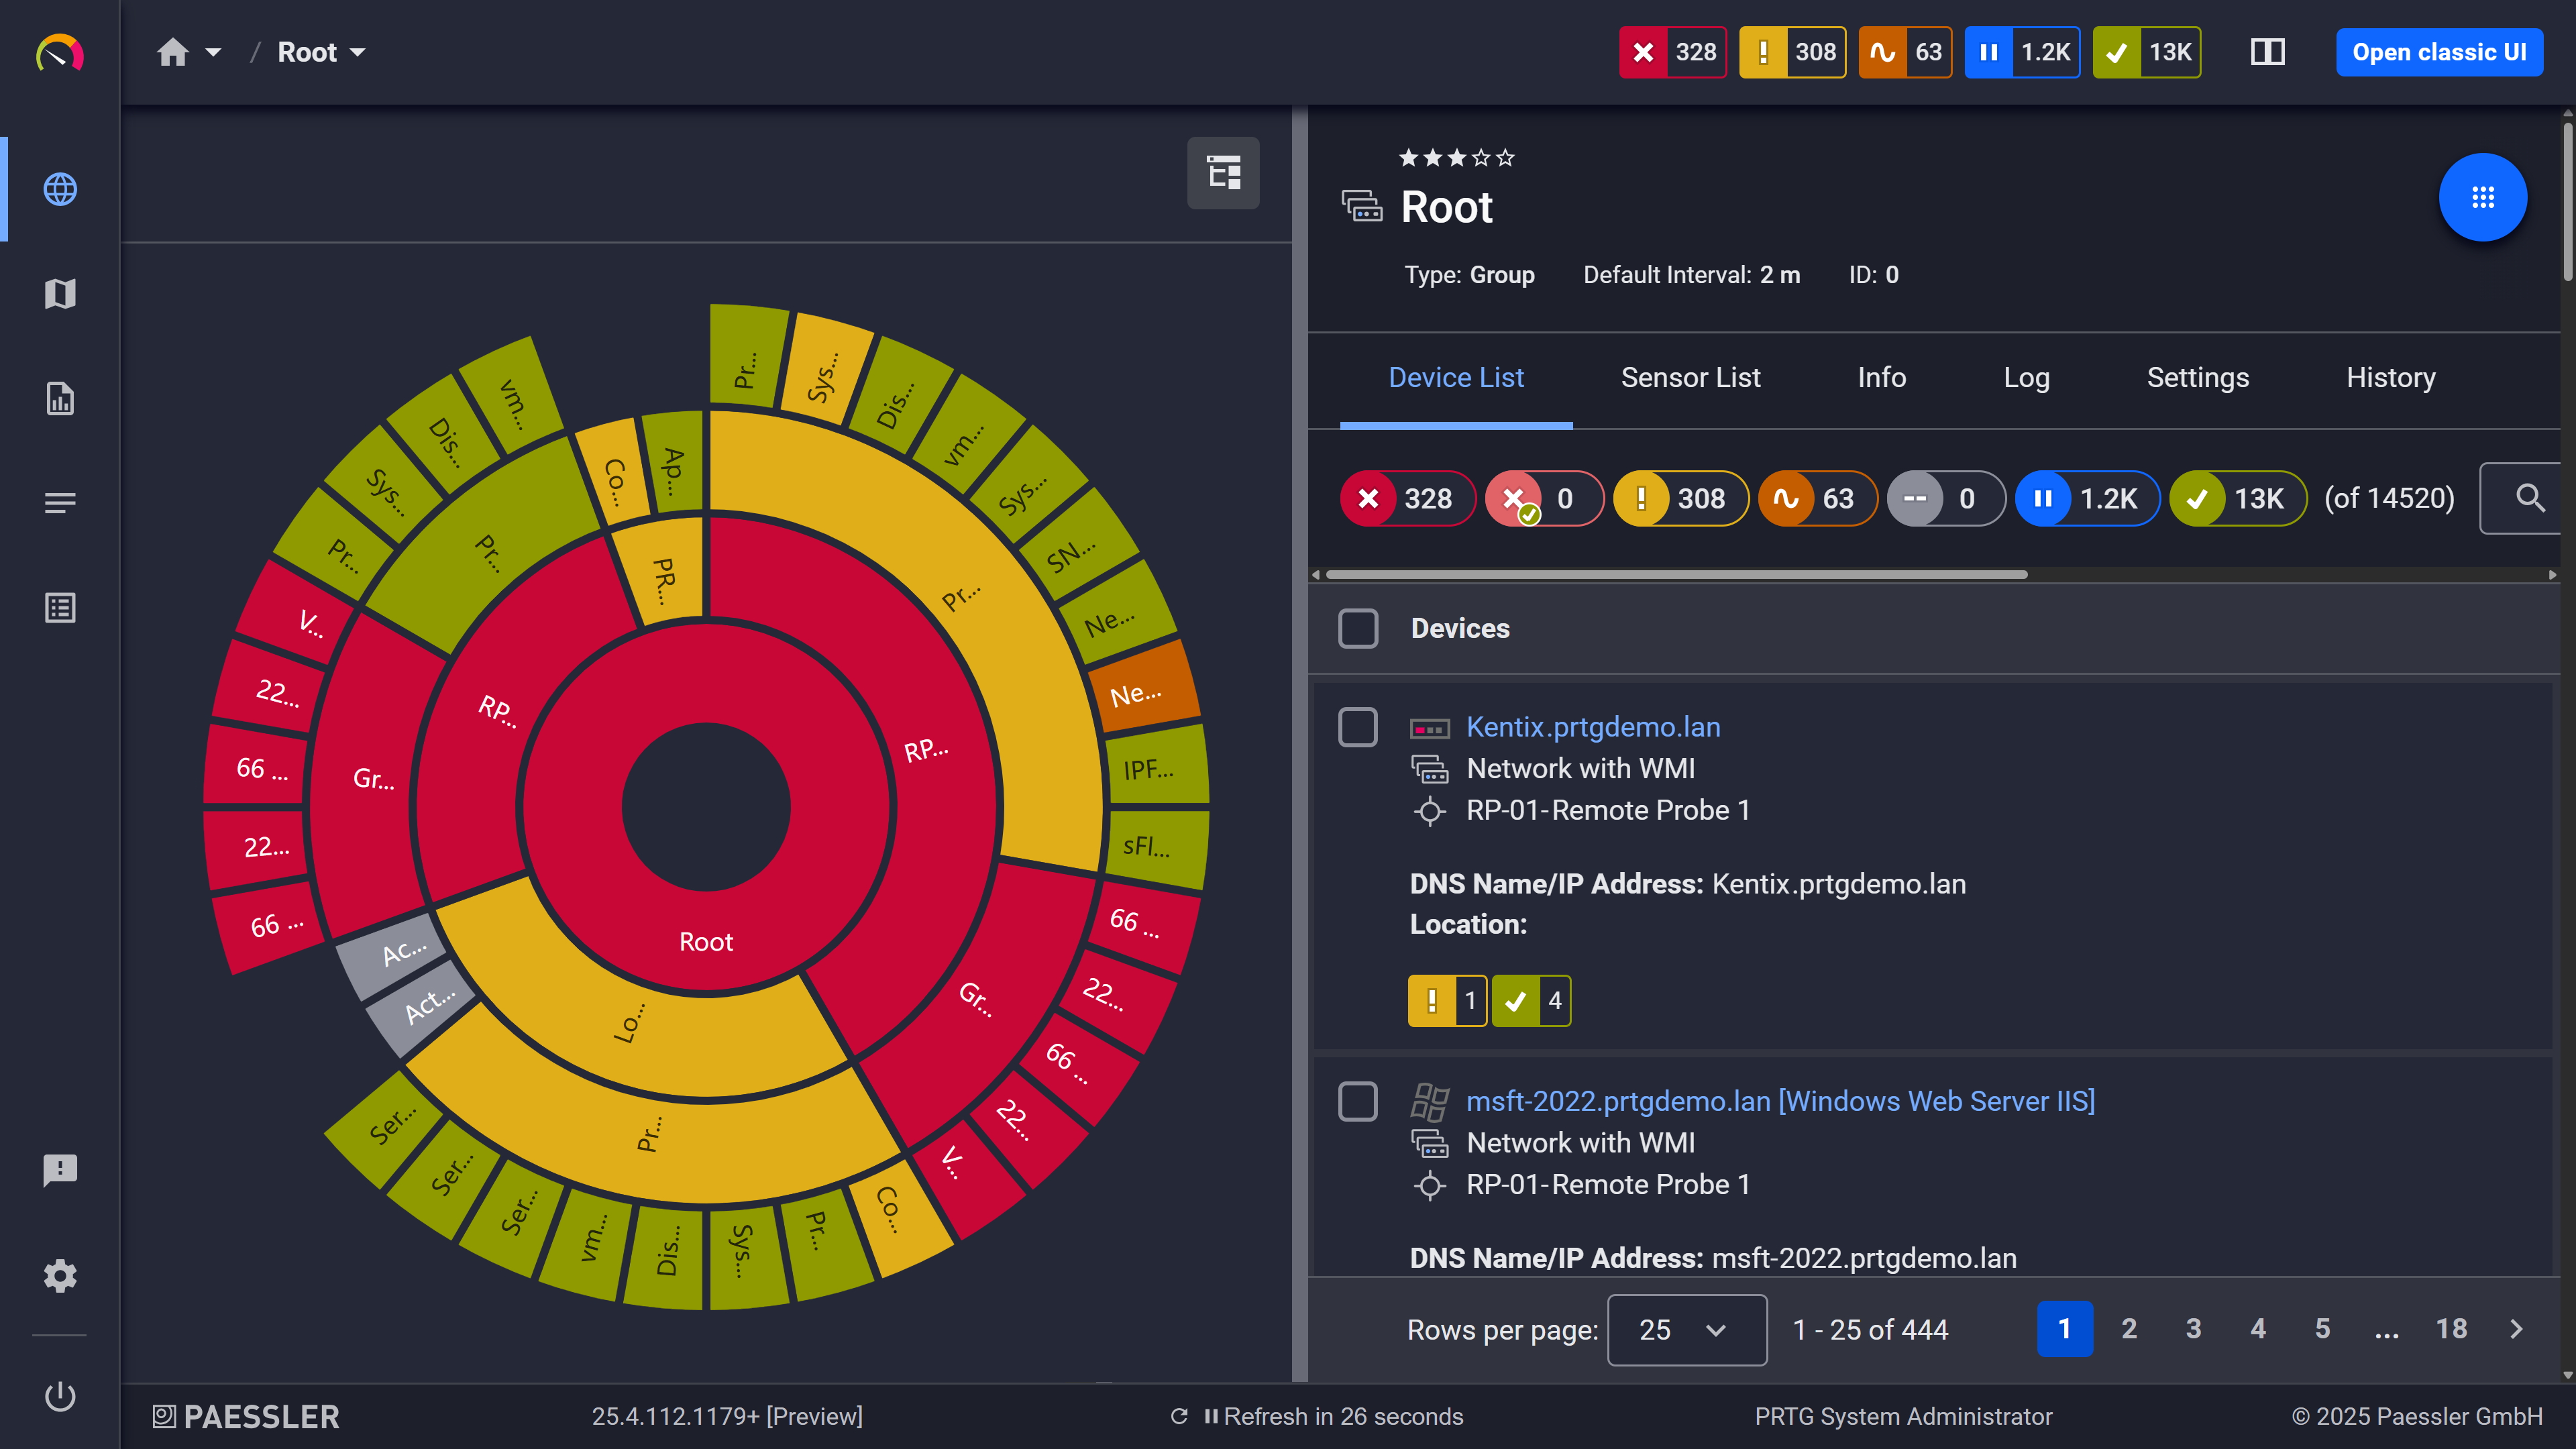
PRTG sunburst chart visualizing the full network hierarchy with color-coded sensor status

Your entire network, visualized instantly
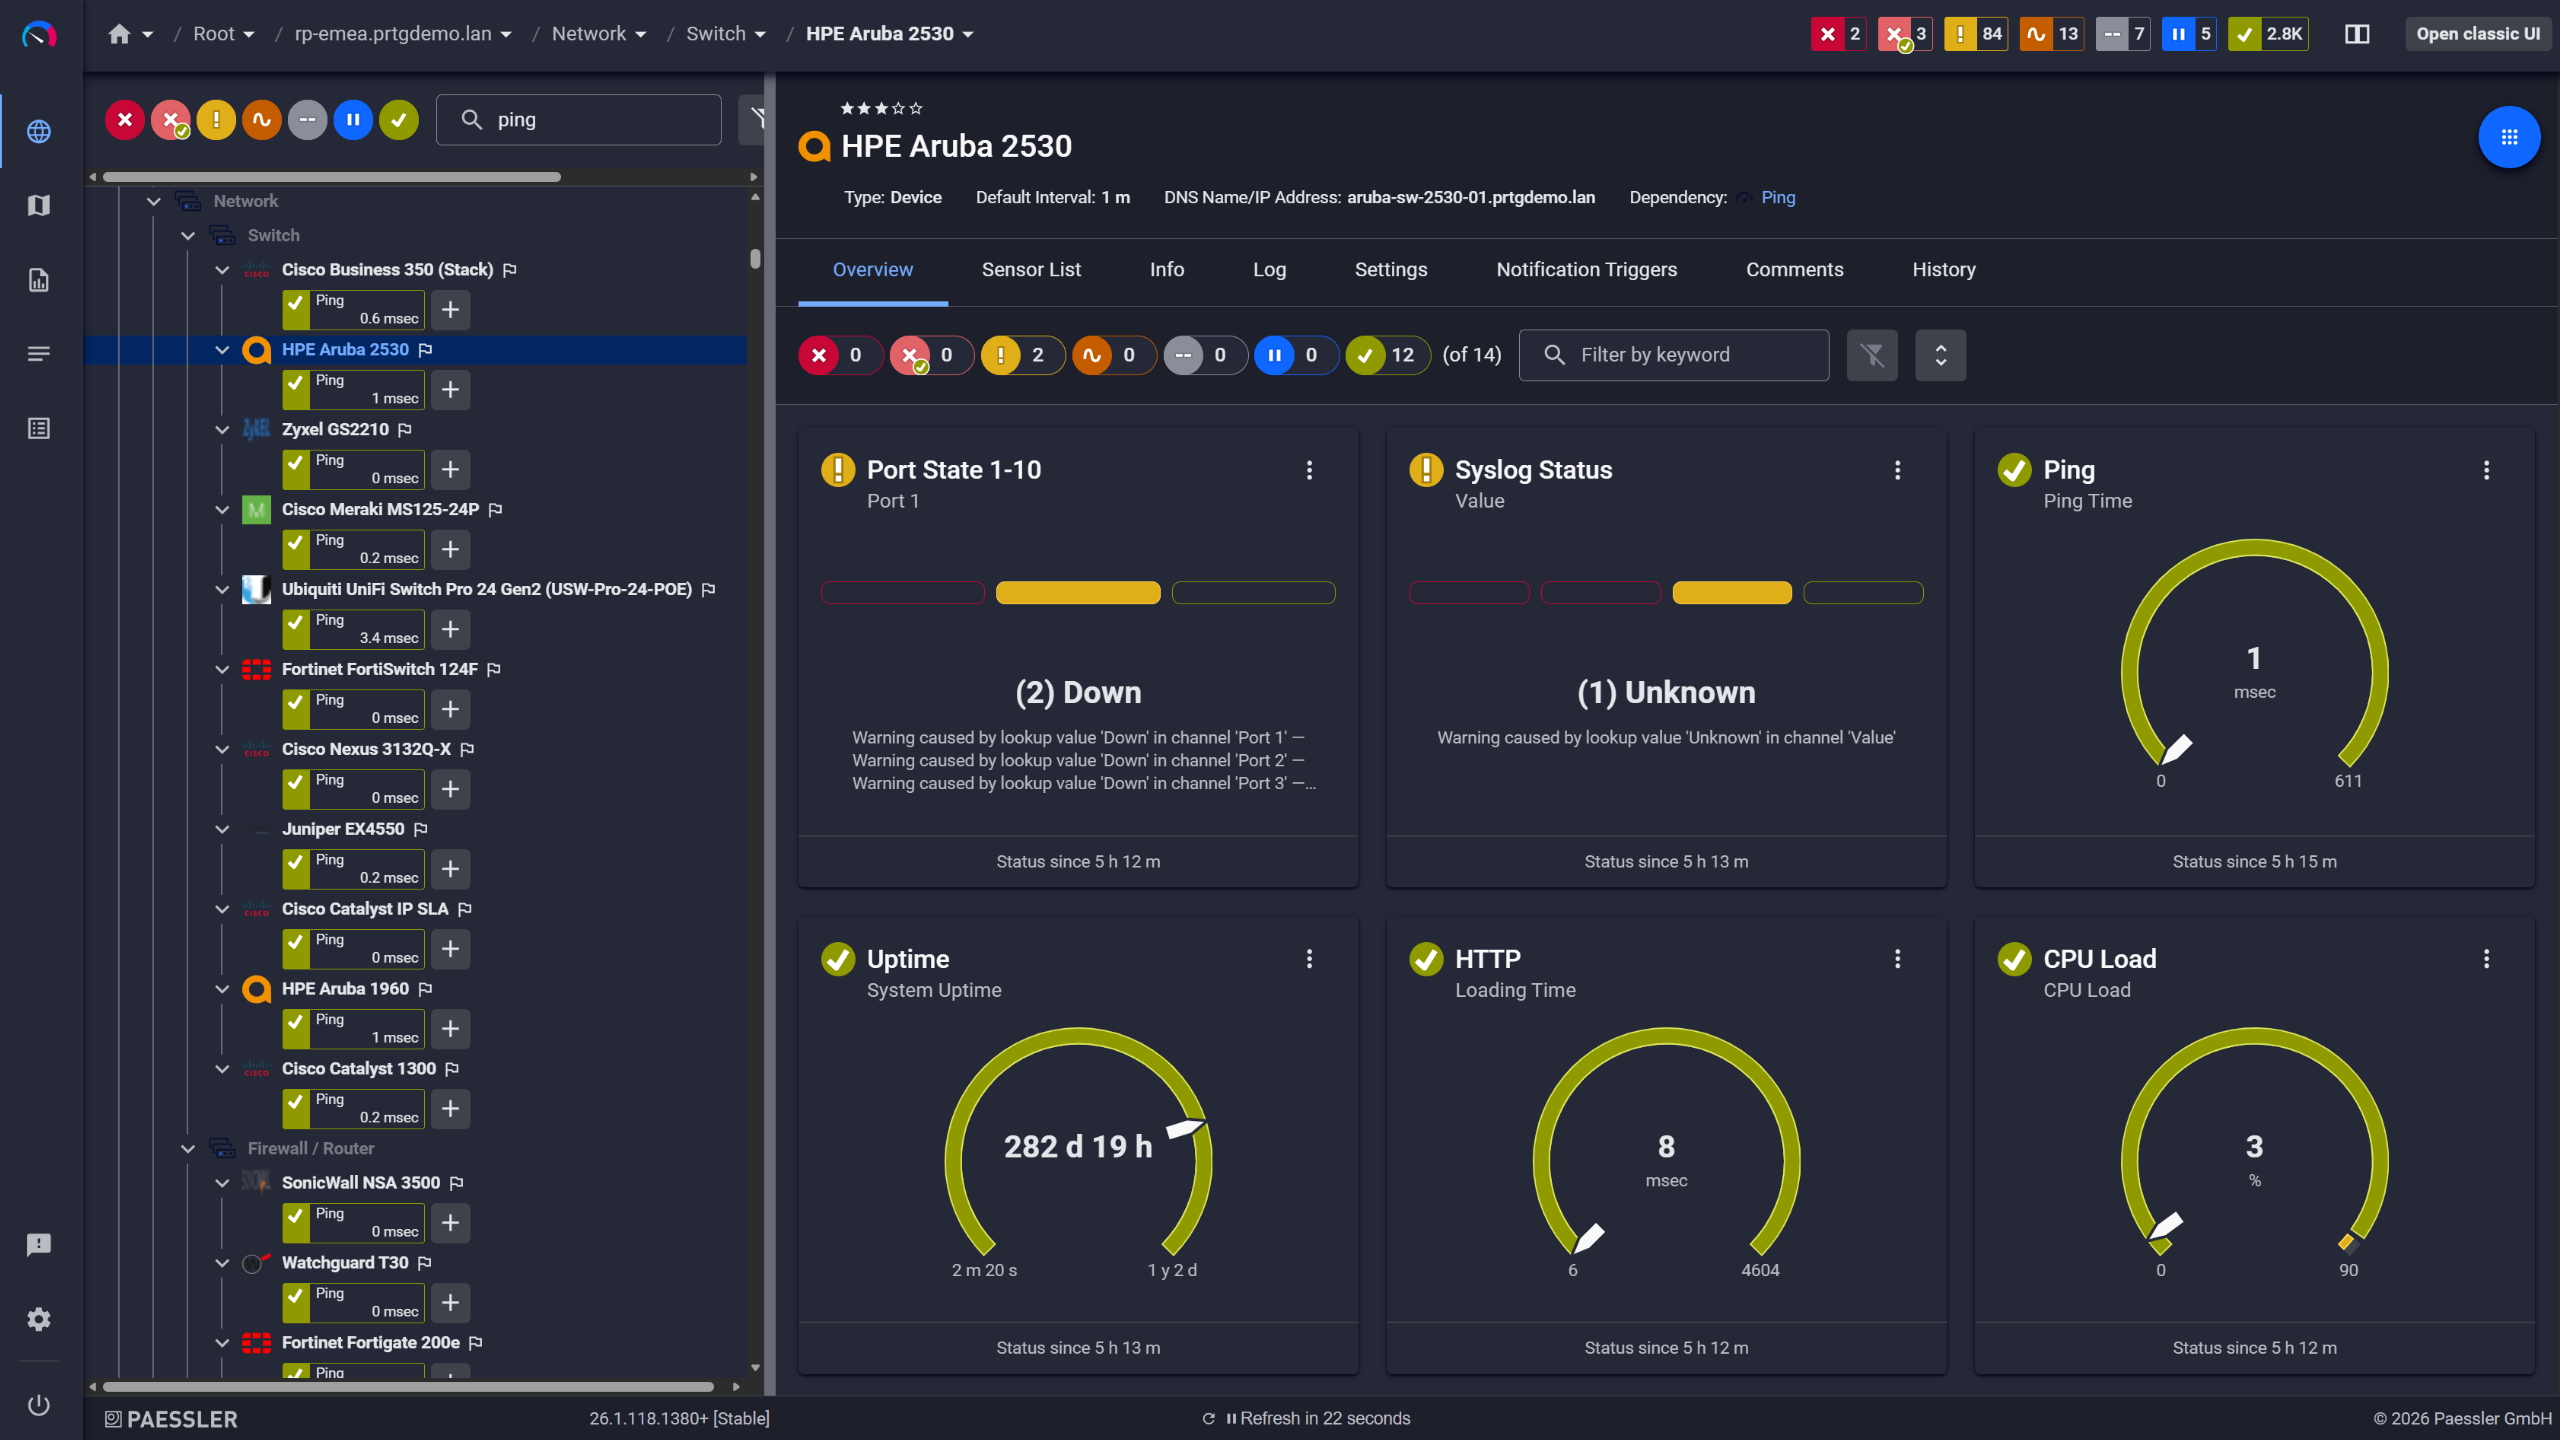
PRTG device overview for an HPE Aruba 2530 switch with port state, ping, and CPU sensors

Network switches monitored across vendors

Know About Network Issues Before Your Users Do   

Set your thresholds, and PRTG handles the watching.  

For routers, switches, and firewalls, SNMP Traffic sensors report inbound and outbound traffic volumes alongside error and discard counters. The Ping v2 Sensor tracks availability, response time, and packet loss per device. Warning and error thresholds are configurable at the sensor channel level. Worth knowing: PRTG scans at set intervals. It's not a real-time streaming system, so a spike that resolves within a single scanning interval may not show up.  

  • SNMP Traffic sensors: interface utilization, error counters, discard counters
  • Ping v2 Sensor: availability, response time, and packet loss per device
  • Configurable warning and error thresholds per sensor channel
  • Notifications sent via email, SMS, push, and other channels
  • Alerting is threshold-based. No AI-based or predictive detection

See Why IT Professionals Trust PRTG

Start monitoring your infrastructure in minutes. No professional services, no complex configuration, no risk.

Free download
PRODUCT OVERVIEW

Monitor Every Site From One PRTG Instance 

Install a remote probe at each location. All data reports back to the central PRTG core server.  

Remote probes extend monitoring to networks separated from the core server by firewalls, or in other locations. Classic probes run on Windows and give you the full sensor set. Multi-platform probes cover Linux (Debian, Ubuntu, RHEL), Docker, and Raspberry Pi, but with areduced sensor subset. Before rolling one out at a site where you need specific sensor types, check the PRTG manual for current limitations. Each probe needs a local host and a network path back to the core server. Not zero-touch, but once it's running, everything feeds into one interface.  

  • Classic remote probes (Windows): full PRTG sensor range supported
  • Multi-platform probes (Linux, Docker, Raspberry Pi): subset of sensors, with feature limitations
  • All probes report to one central PRTG core server
  • Configuration managed centrally; all monitoring data visible in one interface
  • Requires one system per site for probe installation and connectivity back to core
PRTG web interface showing device tree and full device list with sensor status badges

Full device list, instant overview

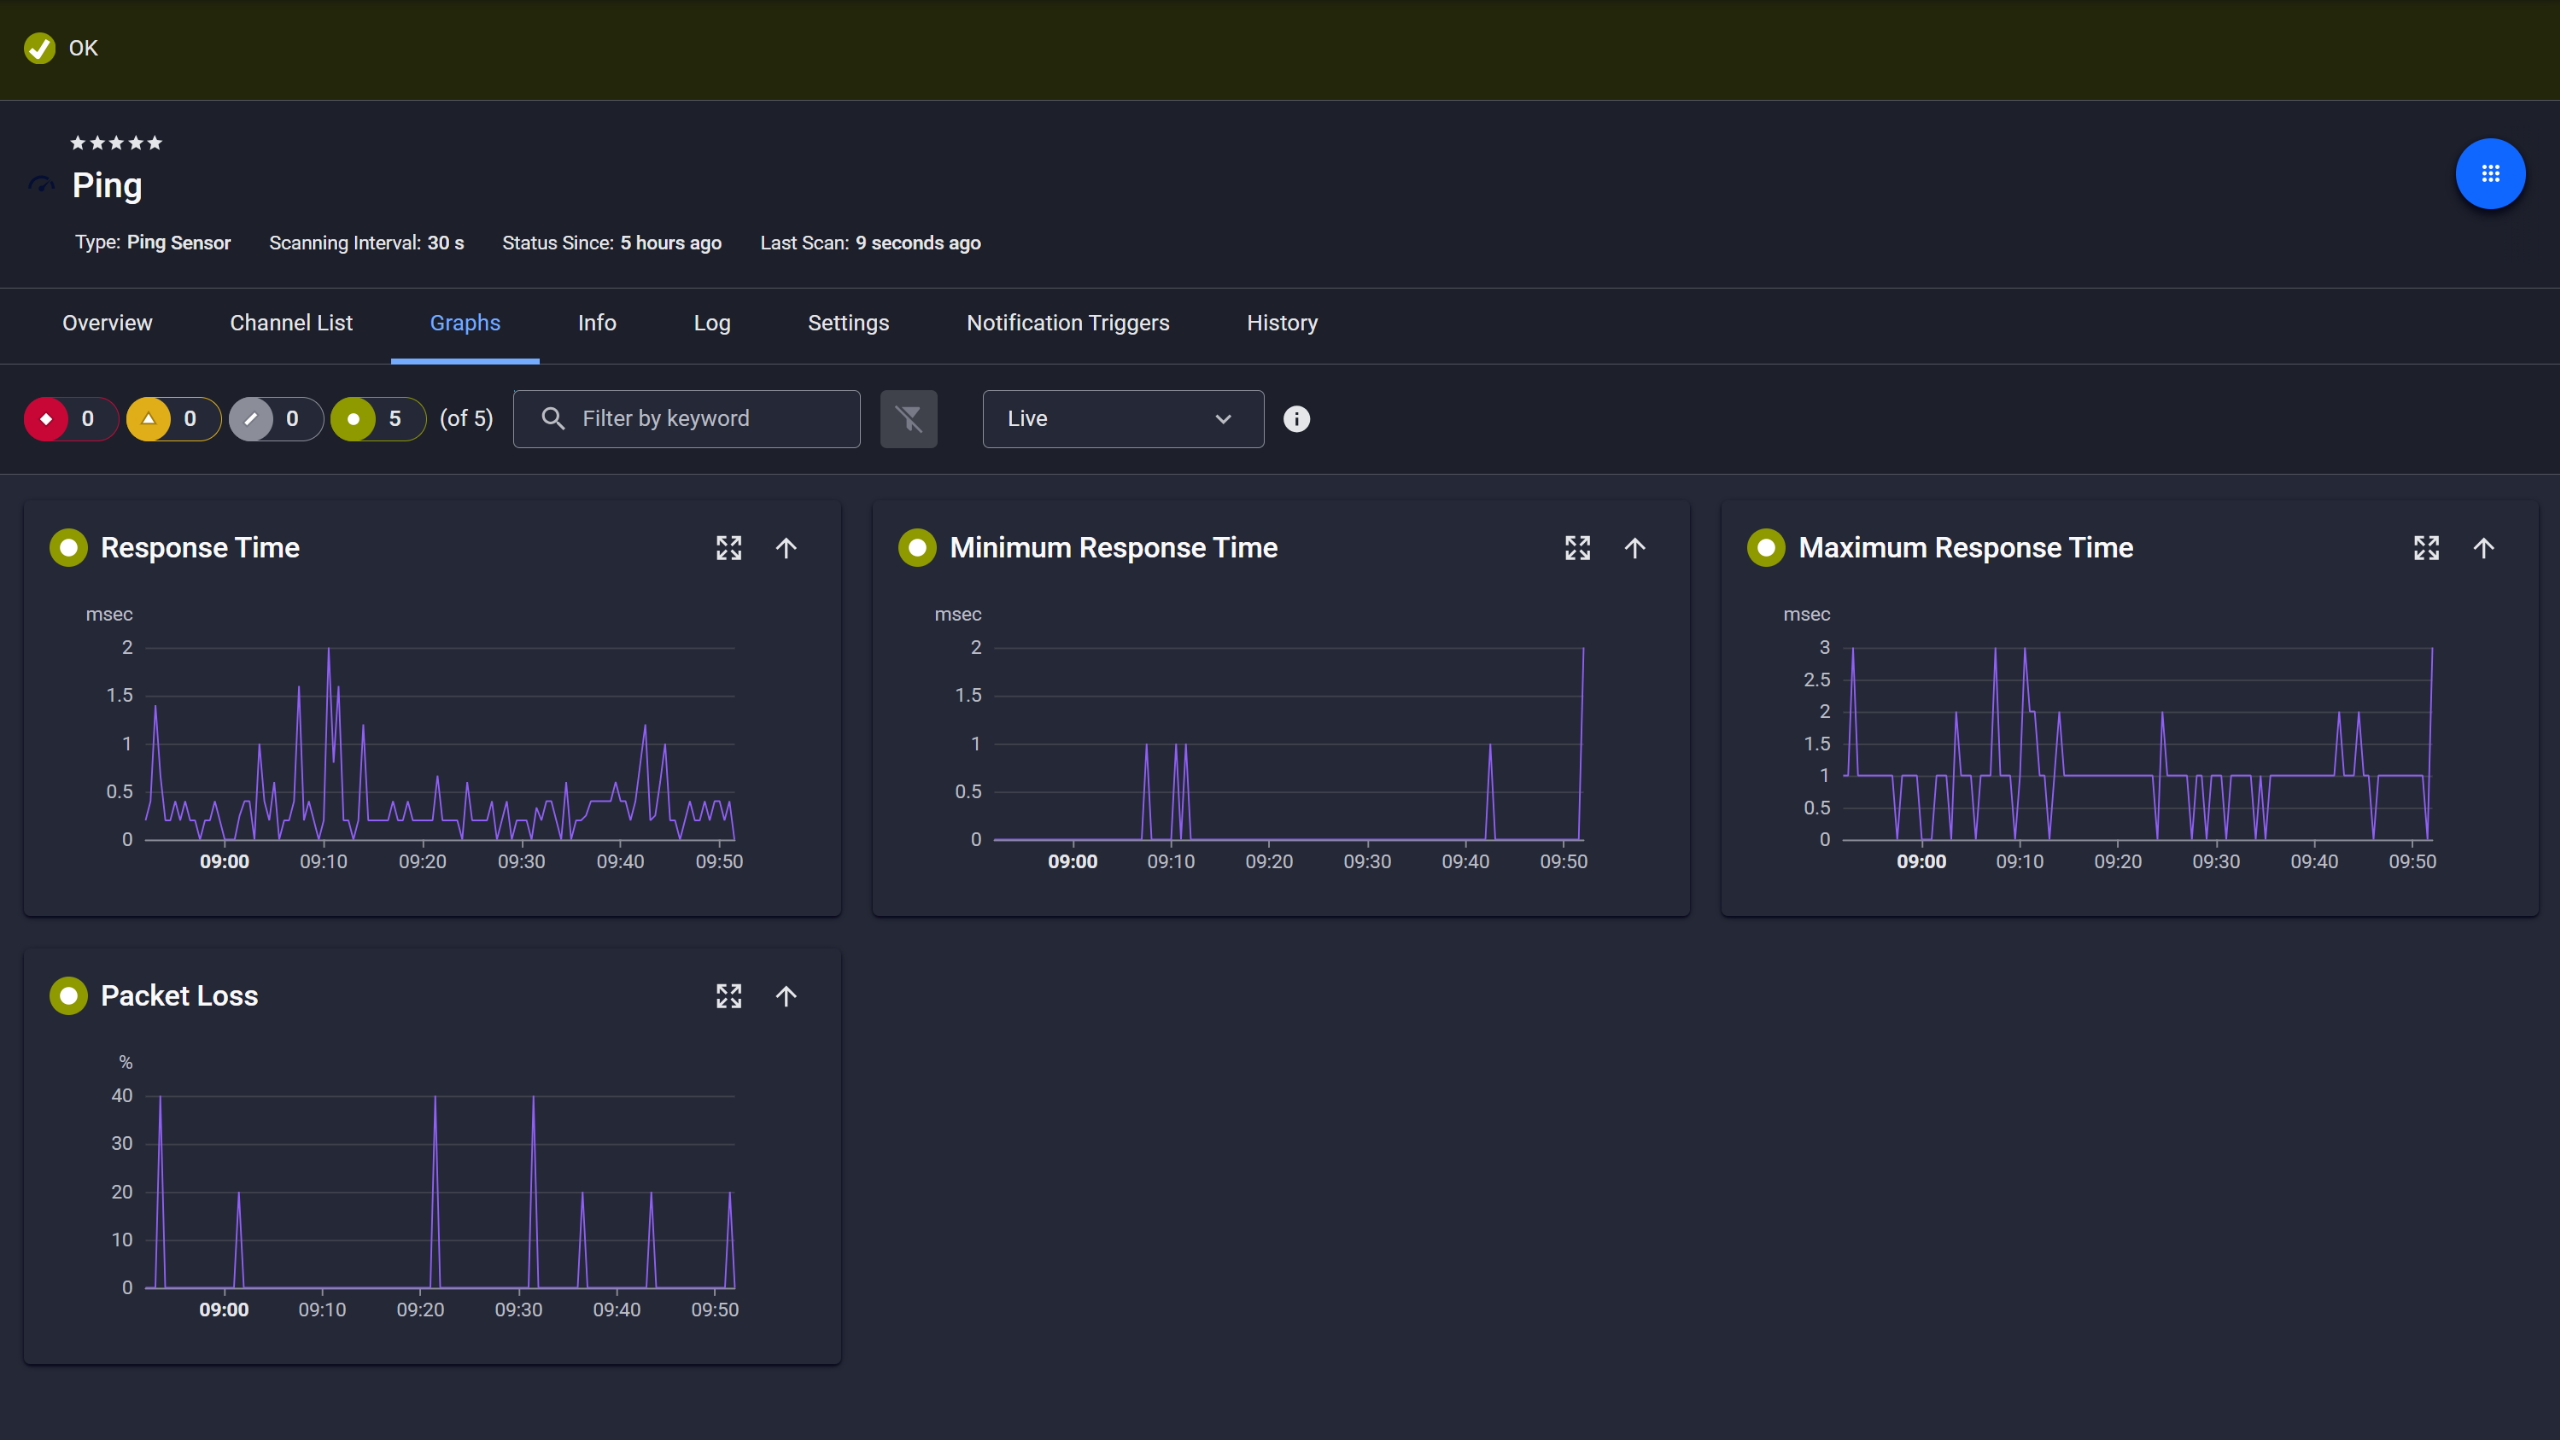
PRTG Ping sensor graphs showing response time, min, max, and packet loss over time

Ping response and packet loss

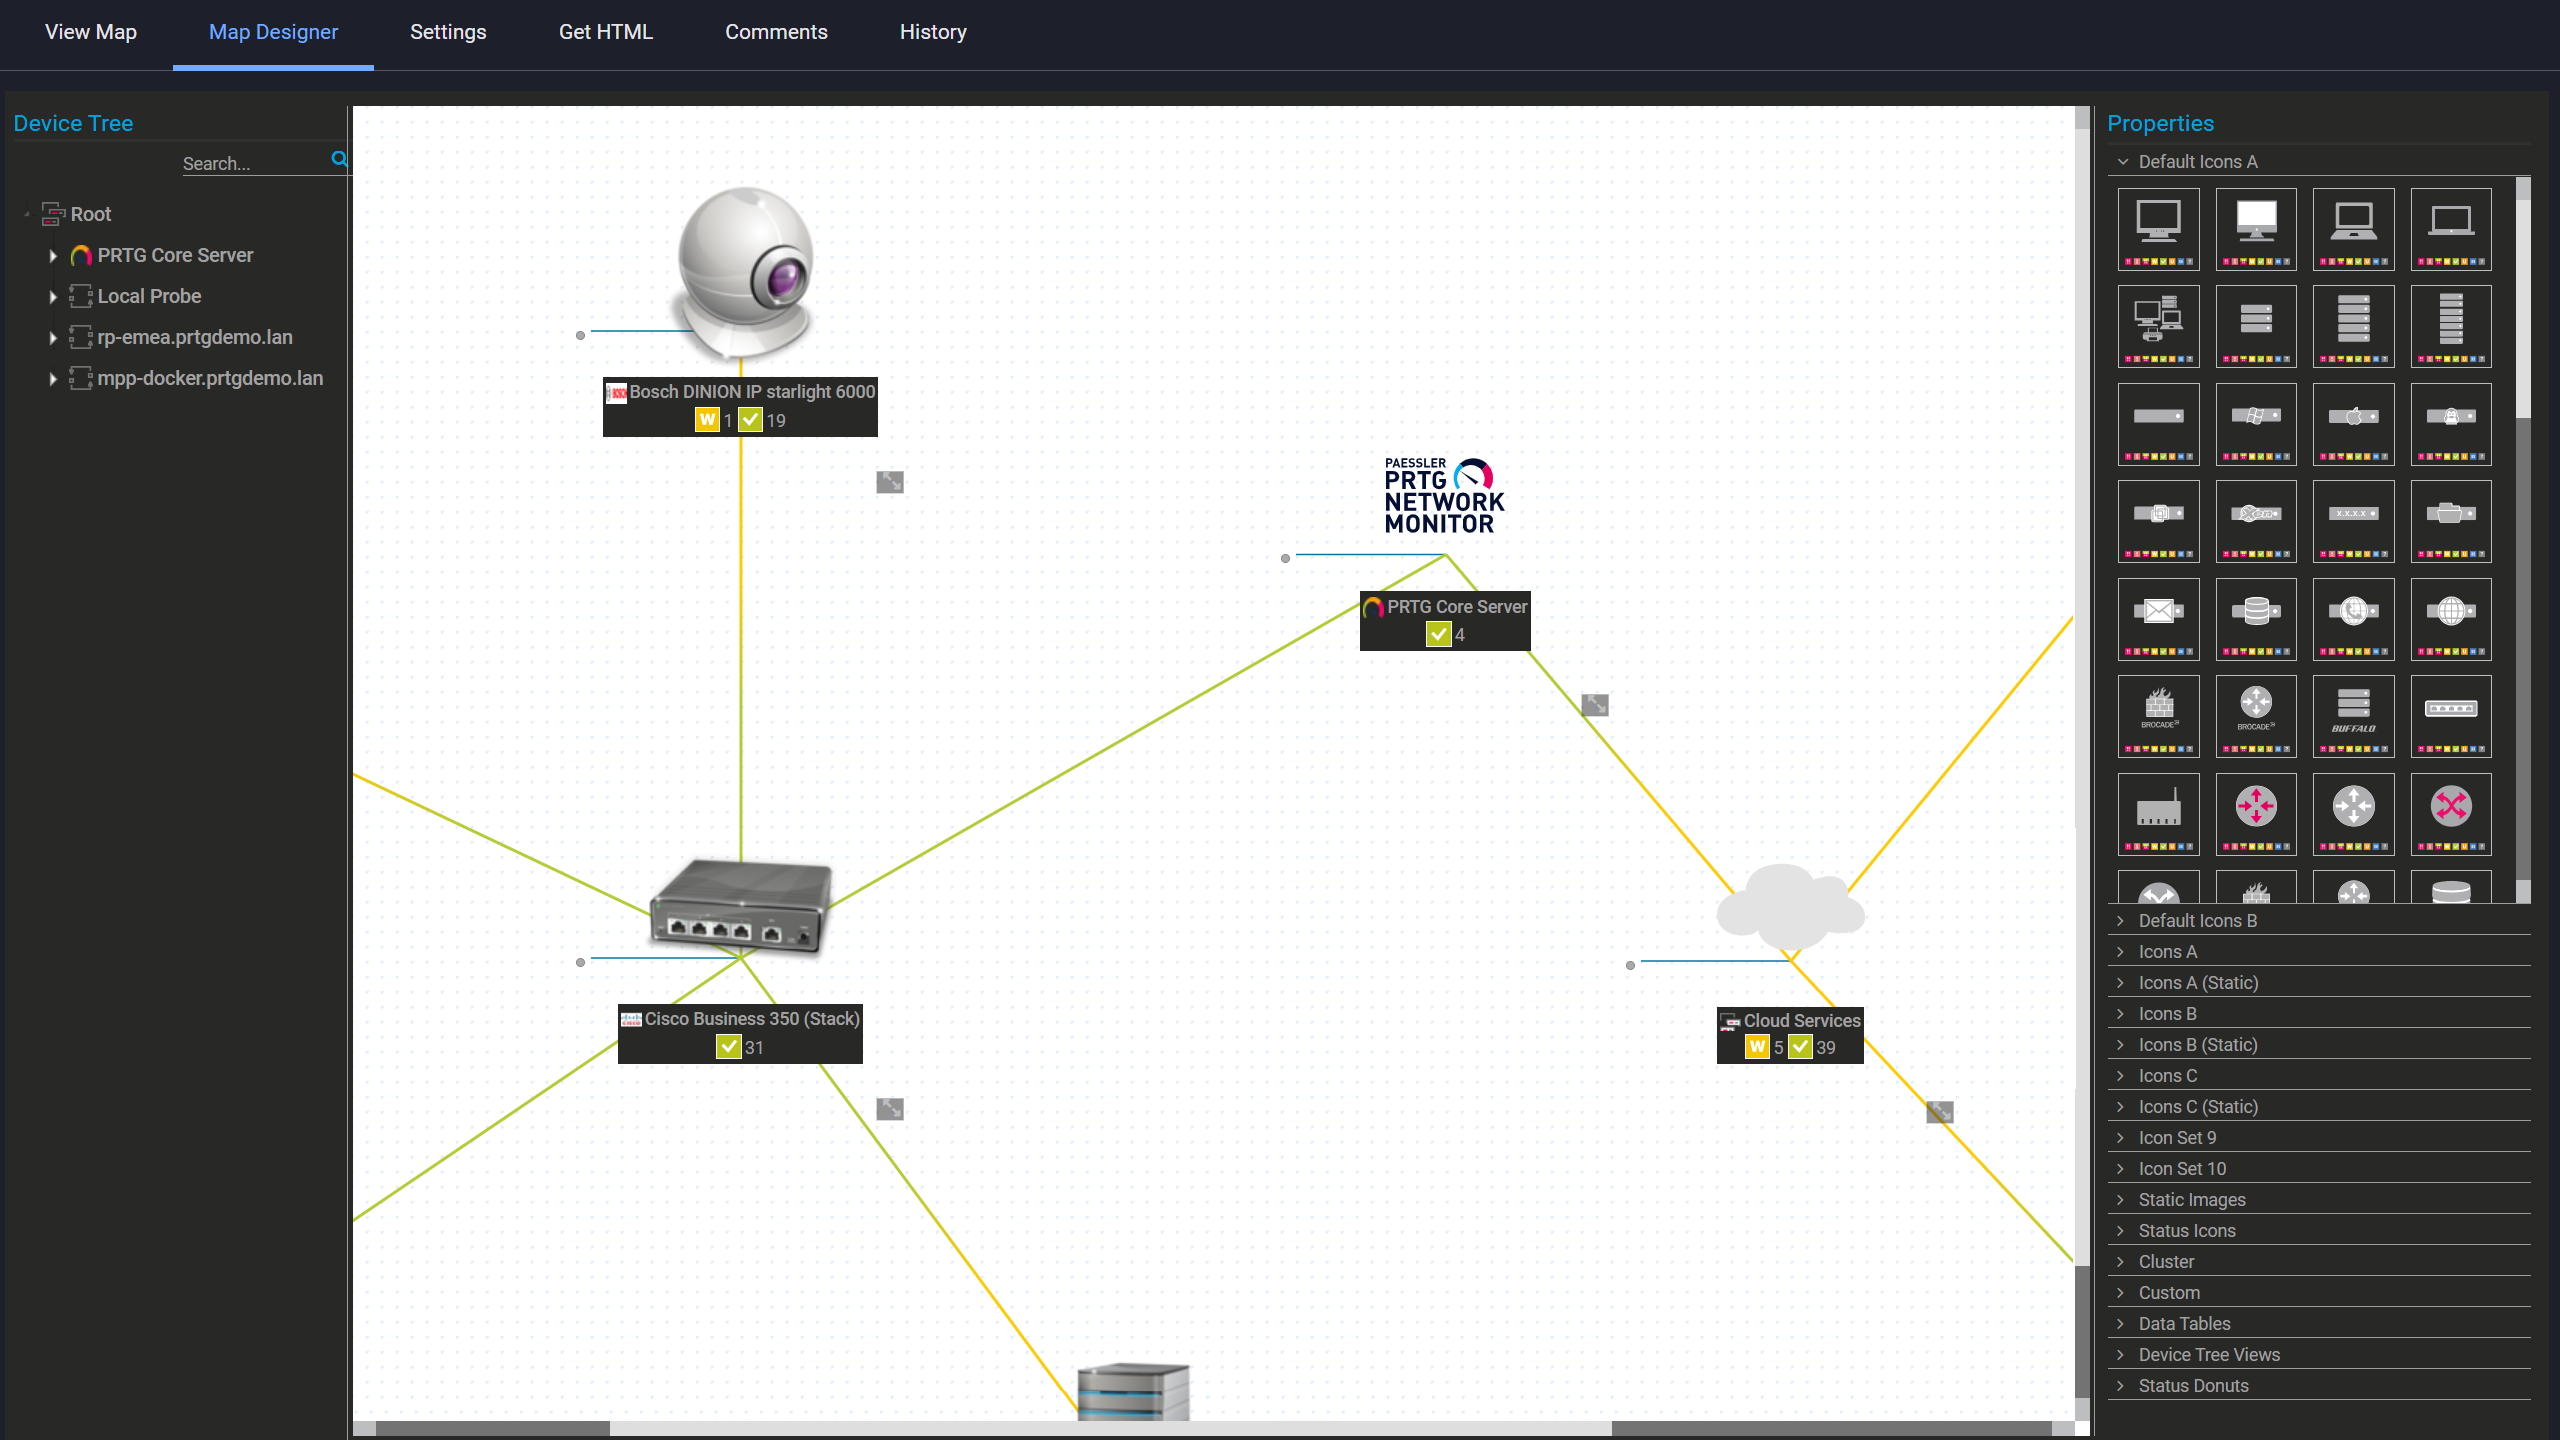
PRTG Map Designer showing a custom network map with live device status and vendor icons

Custom maps with live status

Review What Your Network Was Doing at Any Point in the Past   

Every PRTG sensor records data at each scanning interval. Reports pull from up to 12 months of stored data, on demand.  

A WAN link creeping from 40% to 75% utilization over several weeks shows up clearly in per-sensor trend graphs. Same goes for last week's slowdown or last month's spike: pull the sensor graph and the data's there. Retention depends on your Historic Data Purging settings and available disk space, so there's no unlimited retention by default. PRTG shows you how performance looked over time. Root cause analysis isn't part of it.  

  • Per-sensor historical data from 1 day up to 12 months
  • Exportable as HTML, PDF, CSV, or XML
  • Per-sensor graphs available without additional configuration
  • Useful for network performance monitoring, incident documentation, capacity planning, and trend review
  • Retention governed by Historic Data Purging settings and available disk space

How PRTG Monitors Network Activity

PRTG collects network data through several different methods. Which ones apply depends on your hardware and where your probes are installed.  

Packet Header Analysis   

The Packet Sniffer Sensor monitors traffic on a local network adapter by analyzing packet headers. No payload inspection. It identifies traffic by protocol, including FTP, HTTP, SMTP, DNS, RDP, SSH, UDP, and TCP, and reports each as a percentage of total traffic.  

No upstream flow export required. That makes it useful where routers or switches don't support NetFlow or sFlow. The sensor runs on the probe host and sees only the traffic passing that adapter, not the rest of your network. IPv4 and IPv6 work fine. One thing to watch: each Packet Sniffer Sensor adds load to the probe, and the PRTG manual suggests keeping the count per probe low.  

Latency and Jitter 

The QoS (Quality of Service) Round Trip Sensor measures latency, jitter, and round-trip time between two PRTG probe locations. UDP packets travel between probes; PRTG reports on what that path looks like.  

That makes it practical for checking link quality between two specific segments, like a data center and a branch office. It won't measure performance to arbitrary internet endpoints or third-party hosts. Scope is always the two probe locations involved.  

Wireless Network Monitoring   

PRTG monitors Wi-Fi access points via SNMP. Signal strength, connected client count, channel utilization: what's actually reportable depends on which OIDs the access point hardware utilizes.  

SNMP has to be supported and enabled on the AP. PRTG reads what the device makes available. Active wireless scanning, RF analysis, and spectrum monitoring aren't part of it. 

Dashboards and Device Tree

All monitored devices and sensors appear in a structured device tree. From there, you can build custom dashboards that pull sensors from different devices, sites, or sensor types into one view: by site, by technology, or across everything.  

Dashboards are user-configured, not auto-generated. PRTG includes a the Maps editor for visual topology views, but maps need manual setup. Auto-discovery finds devices on a subnet; it stops there and doesn't assign sensors or wire up a full topology on its own. Every monitored metric gets a sensor-level graph with no extra configuration needed. 

DNS and IP Monitoring 

The DNS Sensor queries a hostname against a specified DNS server and checks whether the response matches an expected result. It reports resolution time and whether the answer was correct. For IP-level work, PRTG tracks availability of individual addresses or ranges using ping-based sensors.  

DNS record management isn't part of it. PRTG checks resolution and response accuracy. That's the boundary. On the IP side, tracking is ping/SNMP based. PRTG isn't an IPAM tool and doesn't touch IP allocations or DHCP leases. 

free downLoad

What You Get With PRTG Network Activity Monitoring vs. Doing it Manually 

FEATURE

Without PRTG

Without PRTG

With PRTG

With PRTG 

Traffic breakdown by type & protocol 

Without PRTG
not included

Manual flow export + separate collector required 

With PRTG
included

Built-in NetFlow v5/v9, IPFIX, and sFlow sensors 

Interface & device health alerts 

Without PRTG
not included

Issues noticed after user complaints 

With PRTG
included

Threshold-based; notification sent via email, SMS, or push 

Remote site visibility 

Without PRTG
not included

No central view; checked per site individually 

With PRTG
included

Remote probes at each site, reporting to one core server 

Historical performance data 

Without PRTG
not included

Manually exported logs, if collected at all 

With PRTG
included

Up to 12 months per sensor, on demand 

DNS & IP address monitoring 

Without PRTG
not included

Separate tools or manual checks 

With PRTG
included

Native sensors in the same PRTG interface 

free downLoad

“I would recommend PRTG because it has helped us significantly improve service uptime by highlighting important alerts that would otherwise result in a system failure or service disruption if action was not taken. Thanks to PRTG, we can ensure that The Ritz London’s network and IT systems are five-star, just like the hotel.”

Richard Isted, IT Manager
The Ritz London

Ultimately, people do better when they focus on the solution, not the tool. This is the mantra we live by at Skyscanner. Without PRTG, we’d still be spending half a day or more on monitoring our internal tools.

Barry Kelly, Systems Engineer
Skyscanner

Adopting PRTG has been like going from being in the dark to being in the light. Before, we had limited visibility into what was happening in the infrastructure and in the network. Now, however, thanks to the comprehensive dashboard and real-time notifications, we receive constant updates on the status of facilities and services, and our way of working has gone from passive to proactive.

Luca Meneghesso, senior IT infrastructure and security specialist
Banca Profilo

Paessler PRTG Network Monitor licenses & pricing

Choose the PRTG Network Monitor subscription that's best for you.

License NameLicense descriptionPriceLicense DetailsGet startedPricing Details
PRTG 500$200per month paid annuallyBuy nowBuy now

Enough to monitor multiple aspects of 50 devices

PRTG 1000$358per month paid annuallyBuy nowBuy now

Enough to monitor multiple aspects of 100 devices

PRTG 2500$742per month paid annuallyBuy nowBuy now

Enough to monitor multiple aspects of 250 devices

PRTG 5000$1,300per month paid annuallyBuy nowBuy now

Enough to monitor multiple aspects of 500 devices

PRTG 10000$1,642per month paid annuallyBuy nowBuy now

Enough to monitor multiple aspects of 1000 devices

Over 100,000 Customers Worldwide Love Paessler  

customer success stories

 Network Activity Monitoring with PRTG: Frequently Asked Questions 


Does PRTG monitor both IPv4 and IPv6 network traffic?

Yes, across all the main collection methods. NetFlow v5, v9, IPFIX, and the Packet Sniffer Sensor handle both. The sFlow Sensor is IPv4 only. SNMP polling and ping availability checks do too. 

How does PRTG compare to Wireshark for network traffic analysis?

Most engineers use both and don't think of it as a competition. PRTG runs in the background: continuous polling, stored metrics, alerts when something crosses a threshold. Wireshark comes out when you need to look at specific traffic right now. You run a capture, analyze what you see, move on. Nothing gets stored, nothing alerts. 

Can PRTG detect malware or security threats on the network?

Traffic volumes and bandwidth metrics are what PRTG tracks. A threshold on a flow or SNMP Traffic sensor will fire a notification if something spikes hard enough. Worth looking into or not. That call is yours. Payload inspection, threat signature matching, behavioral analysis: dedicated security tooling does that job. PRTG doesn't. 

Can PRTG monitor VPN tunnels and remote network connections?

The gateway itself is straightforward. SNMP and ping cover availability, interface utilization, and response time. Tunnel status OIDs can be polled too, if the device exposes them. Past the gateway gets harder. Standard approach is a remote probe on-site. It monitors the local segment and reports back to the core server independently. What moves through the tunnel isn't visible to PRTG, and VPN configuration isn't something it touches. 

What's the difference between PRTG and open-source network monitoring tools?

Zabbix and Nagios don't cost a license fee. That's the easy part of the comparison. Setup, configuration, ongoing maintenance, figuring out what broke when something stops working: that's your team's problem. Community forums are typically the support option. PRTG costs money and ships with pre-built sensors and a vendor support contract. Most of what you're buying is time. 

How does PRTG help with network troubleshooting and root cause analysis?

When something went wrong, the sensor data from that period is already logged. Open the graph, pick the timeframe, and you can see when a metric shifted and by how much. PRTG doesn't interpret the data or point to a cause. That part's still on the engineer. But having up to 12 months of readings on hand beats reconstructing events from memory.  

Paessler PRTG

Paessler PRTG

Network Monitoring Software – Version 26.1.116.1532 (February 9th, 2026)

Hosting icon

Hosting

Download for Windows and cloud-based version PRTG Hosted Monitor available

Languages icon

Languages

English, German, Spanish, French, Portuguese, Dutch, Russian, Japanese, and Simplified Chinese

test

Monitor everything

Network devices, bandwidth, servers, applications, virtual environments, remote systems, IoT, and more

test

Pricing

Choose the PRTG Network Monitor subscription that's best for you

Discover more monitoring insights and stories

Content illustration

Powerful stories from the monitoring world

  • Monitoring Basics: How to Check Network Traffic - Paessler Blog
  • How to Look at Network Traffic: Essential Tools and Methods for ...
  • No Budget? No Problem! The Poor Man's Guide to Monitoring ...
Support illustration

Resources to master your monitoring challenges

  • PRTG Manual: SNMP Traffic Sensor - Paessler
  • XBox network Internet Traffic Monitoring
  • how can I monitor all my network traffic in a real-time graph
Solution illustration

Solutions for all your monitoring needs

  • Network Activity Monitoring
  • Tracking Network Traffic
  • Network Usage Monitoring
PRTG Logo

Start Monitoring with PRTG and see how it can make your network more reliable and your job easier.

Free download
PRODUCT OVERVIEW

Products

  • Paessler PRTG
    Paessler PRTGMonitor your whole IT infrastructure
    • PRTG Network Monitor
    • PRTG Enterprise Monitor
    • PRTG Hosted Monitor
    • PRTG UVexplorer
    • PRTG extensions
      Extensions for Paessler PRTGExtend your monitoring to a new level
  • Icon Features
    FeaturesExplore all monitoring features

Monitoring with PRTG

  • Network monitoring
  • Bandwidth monitoring
  • SNMP monitoring
  • Network mapping
  • Wi-Fi monitoring
  • Server monitoring
  • Network traffic analyzer
  • NetFlow monitoring
  • Syslog server

Useful Links

  • PRTG Manual
  • Knowledge Base
  • Customer Success Stories
  • About Paessler
  • Subscribe to newsletter
  • PRTG Support
  • PRTG Consulting
  • PRTG Feedback & Roadmap

Contact

Paessler GmbH
Thurn-und-Taxis-Str. 14, 
90411 Nuremberg 
Germany

[email protected]

+49 911 93775-0

  • Contact us
©2026 Paessler GmbHTerms & ConditionsPrivacy PolicyImprintReport VulnerabilityDownload & InstallSitemap
Ping Ping Ping