• Company
    • About Us
    • Case Studies
    • Press Center
    • Careers
    • Blog
    • Contact us
  • Contact us
  • Login
 
  • English
    • Deutsch
    • Español
    • Français
    • Italiano
    • Português
Paessler
                    - The Monitoring Experts
  • Products
    • Paessler PRTG
      Paessler PRTGMonitor your whole IT infrastructure
      • PRTG Network Monitor
      • PRTG Enterprise Monitor
      • PRTG Hosted Monitor
      • PRTG UVexplorer
      • PRTG extensionsExtensions for Paessler PRTGExtend your monitoring to a new level
    • Icon Features
      FeaturesExplore all monitoring features
      • Maps & dashboards
      • Alerts & notifications
      • Multiple user interfaces
      • Distributed monitoring
      • Customizable reporting
  • Solutions
    • Industries
      IndustriesMonitor various industry sectors
      • Industrial
      • Healthcare
      • Data Center
      • Education
      • Finance
      • Government
    • IT Topics
      IT TopicsMonitor all areas of IT
      • Network Monitoring
      • Bandwidth Monitoring
      • SNMP Monitor
      • Network Mapping
      • WiFi Monitoring
      • Server Monitoring
  • Pricing
  • Resources
    • Getting Started
      Getting StartedModules for self-paced learning
    • How-to Guides
      How-to GuidesGet the most out of PRTG
    • Videos & Webinars
      Videos & WebinarsLearn from Paessler experts
    • IT  Knowledge
      IT KnowledgeExpand your IT knowledge
    • PRTG Manual
      PRTG ManualFull documentation
    • Knowledge Base
      Knowledge BaseShare community knowledge
    • PRTG Sensor Hub
      PRTG Sensor HubGet sensors, scripts & templates
    • Trainings
      PRTG TrainingLearn how to work with PRTG
  • Partners
    • Icon Handshake
      Become a PartnerFor resellers and channel partners
    • Icon MSP
      Become an MSPDeliver monitoring as a managed service
    • icon partner
      Partner PortalLog in to your partner account
    • Deal Registration
      Deal RegistrationRegister your sales opportunities
    • icon search
      Find a PartnerFind partners selling Paessler products
    • icon technology
      Technology AlliancesSee Paessler technology partnerships
    • Partner HubTools for Your Success
  • Company
    • About Us
    • Case Studies
    • Press Center
    • Careers
    • Blog
    • Contact us
  • Contact us
  • Login
  • English
    • Deutsch
    • Español
    • Français
    • Italiano
    • Português
  • Get a quote
  • Free trial

Continuous IIS Log Analyzer and Monitoring 

Monitor IIS web servers, application pools, and Windows Event Logs with out-of-the-box sensors that deliver real-time visibility without the deployment headaches 

Free download
PRODUCT OVERVIEW

How Do You Monitor IIS Web Servers Without Manual Log Checking? 

Monitoring IIS infrastructure means keeping track of web server availability, application pool health, and Windows Event Logs across potentially dozens of servers simultaneously. Without continuous monitoring, errors surface through user complaints, and troubleshooting means remoting into servers, opening Event Viewer manually, and correlating data across tools that were never built to work together.

Paessler PRTG addresses this through out-of-the-box sensors that monitor HTTP response times, filter Windows Event Logs for errors and warnings, and track application pool performance using Windows performance counters. Whether you're running a handful of sites or managing distributed web farms, PRTG gives you infrastructure visibility and threshold-based alerting without complex deployment or per-server licensing fees.

Supported technologies: Windows Event Logs, HTTP/HTTPS, IIS Application Pools, WMI, SNMP, Windows Server 2008 R2+, IIS 7.5+

Download PRTG Trial

What you will find on this page

  • Complete IIS Visibility
  • How PRTG Monitors IIS Servers
  • IIS Monitoring: Manual vs. PRTG
  • FAQs

PRTG is compatible with all major vendors, products, and systems

compatible with all major vendors, products, and systems

Complete IIS Visibility, From Web Layer to Windows Event Logs

Prevent IIS Downtime Before Users Even Notice 

Website and application downtime costs more than just user frustration. Revenue stops. Tickets pile up. Your reputation takes a hit. And by the time users report a problem, you're already behind.

PRTG watches your Microsoft IIS web servers continuously, checking website availability and response times while verifying that critical content loads correctly. HTTP sensors test your sites and alert you the second something breaks. You catch the issue before it impacts service, often before anyone else knows there's a problem.

  • Monitor website uptime with automated HTTP availability checks running as frequently as every 30 seconds
  • Verify critical content loads correctly by checking for specific strings or status codes on key pages
  • Measure actual response times from the user's perspective to spot slowdowns early
  • Test from multiple locations if needed to ensure external availability
  • Review historical performance data to identify degradation trends over days or weeks

Catch Errors and Warnings in IIS Event Logs

IIS servers log application errors, authentication failures, service crashes, and warnings in Windows Event Logs. But who has time to remote into every server and dig through thousands of Event Viewer entries looking for the one critical error that explains why your site is slow?
 
PRTG monitors Windows Event Logs automatically, filtering for the errors and warnings that matter to you. When critical events appear in application, system, or security logs, you're notified immediately. No manual log checking. No complex queries.
  • Monitor application, system, and security event logs for IIS-related errors and warnings
  • Filter out noise using customizable triggers and keyword matching so you see what matters
  • Receive notifications when errors occur, not hours later during troubleshooting
  • Link log events with performance metrics to understand exactly what failed and when
  • Spot recurring issues or patterns that point to deeper infrastructure problems
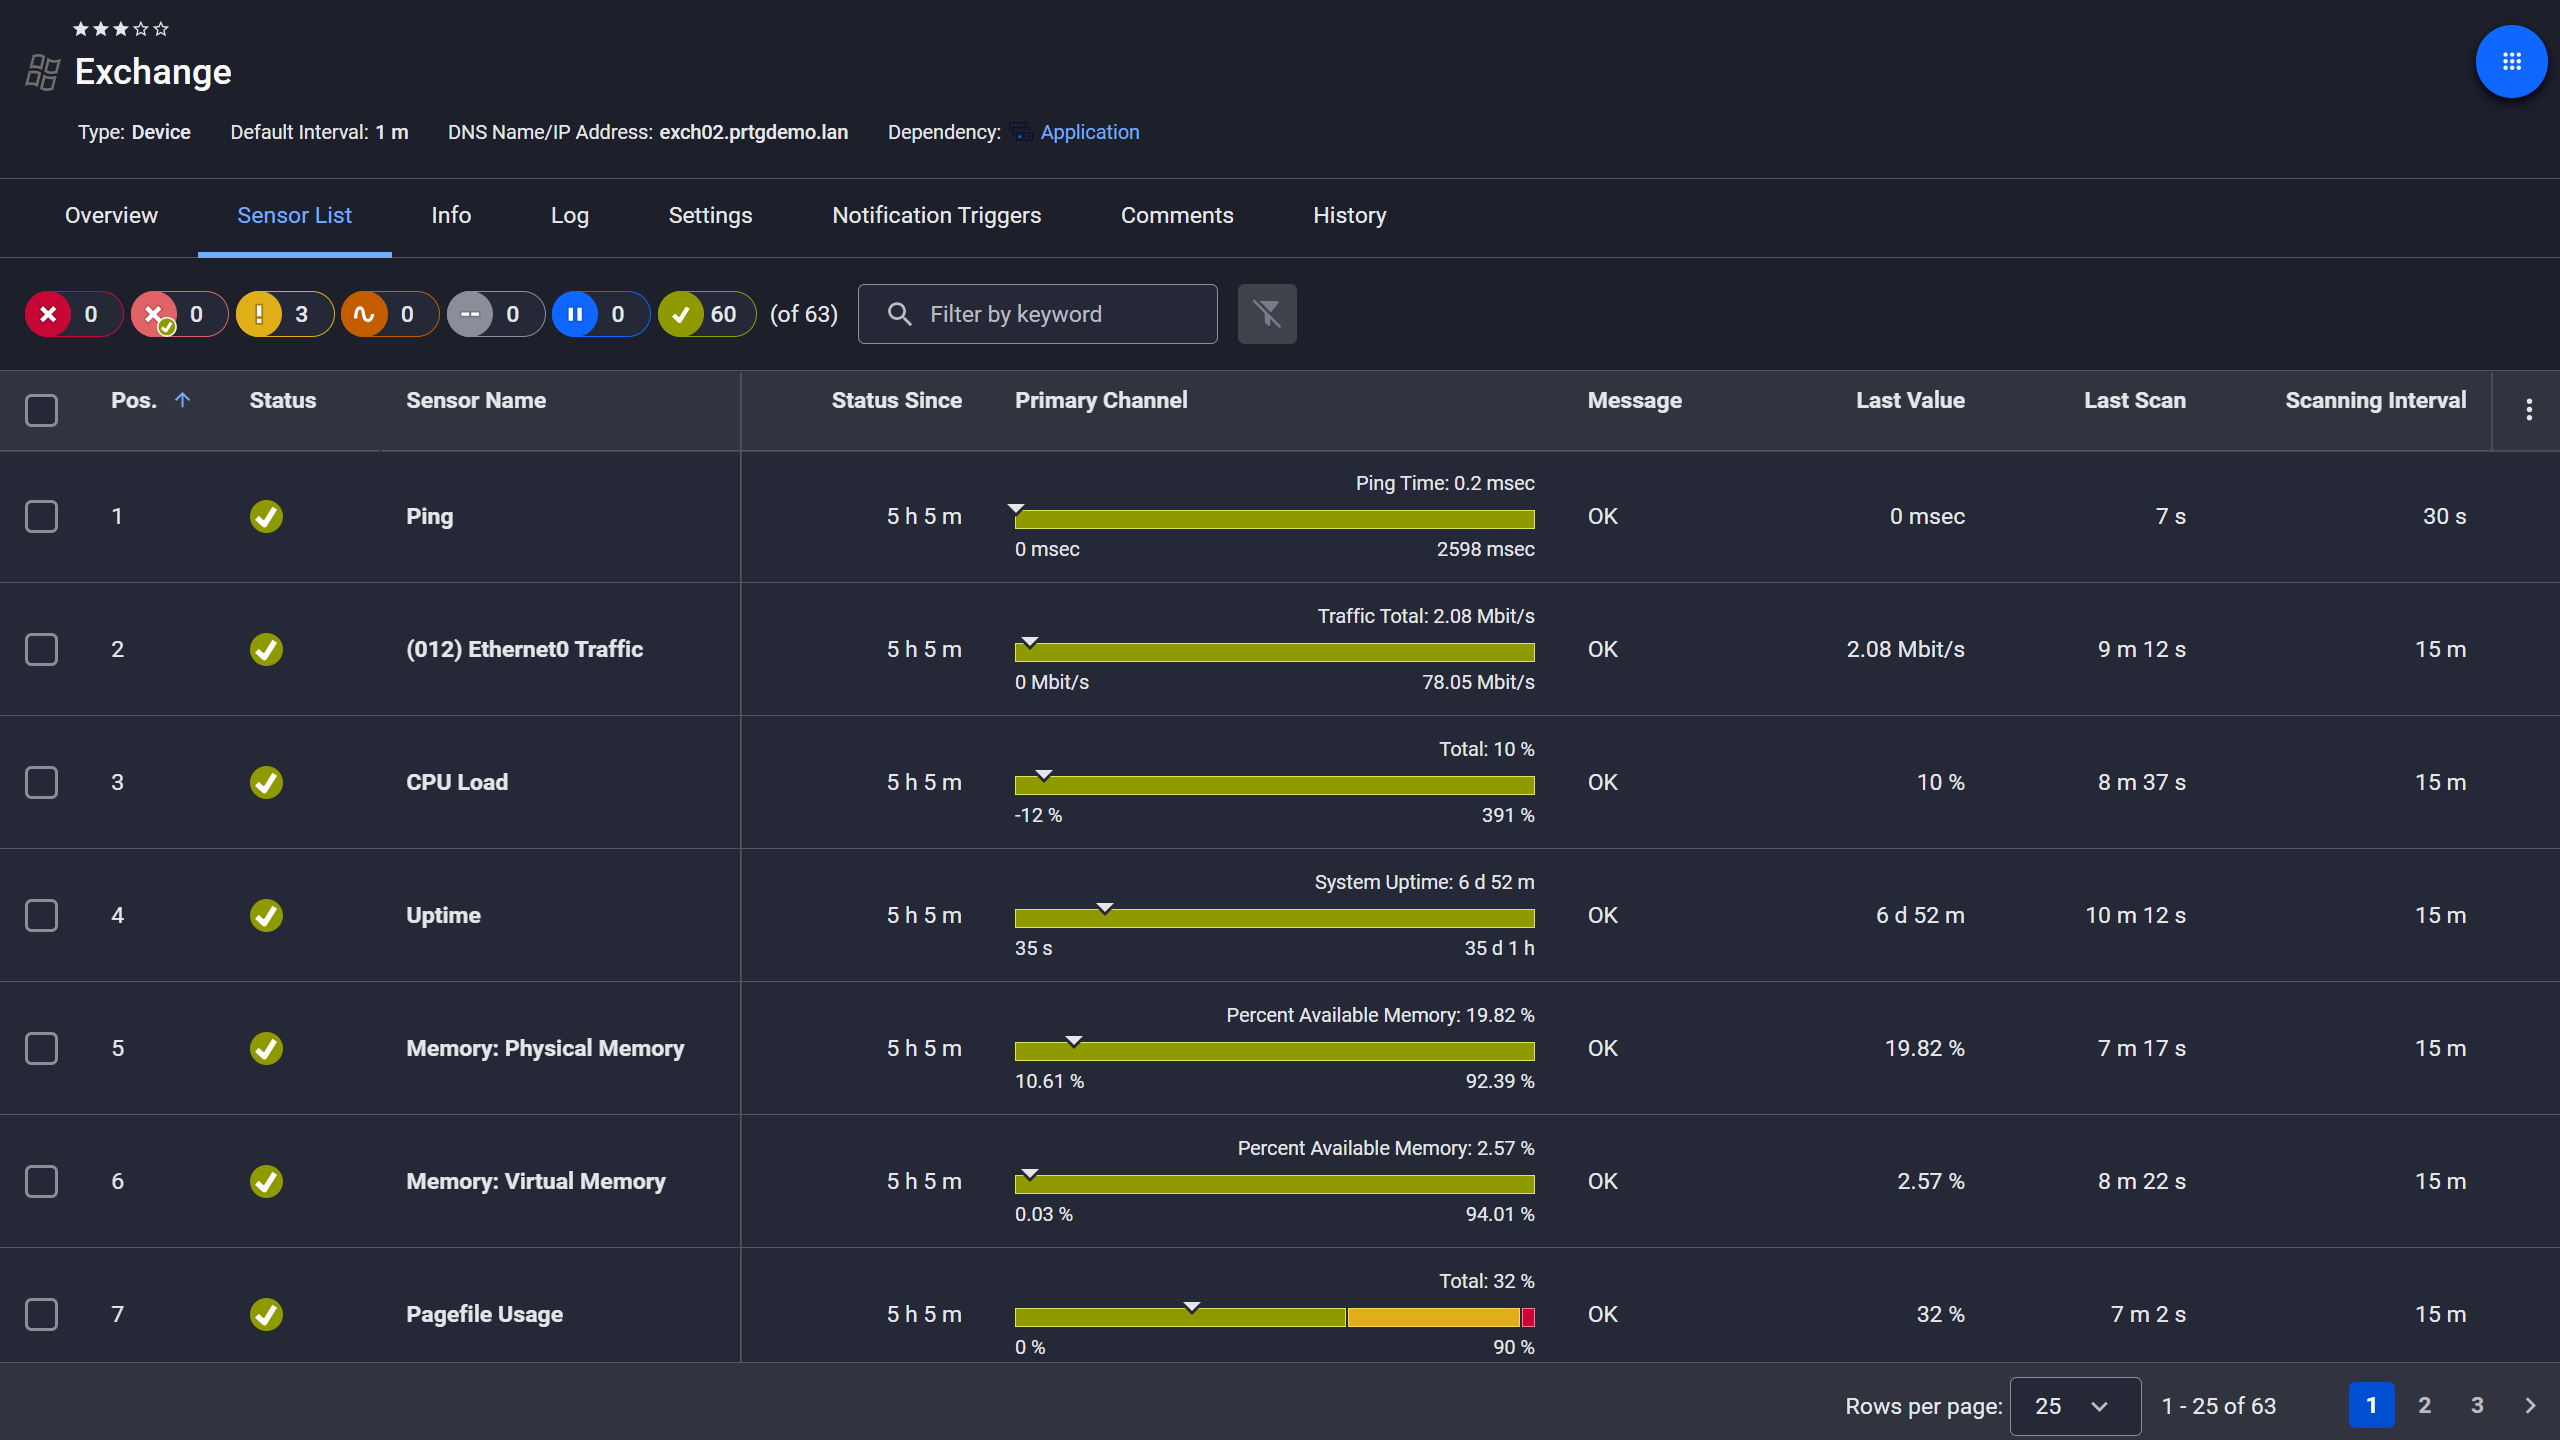
PRTG device view showing sensor list for a monitored Microsoft Exchange server

Exchange server, fully under control

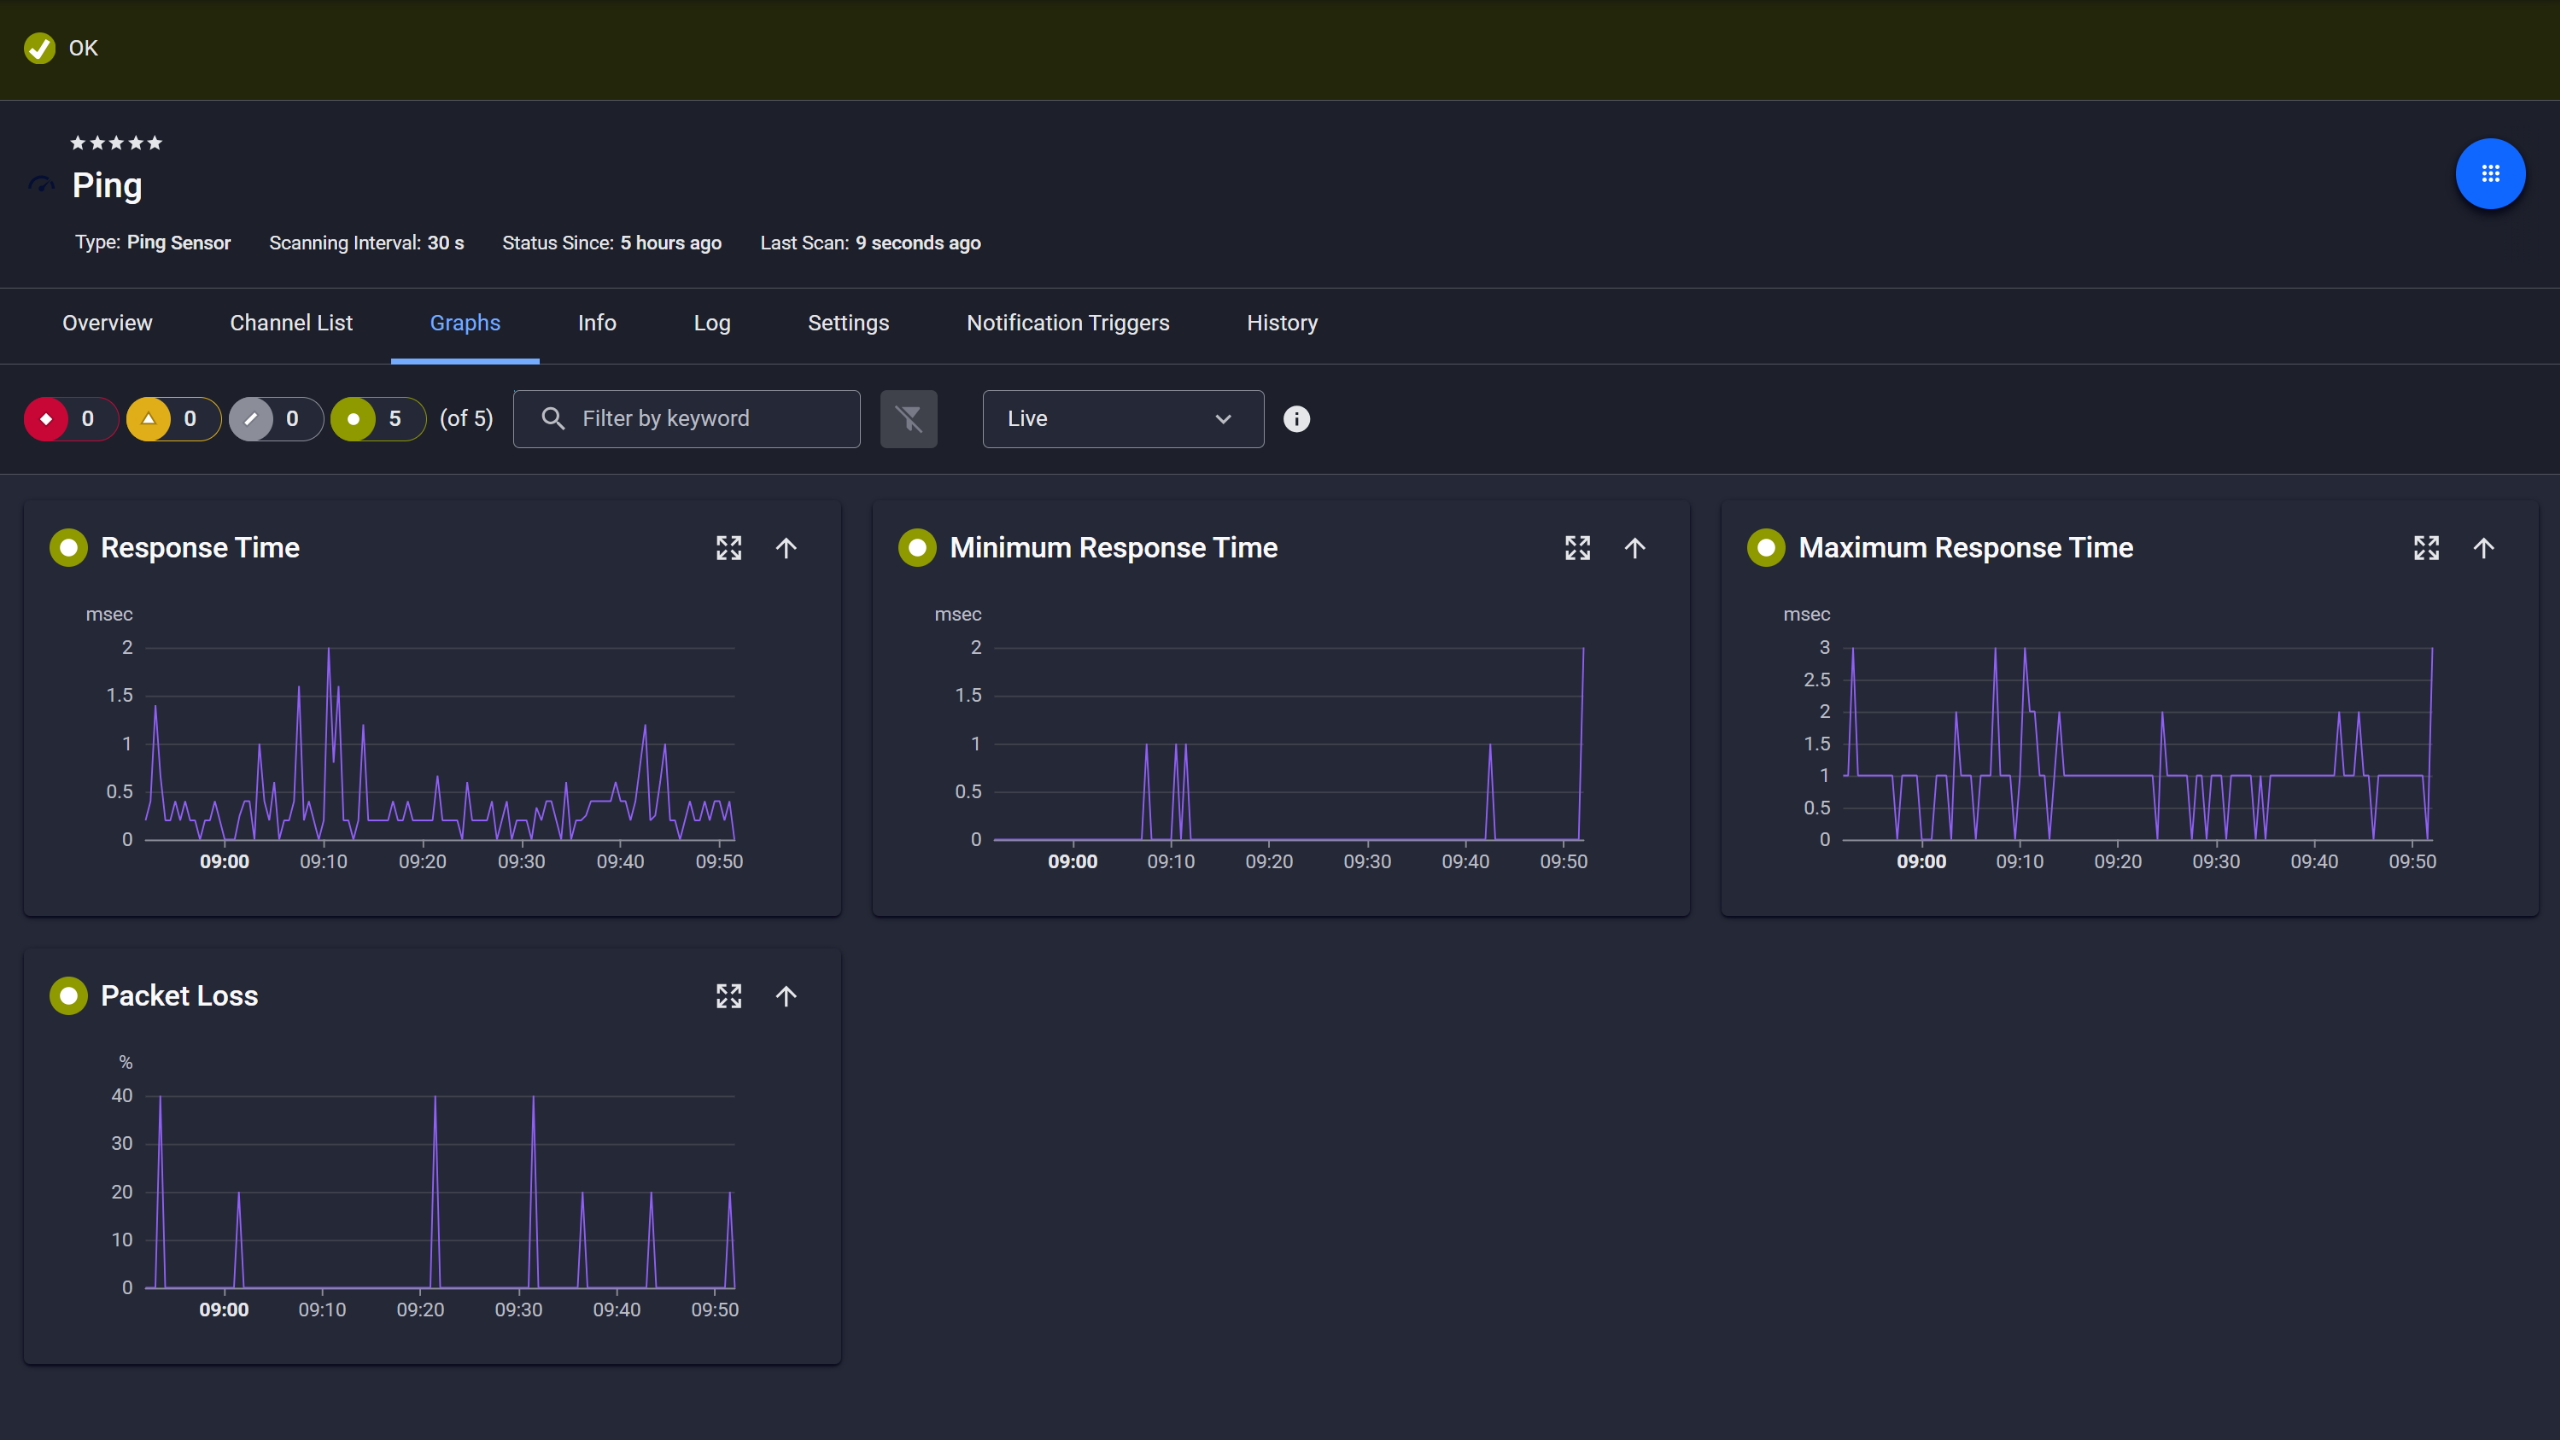
PRTG Ping sensor graphs showing response time, min, max, and packet loss over time

Ping response and packet loss

PRTG web interface showing live performance graphs for a Probe Health sensor

Live graphs, real-time performance data

Monitor Application Pool Performance and Resource Utilization

Application pools running out of memory or CPU don't crash immediately. They slow down first. Requests queue up. Users wait. By the time you realize there's a problem, you're already firefighting.

PRTG monitors IIS application pool health using Windows performance counters. You see worker processes, memory consumption, request queues, and CPU usage for every pool. Alerts fire when thresholds are exceeded, based on the limits you define.

  • Track memory and CPU usage for each application pool to identify resource bottlenecks early
  • Monitor active worker processes and request queues so you know when pools are under stress
  • Set thresholds that trigger warnings before performance degrades, based on your specific application requirements
  • Compare application pool health against server-level metrics to determine if the issue is IIS-specific or infrastructure-wide
  • Optimize resource allocation by reviewing which pools consume the most resources over time

See Why IT Professionals Trust PRTG

Start monitoring your infrastructure in minutes. No professional services, no complex configuration, no risk.

Free download
PRODUCT OVERVIEW

Keep Your Entire IIS Infrastructure Visible in One Place

Most environments run more than one IIS server. Multiple web servers, load balancers, firewalls, backend databases, and infrastructure spread across sites or cloud environments. Managing all of that with separate tools means switching dashboards, manually correlating data, and wasting time just trying to figure out what's happening.

PRTG's unified monitoring platform covers your entire IIS environment on one dashboard. Web server availability, application pool health, Event Log errors, network traffic, database connections, and infrastructure dependencies all in one view with consistent alerting and reporting. Whether you're a lean IT team managing everything yourself or a regional site that needs monitoring independence from corporate IT, PRTG gives you the visibility you need without vendor lock-in or complex integrations.
  • Monitor every layer of your web infrastructure from HTTP availability to backend database connections in one tool
  • See dependencies between servers, services, and applications to understand how failures propagate
  • Build custom dashboards showing exactly what you need with custom maps and dashboards tailored to your infrastructure
  • Configure intelligent dependencies so PRTG doesn't flood you with redundant alerts when a component fails and takes others with it
  • Scale from a few servers to hundreds without needing separate tools or complex integrations
PRTG reports list showing scheduled monitoring reports with run times and sensor counts

Scheduled reports, always on time

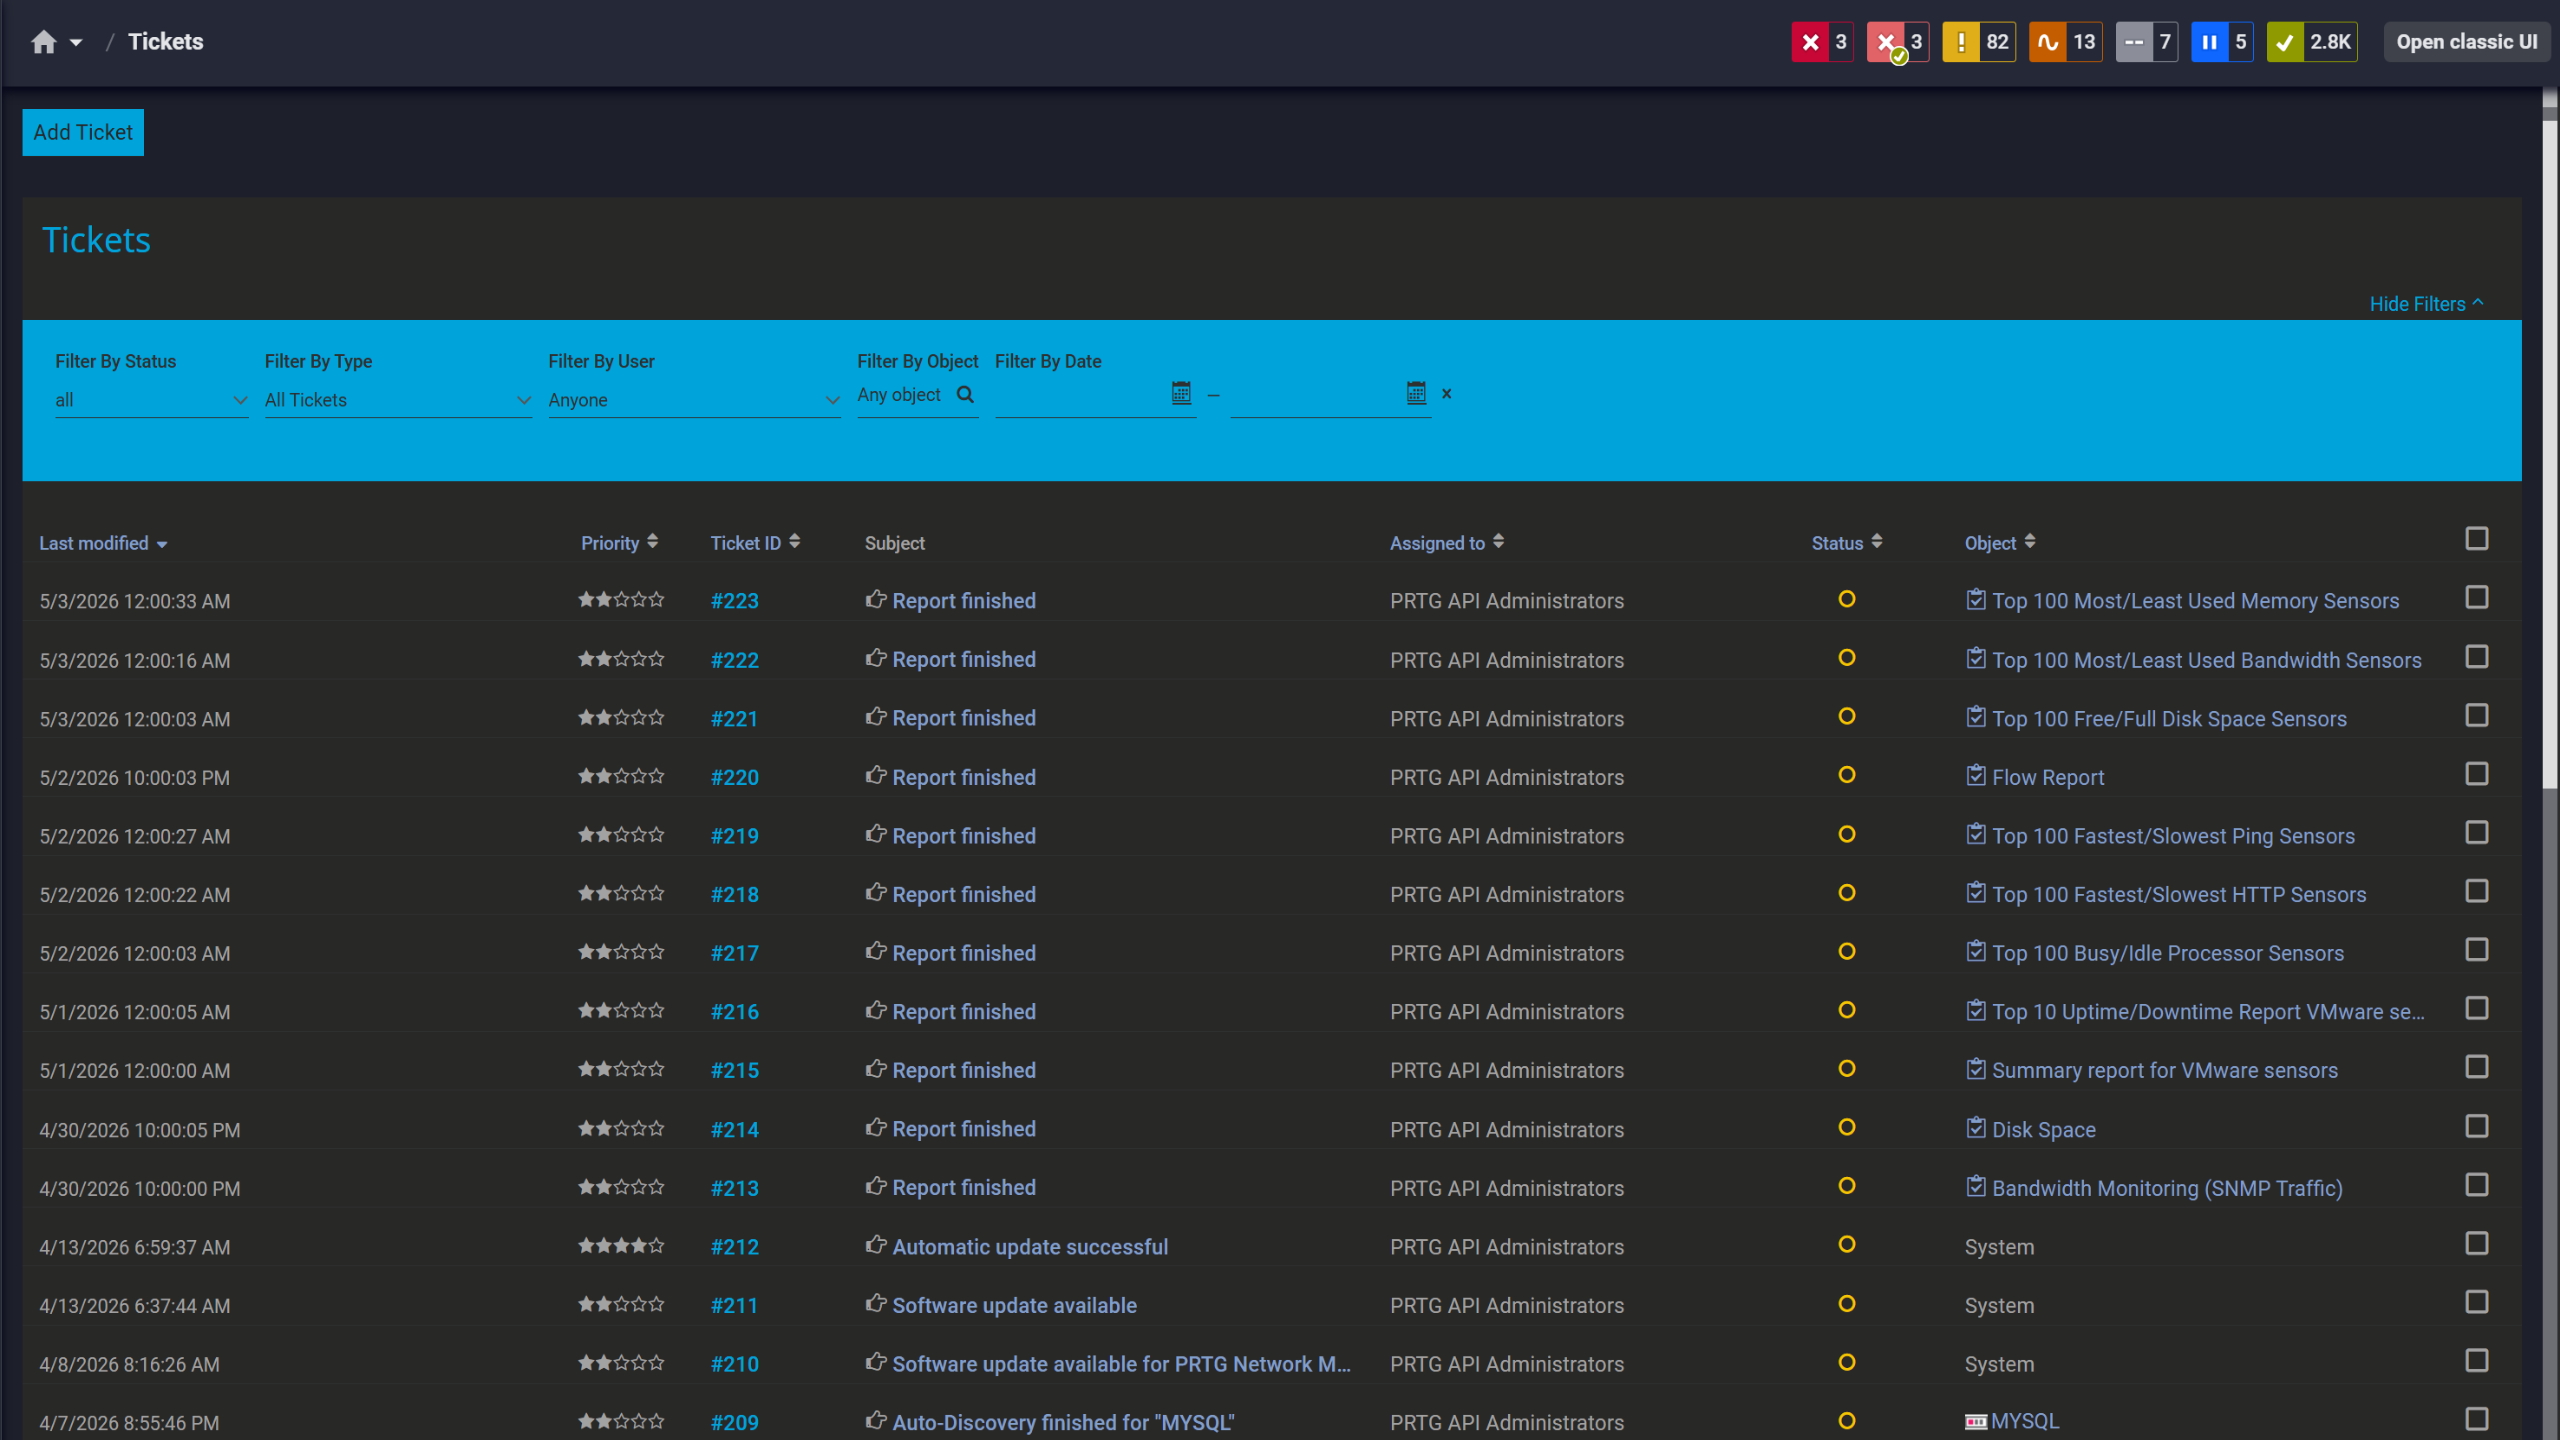
PRTG tickets list showing system notifications, report completions, and update alerts

Tickets keep your team aligned

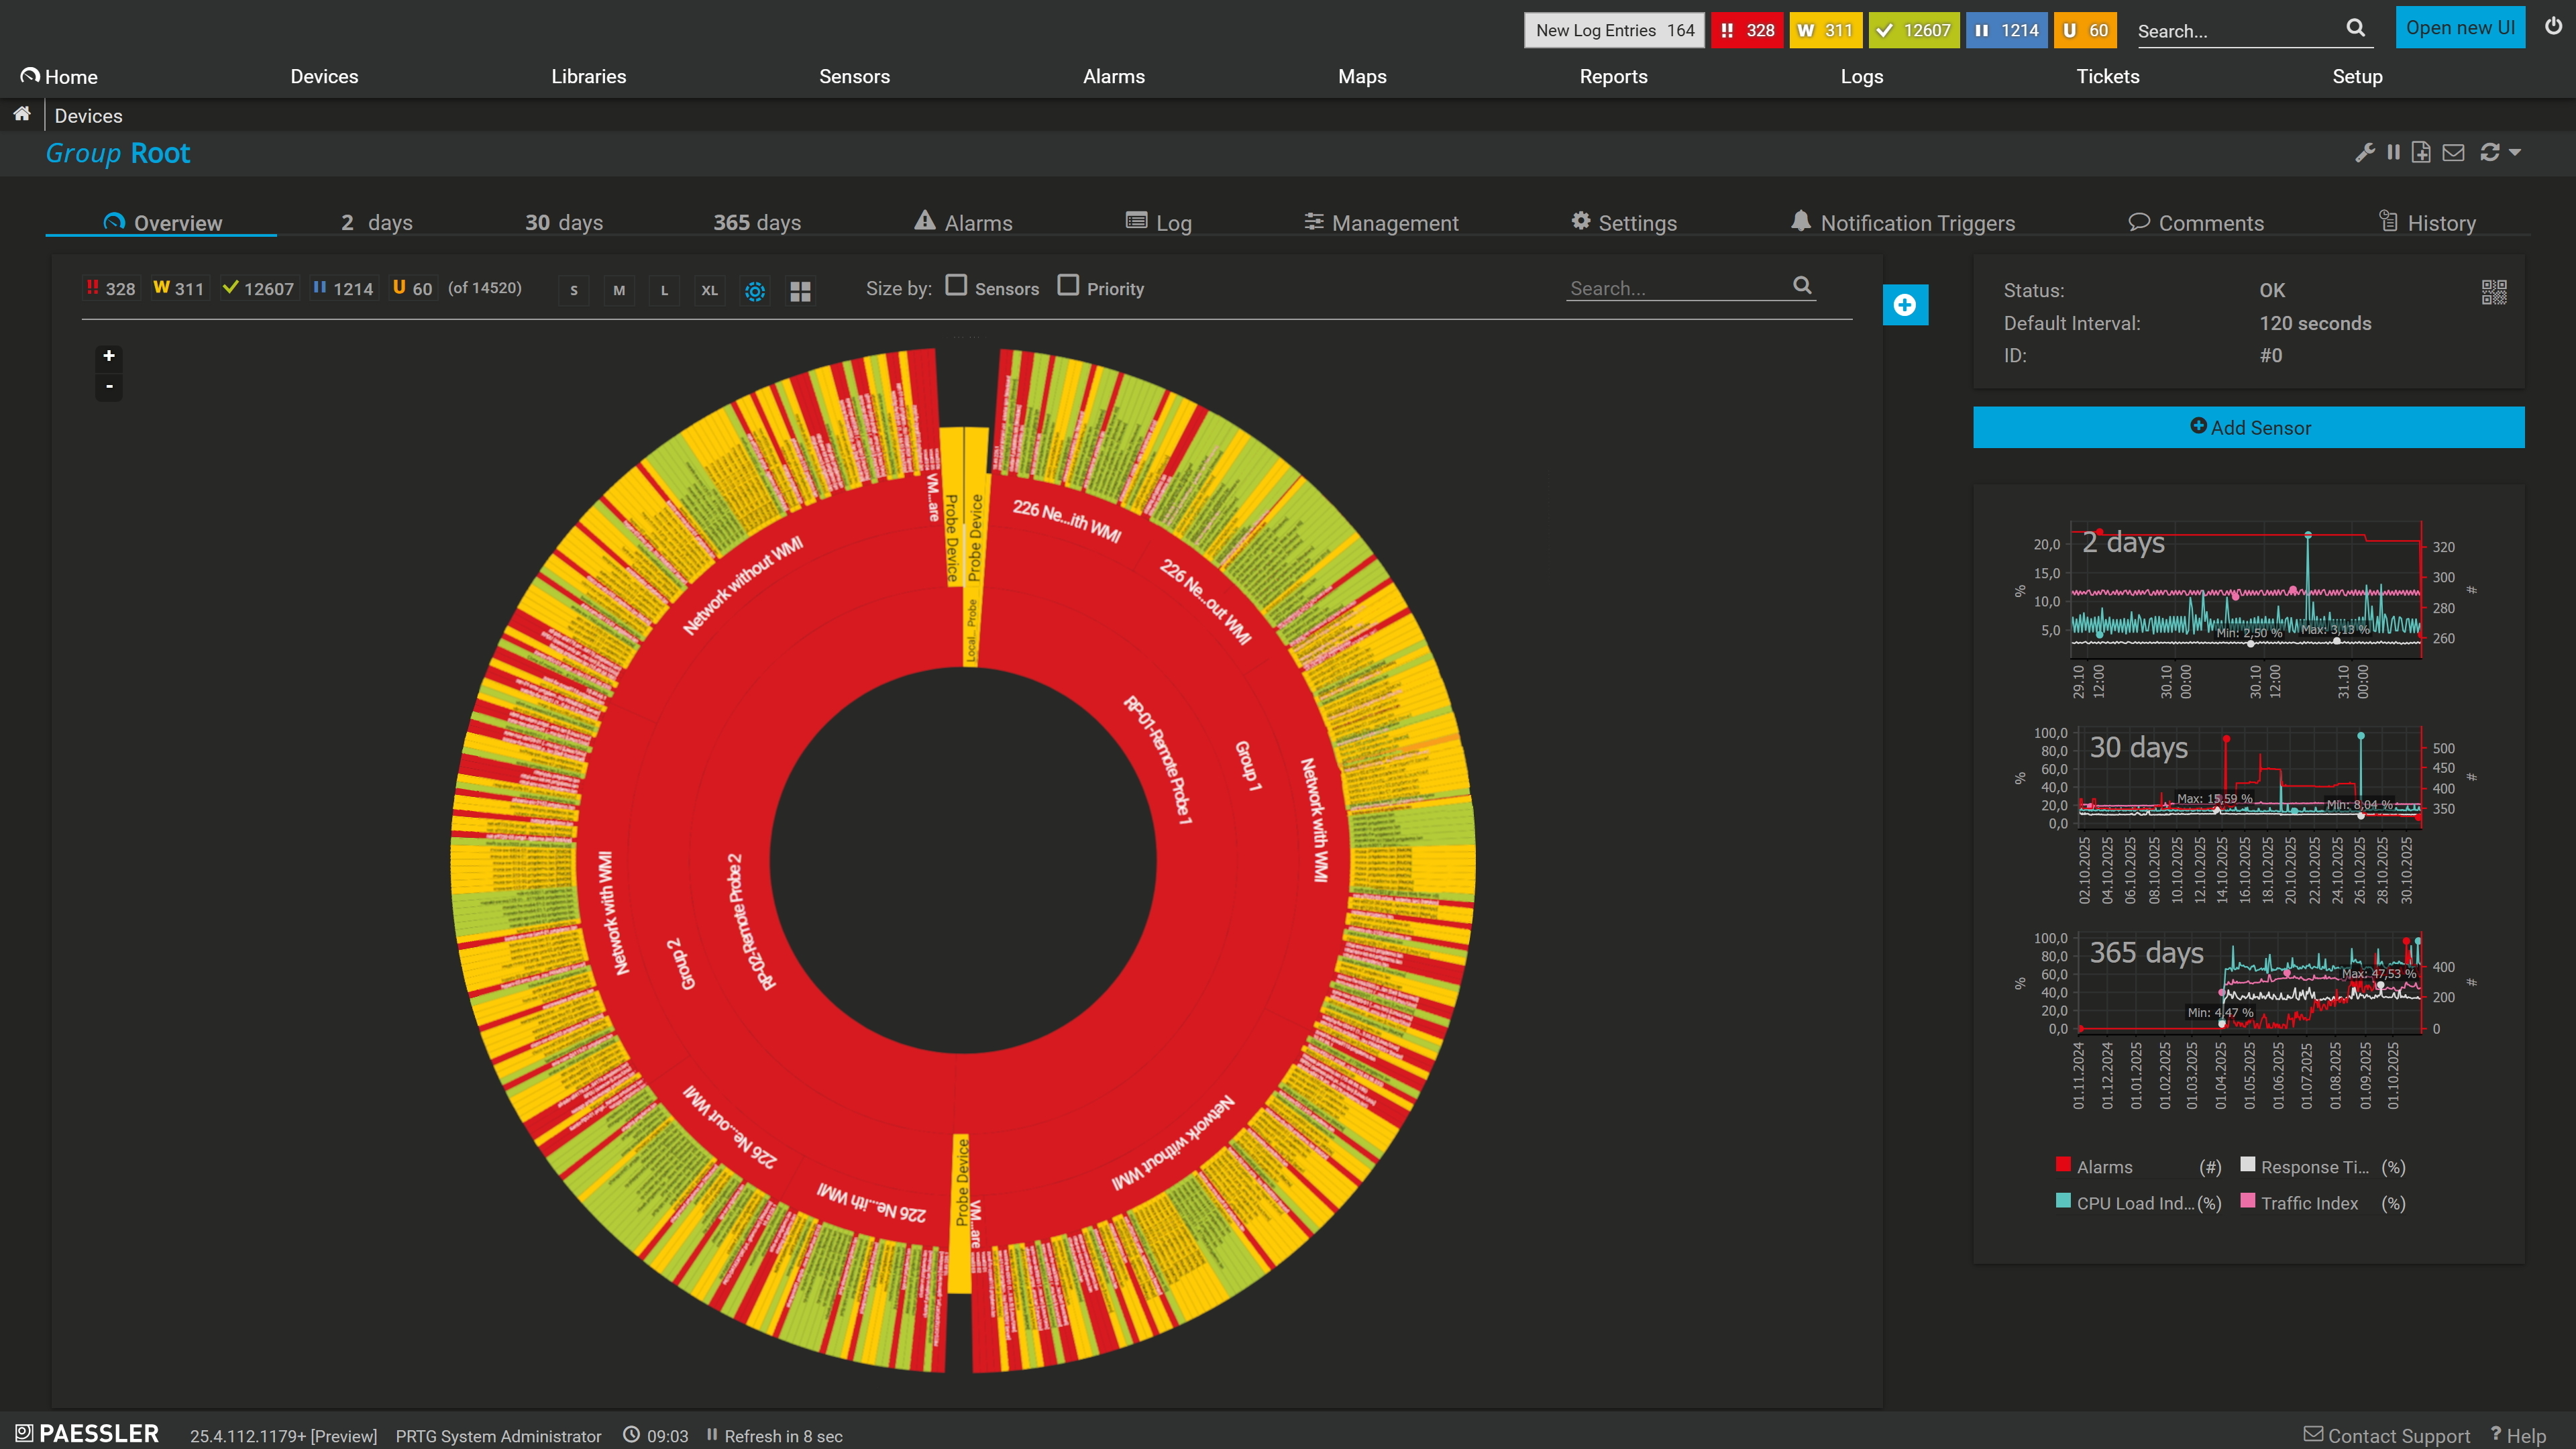
PRTG web interface showing device tree and full device list with sensor status badges

Full device list, instant overview

Start Monitoring in Minutes, Not Weeks

You don't have time for a three-month deployment or a professional services engagement just to start monitoring Microsoft IIS. You need visibility now. Minimal setup. No steep learning curve.

PRTG's auto-discovery finds your IIS web servers automatically and suggests the right sensors to monitor them. Pre-configured templates for HTTP monitoring, event log tracking, and performance counters work out of the box. You're monitoring production infrastructure in minutes.

  • Auto-discovery scans your network and finds IIS servers automatically without manual configuration
  • Pre-configured sensors for HTTP, Event Logs, and performance counters deploy with a few clicks
  • No coding, scripting, or complex queries required to get comprehensive IIS monitoring running
  • Start with basic monitoring and expand as needed without ripping out and reconfiguring everything from scratch
  • Deploy on-premises or in the cloud with straightforward pricing that doesn’t punish you for scaling

How PRTG Monitors Servers 

PRTG uses multiple sensor types to monitor IIS infrastructure from different angles. HTTP sensors test website availability and response time from the outside. Windows Event Log sensors track errors and warnings as they're written to application, system, and security logs. Performance counter sensors measure application pool resource usage, worker processes, and request queues in real time. Together, these sensors give you complete visibility into IIS web server health and performance.

HTTP Availability Checks 

PRTG's HTTP and HTTP v2 sensors test your websites and web applications by sending requests at regular intervals and measuring response time, status codes, and page content. You can verify that specific content appears on the page, check SSL certificate validity, and measure load time for critical web elements. If a site goes down, responds slowly, or returns the wrong content, you're notified immediately.

Event Log Monitoring

PRTG monitors application, system, and security event logs on your IIS servers using Windows Event Log sensors. Filter for specific event IDs, keywords, or severity levels to focus on errors and warnings while ignoring routine informational events. When IIS logs a critical error or authentication failure, PRTG captures the log entry and triggers an alert, giving you real-time visibility into what's happening without opening a log viewer on every server.

Application Pool Health

The PerfCounter IIS Application Pool sensor uses Windows performance counters to monitor resource usage and health for individual application pools. Track metrics like current connections, worker processes, CPU usage, memory consumption, and request queues. Set thresholds based on your application's normal behavior so you're notified when resource usage spikes or request queues start building up before users experience slowdowns.

Server Resource Tracking

Beyond IIS-specific metrics, PRTG monitors the underlying Windows servers using SNMP, WMI, or Windows performance counter sensors. Track CPU load, memory usage, disk I/O, and network traffic to understand whether performance issues stem from IIS configuration or infrastructure-level resource constraints. PRTG also monitors Linux systems and other operating systems in your environment, letting you correlate web server health with application pool performance and HTTP response times to quickly pinpoint root causes.

Alerting and Dependencies

PRTG's dependency system prevents alert fatigue by pausing child sensors when a parent component fails. If a server goes offline, you get one alert about the server instead of fifty alerts about every website and service running on it. Configure notifications via email, SMS, push notification, or integrate with ticketing systems and communication tools using webhooks or the PRTG API. Set escalation schedules so the right people are notified based on severity and time of day.

free downLoad

IIS Monitoring: Manual vs. PRTG

FEATURE

Without PRTG

Without PRTG

With PRTG

With PRTG

Website uptime checks

Without PRTG
not included

Manual browser tests or scripted pings

With PRTG
included

Automated HTTP sensors with continuous monitoring

Event log monitoring

Without PRTG
not included

Remote desktop to each server, open Event Viewer, search manually

With PRTG
included

Near real-time event log filtering with automatic alerts

Application pool health

Without PRTG
not included

Check Performance Monitor on each server individually

With PRTG
included

Unified dashboard showing all application pools across all servers

Response time tracking

Without PRTG
not included

Intermittent manual tests, no historical data

With PRTG
included

Continuous measurement with trend analysis and historical graphs

Alert when something fails

Without PRTG
not included

Hope someone notices before users complain

With PRTG
included

Instant notifications via email, SMS, or integration with your tools

free downLoad

We have found these sophisticated levels of monitoring to be highly effective, improving the end user’s experience of the systems and applications in use, giving us the opportunity to provide a proactive resolution rather than having the end user raise issues.

Saif Akil, Head of Service Management
Acurus

“Before PRTG, applications and hardware all gave messages, but all separately, so we had to search through hundreds of e-mails to find the problem. It was always only afterwards that we saw that something was going on within the infrastructure. To mitigate the issue, we also considered other software. PRTG stood out because of its user-friendliness, flexibility and minimal consultancy investment.”

Wim Vandenberghe, ICT Manager
Soenen Golfkarton

PRTG gives a birds-eye view of your network to troubleshoot problems or look at systems in their entirety that other solutions cannot – and I have looked at all of them.

Colin Metzler, Cybersecurity Analyst
Dayton Children’s Hospital

Paessler PRTG Network Monitor licenses & pricing

Choose the PRTG Network Monitor subscription that's best for you.

License NameLicense descriptionPriceLicense DetailsGet startedPricing Details
PRTG 500$200per month paid annuallyBuy nowBuy now

Enough to monitor multiple aspects of 50 devices

PRTG 1000$358per month paid annuallyBuy nowBuy now

Enough to monitor multiple aspects of 100 devices

PRTG 2500$742per month paid annuallyBuy nowBuy now

Enough to monitor multiple aspects of 250 devices

PRTG 5000$1,300per month paid annuallyBuy nowBuy now

Enough to monitor multiple aspects of 500 devices

PRTG 10000$1,642per month paid annuallyBuy nowBuy now

Enough to monitor multiple aspects of 1000 devices

Over 100,000 Customers Worldwide Love Paessler  

customer success stories

IIS Log Analyzer: Frequently Asked Questions


Can PRTG analyze IIS log files directly?

PRTG doesn't parse web server logs (like W3C log formats or CSV log files) line by line the way a dedicated IIS log analyzer tool would. Instead, it monitors IIS infrastructure through live availability checks (HTTP sensors), Windows Event Log monitoring, and performance counters. This approach gives you real-time visibility into server health, application pool performance, and errors as they happen, rather than analyzing IIS log data after the fact. For detailed forensic analysis of W3C log files—including user_agent strings, request patterns, and other IIS log data—you'd use a dedicated log analysis tool or log viewer alongside PRTG's real-time infrastructure monitoring.

What's the difference between HTTP and HTTP v2 sensors in PRTG?

Both sensors monitor website availability and response time, but the HTTP v2 sensor offers more advanced configuration options like custom headers, authentication methods, and detailed content verification. For basic uptime monitoring, the standard HTTP sensor works fine. For more complex scenarios like testing authenticated pages or APIs, the HTTP v2 sensor gives you finer control.

Can PRTG monitor IIS servers in the cloud or on AWS/Azure?

Yes. PRTG monitors Microsoft IIS servers regardless of where they're hosted. For cloud-hosted IIS instances, you can deploy PRTG on-premises and monitor cloud servers remotely or deploy a PRTG Remote Probe in your cloud environment for local monitoring with centralized reporting. HTTP availability checks work from anywhere, and Windows-based sensors (Event Logs, performance counters) require network access to the target servers.

How does PRTG handle monitoring multiple IIS servers across different sites?

PRTG uses a distributed monitoring architecture with Remote Probes. Deploy a probe at each remote site to monitor local IIS web servers, then view all data centrally on your main PRTG server. This approach reduces WAN traffic, ensures monitoring continues even if connectivity to the central server is lost, and gives you a unified view of IIS infrastructure across all locations.

Does monitoring IIS with PRTG require agents on every server?

For most IIS monitoring, no. HTTP sensors don't require any agent because they test from the outside like a user would. Windows Event Log and performance counter sensors use agentless protocols like WMI (Windows Management Instrumentation), so you don't need to install anything on the target servers. Just make sure the PRTG server or probe has the necessary permissions and network access.

Paessler PRTG

Paessler PRTG

Network Monitoring Software – Version 26.1.116.1532 (February 9th, 2026)

Hosting icon

Hosting

Download for Windows and cloud-based version PRTG Hosted Monitor available

Languages icon

Languages

English, German, Spanish, French, Portuguese, Dutch, Russian, Japanese, and Simplified Chinese

test

Monitor everything

Network devices, bandwidth, servers, applications, virtual environments, remote systems, IoT, and more

test

Pricing

Choose the PRTG Network Monitor subscription that's best for you

Discover more monitoring insights and stories

Content illustration

Powerful stories from the monitoring world

  • IIS performance monitoring - What you need to know - Paessler Blog
  • Monitor Applications and Services with PRTG: Complete Guide
  • Monitor bandwidth consumption in a PRTG Enterprise Monitor ...
Support illustration

Resources to master your monitoring challenges

  • How can I propose new features or sensors for PRTG?
  • How can I move or migrate a PRTG installation to a different system or server?
  • Quick Start Guide
Solution illustration

Solutions for all your monitoring needs

  • IIS Log Analyzer
  • Monitoring Applications
  • IIS Monitoring
PRTG Logo

Start Monitoring with PRTG and see how it can make your network more reliable and your job easier.

Free download
PRODUCT OVERVIEW

Products

  • Paessler PRTG
    Paessler PRTGMonitor your whole IT infrastructure
    • PRTG Network Monitor
    • PRTG Enterprise Monitor
    • PRTG Hosted Monitor
    • PRTG UVexplorer
    • PRTG extensions
      Extensions for Paessler PRTGExtend your monitoring to a new level
  • Icon Features
    FeaturesExplore all monitoring features

Monitoring with PRTG

  • Network monitoring
  • Bandwidth monitoring
  • SNMP monitoring
  • Network mapping
  • Wi-Fi monitoring
  • Server monitoring
  • Network traffic analyzer
  • NetFlow monitoring
  • Syslog server

Useful Links

  • PRTG Manual
  • Knowledge Base
  • Customer Success Stories
  • About Paessler
  • Subscribe to newsletter
  • PRTG Support
  • PRTG Consulting
  • PRTG Feedback & Roadmap

Contact

Paessler GmbH
Thurn-und-Taxis-Str. 14, 
90411 Nuremberg 
Germany

[email protected]

+49 911 93775-0

  • Contact us
©2026 Paessler GmbHTerms & ConditionsPrivacy PolicyImprintReport VulnerabilityDownload & InstallSitemap
Ping Ping Ping