- English
- Deutsch
- Español
- Français
- Italiano
- Português
Windows performance counters are built into the Microsoft operating system and expose a wide range of metrics. From CPU usage and disk read rates to application-specific data from SQL Server, IIS, and the .NET CLR. Every Windows machine already has this data; the question is how you collect it and turn it into action.
Paessler PRTG polls performance counter data continuously across local and remote Windows machines, stores it historically, and visualizes it in continuous (near real-time) graphs and dashboards. It reads both native operating system-level counters and counters registered by third-party applications, making it practical for mixed Windows operating system environments of any size.
PRTG monitors performance counters for: Windows Server 2008 R2 and later, IIS, SQL Server, .NET CLR, Windows Services, Azure-hosted Windows VMs, and any third-party application that registers counters with the Windows performance counter subsystem.

Perfmon works great for checking one machine when you already know where to look. Centralized monitoring scales that to your entire fleet, collecting data continuously whether someone is watching or not.
PRTG continuously polls your Windows servers and collects data centrally, then sends notifications when a counter value crosses defined thresholds. That way, you’re not dependent on someone watching dashboards.
Server performance tells a story over time. Patterns like memory trending upward or disk latency increasing under load become visible when you have historical data. With that context, you understand what changed over time rather than only seeing the current state.
PRTG retains counter metrics historically and shows them in time-series graphs per sensor. That means you can review hours, days, or months of data to support troubleshooting, spot gradual bottlenecks, and make capacity decisions with observed usage, not guesswork.
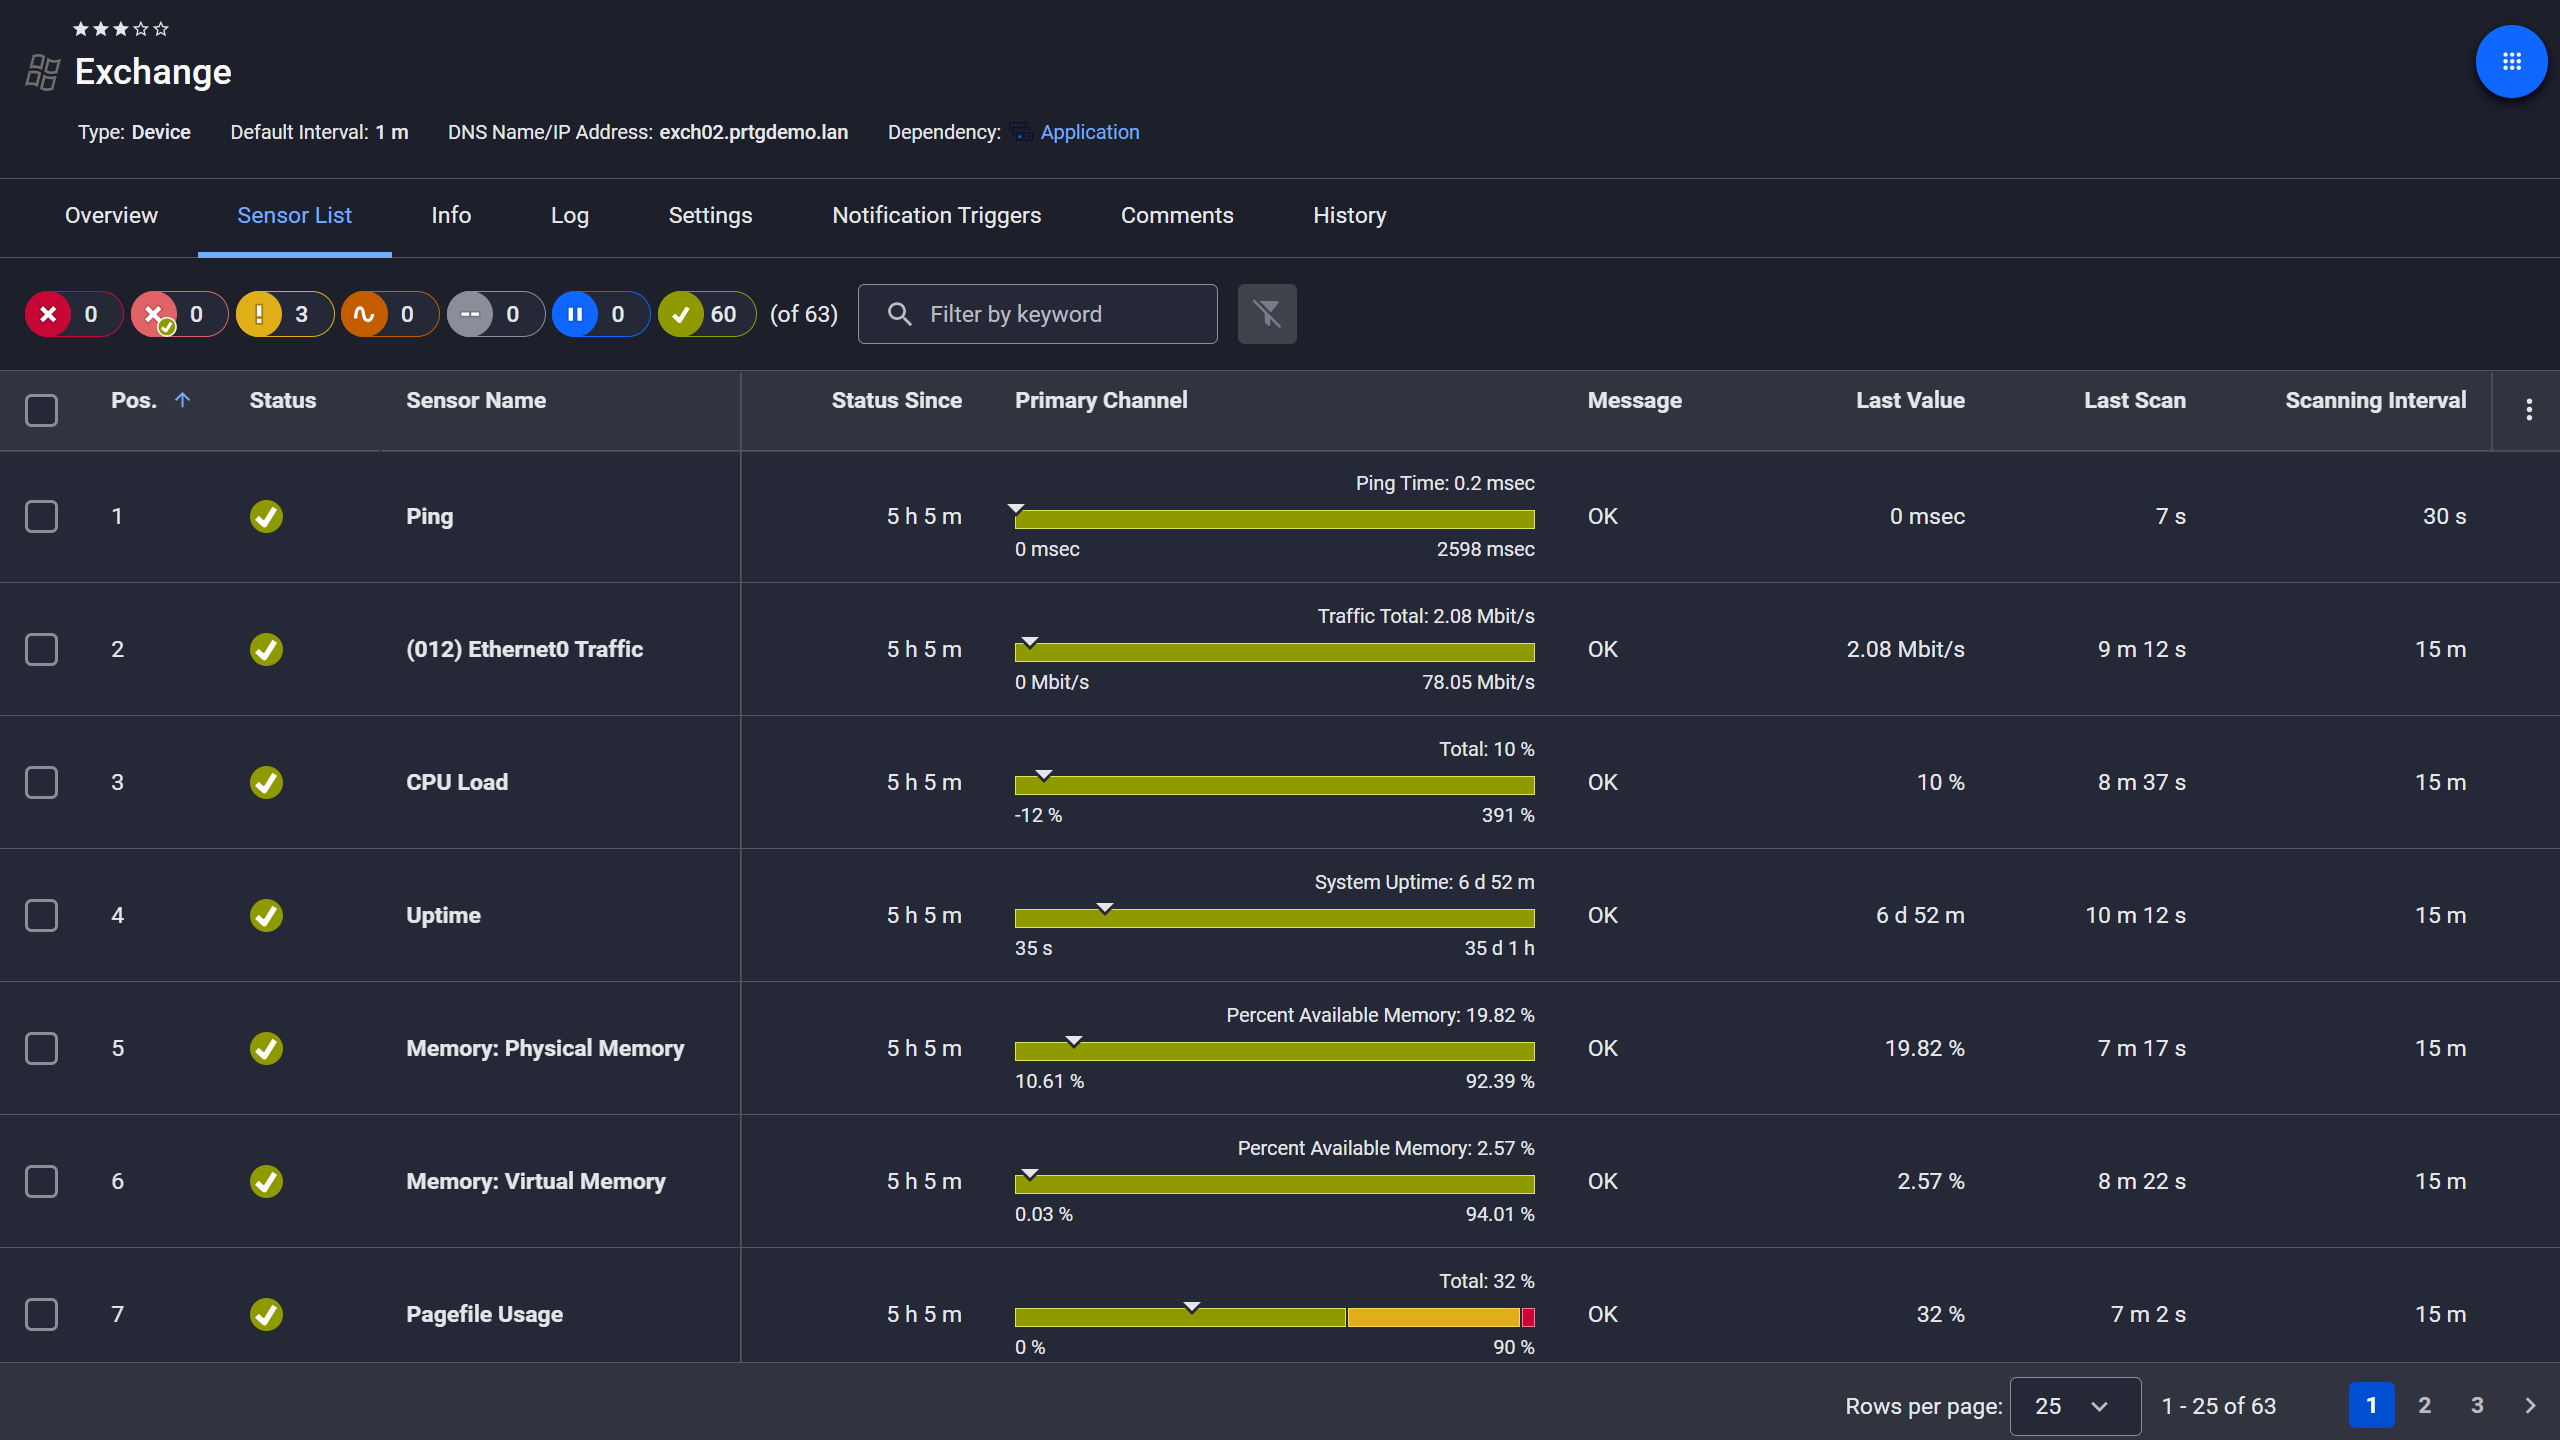
Exchange server, fully under control

Live graphs, real-time performance data
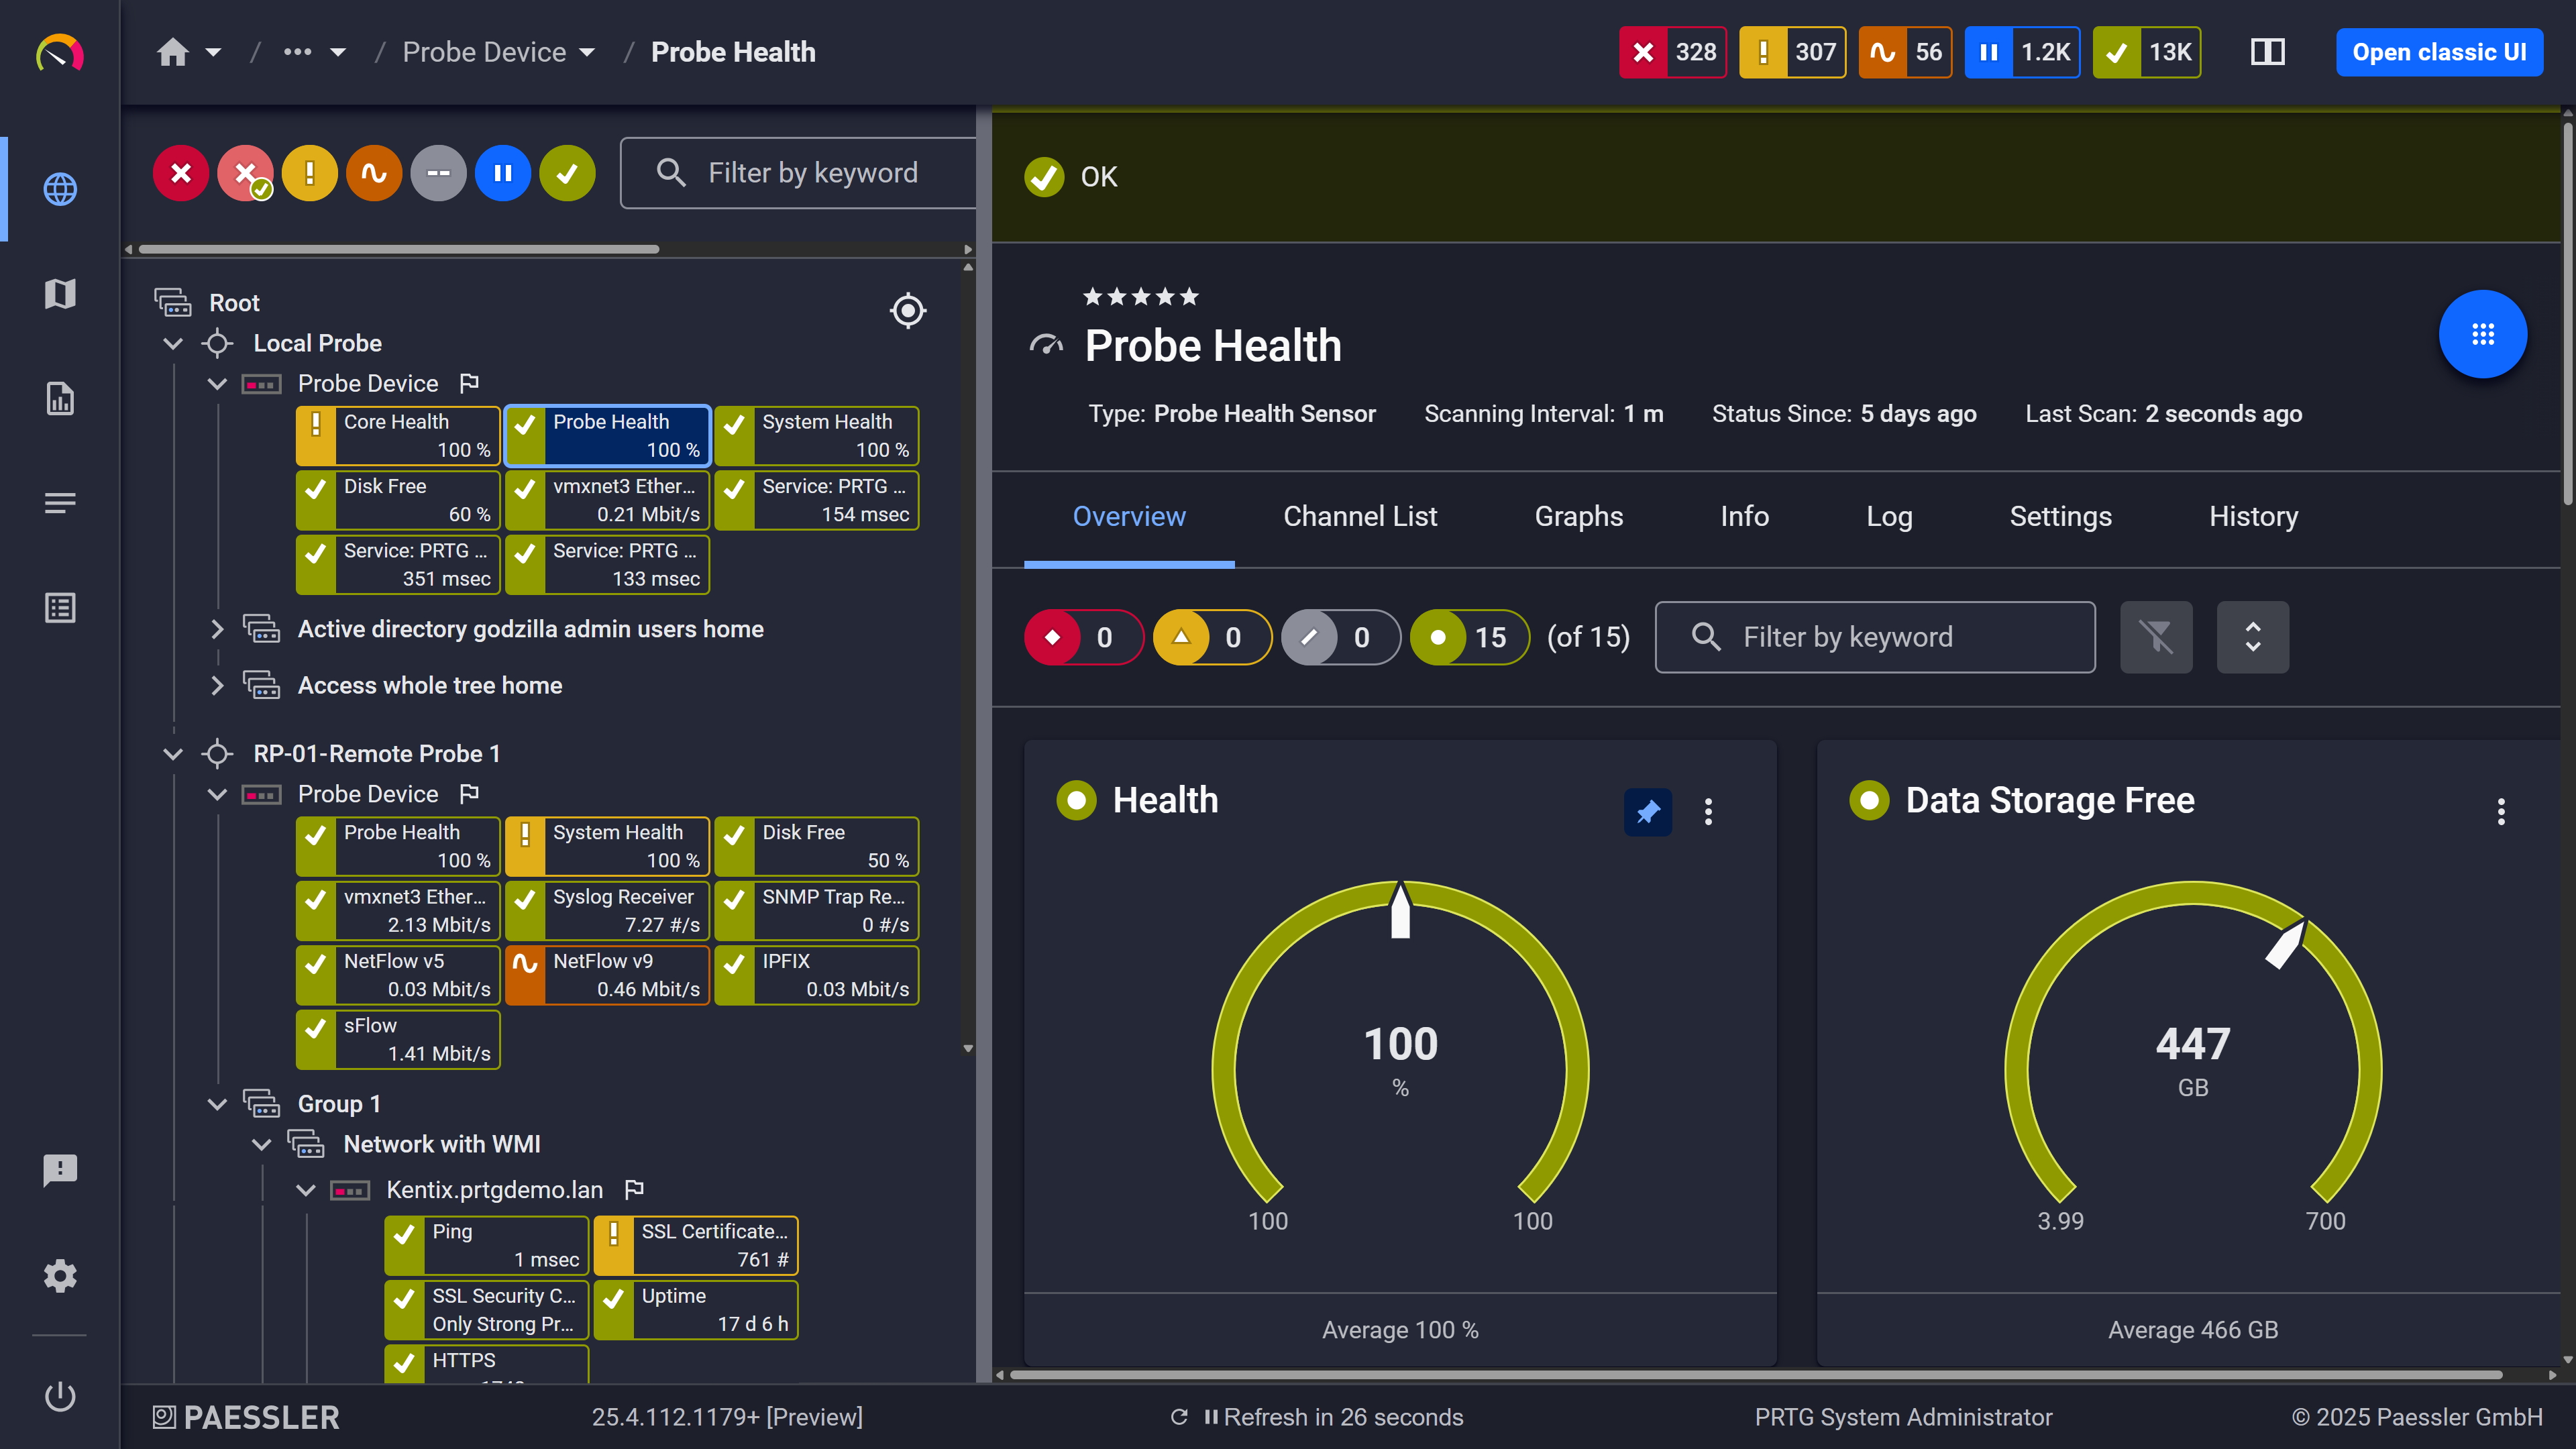
Probe health at a glance
CPU and memory tell you the operating system is under load, but not which application is driving the behavior. On Windows, SQL Server, IIS, and the .NET CLR expose their own performance counter objects.
PRTG can read performance counters registered on the Windows system, so SQL Server, IIS, and .NET CLR counters can be monitored alongside OS counters.
Start monitoring your infrastructure in minutes. No professional services, no complex configuration, no risk.
By default, PRTG uses WMI to collect Windows performance data, which is the same underlying access method used across most Windows sensors. For environments running large numbers of Windows sensors, PRTG supports a hybrid mode that tries performance counters first and falls back to WMI only when needed. This reduces WMI overhead and helps keep probe performance stable as your sensor count grows.
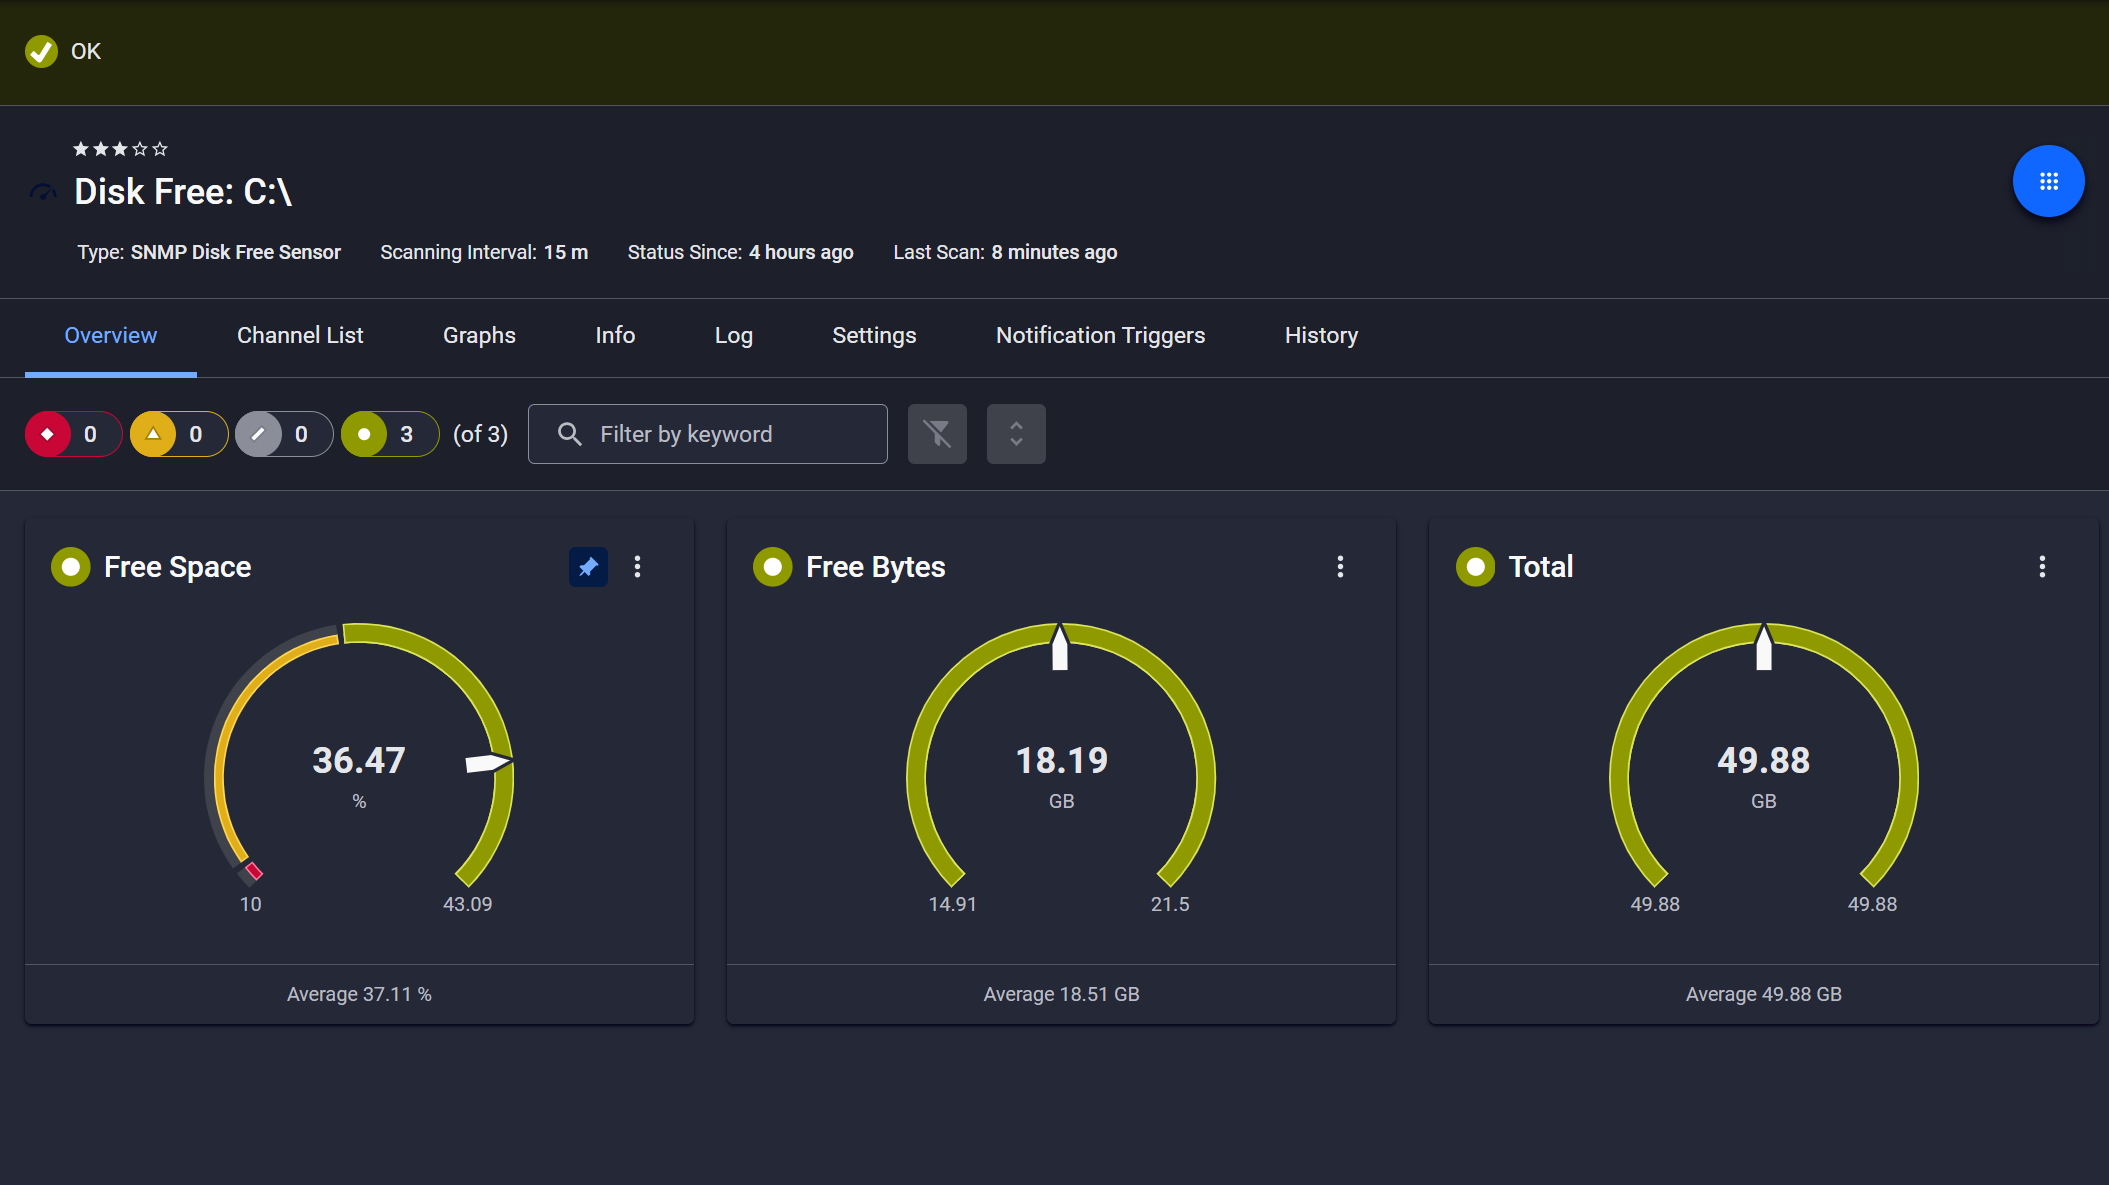
Disk space monitored, alerts ready

Scheduled reports, always on time

Full device list, instant overview
A standard Windows Server can expose hundreds of counter objects. PRTG's preconfigured sensors cover the ones that matter most, so your team can focus their experience where it counts.
PRTG’s Windows sensors cover critical OS counters, including disk usage, so you can start quickly. Auto-discovery can identify Windows devices and create relevant sensors automatically, and device templates reduce setup effort when adding new machines. When you need counters beyond the prebuilt set, PerfCounter Custom lets you add any registered counter.
You have multiple different possibilities to monitor your environment with PRTG. This section covers the technical side of how Windows performance counter data is collected: collection methods, sensor types, and configuration concepts.
FEATURE | Without PRTG Without PRTG | With PRTG With PRTG |
|---|---|---|
Multi-server monitoring | Without PRTG Manual, one machine at a time in perfmon | With PRTG Centralized — all Windows devices in one view, polled continuously |
Historical data retention | Without PRTG Not retained by default; manual export required | With PRTG Stored automatically, viewable per sensor at any time |
Threshold-based alerting | Without PRTG No alerting in perfmon | With PRTG Configurable per channel, with multiple notification methods |
Application counter coverage | Without PRTG Requires manual counter selection per machine in perfmon | With PRTG Any registered counter accessible via PerfCounter Custom |
Data collection method | Without PRTG WMI or manual perfmon access: neither scales across multiple machines or retains data automatically | With PRTG WMI by default; optional hybrid mode (performance counters first, WMI fallback) configurable via Windows Compatibility Options to reduce overhead at scale |
Choose the PRTG Network Monitor subscription that's best for you.
| License Name | License description | Price | License Details | Get started | Pricing Details | |
|---|---|---|---|---|---|---|
| PRTG 500 | $200 | per month paid annually | Buy nowBuy now | Enough to monitor multiple aspects of 50 devices | ||
| PRTG 1000 | $358 | per month paid annually | Buy nowBuy now | Enough to monitor multiple aspects of 100 devices | ||
| PRTG 2500 | $742 | per month paid annually | Buy nowBuy now | Enough to monitor multiple aspects of 250 devices | ||
| PRTG 5000 | $1,300 | per month paid annually | Buy nowBuy now | Enough to monitor multiple aspects of 500 devices | ||
| PRTG 10000 | $1,642 | per month paid annually | Buy nowBuy now | Enough to monitor multiple aspects of 1000 devices |

Windows performance counters are a Windows performance data source, the same one perfmon uses. WMI is a broader management framework covering system inventory and configuration, plus performance data. For routine performance monitoring, performance counters are typically the more efficient and stable choice.
By default, PRTG uses WMI to collect Windows performance data. For environments with high sensor counts, PRTG supports an optional hybrid mode, configured via Windows Compatibility Options, that tries performance counters first and falls back to WMI when needed. This reduces WMI overhead without sacrificing coverage.
For general health, typical starting points include:
Beyond that, role-based counters matter (SQL Server and IIS differ). PRTG’s preconfigured sensors cover core OS counters, and PerfCounter Custom lets you define application-specific counters.
Yes. PRTG collects counter data remotely using configured credentials, without requiring an agent on the monitored machine. Some sensors may require additional Windows access or services depending on the collection method.
Yes. SQL Server and IIS expose counters through the Windows performance counter subsystem. With PerfCounter Custom, you can monitor specific SQL Server counters. For IIS, the PerfCounter IIS Application Pool sensor provides predefined channel monitoring for application pool health and related counters.
It works when the Azure VM is reachable from a PRTG probe over the network. PRTG still needs network access to query the Windows system, like any other monitored server.
The PerfCounter Custom sensor monitors a configured set of Windows performance counters. In PRTG, you add the sensor to a Windows device and configure the counter object, instance, and counter name. Each configured counter becomes a channel with its own thresholds and graphs. You can include multiple channels within one sensor.
Network Monitoring Software – Version 26.1.116.1532 (February 9th, 2026)
Download for Windows and cloud-based version PRTG Hosted Monitor available
English, German, Spanish, French, Portuguese, Dutch, Russian, Japanese, and Simplified Chinese
Network devices, bandwidth, servers, applications, virtual environments, remote systems, IoT, and more
Choose the PRTG Network Monitor subscription that's best for you


