Paessler PRTG

VPN monitoring with PRTG for secure data traffic

  • Monitor VPN connections and your entire local network
  • Measure traffic, load, the number of users & more
  • Identify connection problems and suspicious traffic
  • Increase network security and stability
 

Our users give top ratings for monitoring with Paessler PRTG


PRTG makes VPN server & network monitoring easy

Custom alerts and data visualization make it easy to monitor, identify, and prevent VPN connection and security issues.


5 reasons to choose PRTG as your VPN monitoring tool

Secure company network access

Meet the requirements for network security and connection stability with the encrypted transportation of sensitive company data. Unusual or even suspicious traffic will immediately raise a red flag. With Paessler PRTG, your VPN networks will boast an optimal system status, as well as application security and secure connectivity


Intelligent alarms and notifications

Customize PRTG alarms with your own threshold values to record connection problems and irregularities in the network. It’s easy to counter attacks since you’ll be informed immediately by SMS, email, push notification, and more in the event of errors, numerous failed connection attempts, VPN problems, suspicious traffic, or overloads.


Proactive troubleshooting

Get to the root of any problem with continuous monitoring that minimizes the risk of security loopholes. PRTG helps you do proactive troubleshooting that reduces blocks in the flow of data traffic between VPN partners and the company network. This way, you will always have peace of mind, both in and out of the office.

Central dashboard overview

The PRTG dashboard offers easy-to-read details on all parameters of your VPN connections in real time. PRTG gathers information regarding the VPN connection, such as who used a VPN to connect (or is presently connected) to the company network and at what time, the type of connection, and the volume of data that is transferred over a certain period.


Efficient long-term planning

PRTG’s quick and comprehensive overview of your virtual private network provides you with valuable insight on traffic, connections, and users. All this information will help you create transparency of utilized resources, which means you get decision-making support for service management and upgrades for your IT equipment.


Data gathered by PRTG during VPN monitoring

  • icon check blue 2

    Incoming
    and outgoing traffic

  • icon check blue 2

    The type and speed
    of data packets

  • icon check blue 2

    Connected users
    and duration of
    use
  • icon check blue 2

    Connection
    errors

  • icon check blue 2

    Connection types and active connections (Email, IPsec, L2L, LB, SVC)
 

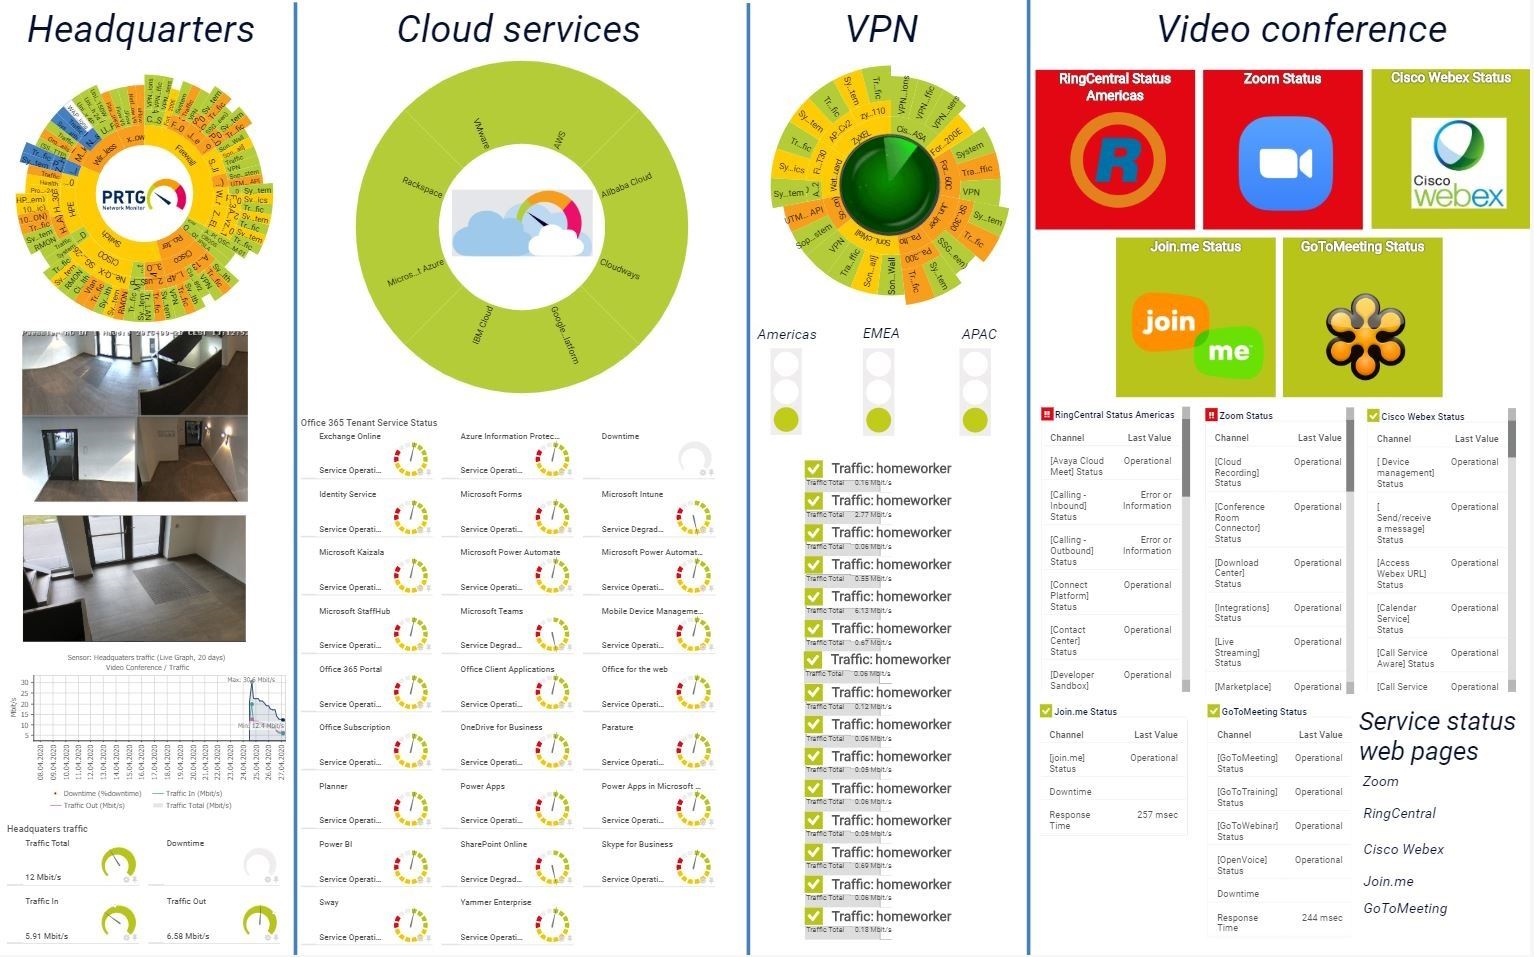
What VPN monitoring looks like in PRTG

Diagnose network issues by continuously monitoring your virtual private network. Show incoming and outgoing traffic, data packet speed, packet loss, and other key performance stats in real time and visualize data in graphic maps & dashboards to identify problems more easily. Gain the visibility you need to troubleshoot VPN connection errors, suspicious user activity, and more.


Start monitoring your VPN with PRTG and see how it can make your network more reliable and your job easier.


Preconfigured VPN monitoring sensors included with PRTG

PRTG uses SNMP for monitoring VPNs. SNMP is the easiest way to monitor a network, as network and CPU loads are kept to a minimum.


SNMP Cisco ASA VPN Traffic

The SNMP Cisco ASA VPN Traffic sensor monitors the traffic of an IPsec VPN connection on a Cisco ASA. It shows:

  • Incoming and outgoing traffic
  • Total traffic

SNMP SonicWall VPN Traffic

The SNMP SonicWall VPN Traffic sensor monitors the traffic of an IPsec VPN on a SonicWall NSA. It shows:

  • Number of encrypted and decrypted packets
  • Bytes of encrypted and decrypted transmissions
  • Number of incoming and outgoing fragmented packets

SNMP Library

The SNMP Library sensor uses a MIB file to create sensors that monitor a device via SNMP and provides custom monitoring beyond the standard SNMP sensors of PRTG.

Use this sensor, for example, to monitor the firewalls and security appliances of manufacturers such as Juniper and Fortinet in the corresponding VPNs.


IT experts agree: Paessler PRTG is a great solution for IT infrastructure monitoring

logo

“All-around winning
network monitor”

logo it brief

“The real beauty of PRTG is the endless possibilities it offers”

logo

“Outstanding cloud
monitoring”


PRTG is compatible with all major vendors, products, and systems


vendors applications blue


PRTG makes VPN server & network monitoring easy

Custom alerts and data visualization make it easy to monitor, identify, and prevent VPN connection and security issues.


Your VPN monitor at a glance – even on the go

Set up PRTG in minutes and use it on almost any mobile device.


PRTG comes with all the features you need, plus more your IT infrastructure won't want to live without.


PRTG monitors these vendors and applications in one view!


vendors vm ware


Create innovative solutions with Paessler’s partners

Partnering with innovative vendors, Paessler unleashes synergies to create
new and additional benefits for joined customers.

IP Fabric

Combining the broad monitoring feature set of PRTG with IP Fabric’s automated network assurance creates a new level of network visibility and reliability.

Read more

Rhebo

Rhebo and PRTG offer a comprehensive monitoring solution for IT and OT environments: from condition monitoring through to anomaly and threat detection.

Read more


gartner-peer-insights-badge-color.svg

“Excellent tool for detailed monitoring. Alarms and notifications work greatly. Equipment addition is straight forward and server initial setup is very easy. ...feel safe to purchase it if you intend to monitor a large networking landscape.”

Infrastructure and Operations Engineer in the Communications Industry, firm size 10B - 30B USD

Read the entire review at Gartner Peer Insights 


Easily find the source of the problem with our PRTG virtual private network monitoring solution

Real-time alerts and custom notifications make it easy to solve issues with VPN connections and suspicious network traffic.


Monitor VPN: FAQ


What is a VPN?

VPN stands for “virtual private network”. It is a method by which two endpoints create a single, private connection, or VPN tunnel, while using a larger network infrastructure such as the Internet or a WAN. When established, a VPN acts like a direct connection to a private network.

What are the benefits of a VPN?

With VPNs, employees who do not work within the company network (such as those working remote) are able to securely access company applications and collective resources. Branch offices can also connect, and mobile workers are able to effectively work with clients.

With the encrypted transportation of sensitive company data come strict requirements regarding security and connection stability. To meet these requirements, PRTG offers VPN network monitoring.

How does VPN monitoring work?

To make a VPN partner’s connection to a company network secure, VPNs use remote access secured via SSL/TLS with the Internet as a path. This path ends at a VPN gateway, or the dial-in node of the company network. Beyond this point, the VPN partner acts as a regular network client, accessing applications and data and using collaborative tools like all other clients.

Along with VPNs for connecting branches to the network (end-to-site VPN), there are also VPNs for connecting two networks (site-to-site VPN) and for the direct connection between VPN partners (end-to-end VPN). VPN monitoring tools like PRTG check virtual networks for availability, VPN connection types, load, and errors, as well as connected user accounts and transferred data volumes and packets.

What else can you monitor with PRTG?

PRTG is not only VPN monitoring software – with our all-in-one network monitoring tool, you can keep an eye on your entire IT infrastructure, including:


What is a sensor in PRTG?

In PRTG, “sensors” are the basic monitoring elements. One sensor usually monitors one measured value in your network, for example the traffic of a switch port, the CPU load of a server, or the free space on a disk drive.

On average, you need about 5-10 sensors per device or one sensor per switch port.


PRTG the multi-tool

PRTG: The multi-tool for sysadmins

Adapt PRTG individually and dynamically to your needs and rely on a strong API:

  • HTTP API: Access monitoring data and manipulate monitoring objects via HTTP requests
  • Custom sensors: Create your own PRTG sensors for customized monitoring
  • Custom notifications: Create your own notifications and send action triggers to external systems
  • REST Custom sensor: Monitor almost everything that provides data in XML or JSON format


Still not convinced?

love

More than 500,000
sysadmins love PRTG

Paessler PRTG is used by companies of all sizes. Sysadmins love PRTG because it makes their job a whole lot easier.

speed

Monitor your entire IT infrastructure

Bandwidth, servers, virtual environments, websites, VoIP services – PRTG keeps an eye on your entire network.

trial

Try Paessler PRTG
for free

Everyone has different monitoring needs. That’s why we let you try PRTG for free.


Paessler PRTG 

Start monitoring your VPN with PRTG and see how it can make your network more reliable and your job easier.


PRTG

Network Monitoring Software - Version 24.2.94.1400 (April 10th, 2024)

Hosting

Download for Windows and cloud-based version PRTG Hosted Monitor available

Languages

English, German, Spanish, French, Portuguese, Dutch, Russian, Japanese, and Simplified Chinese

Pricing

Up to 100 sensors for free (Price List)

Unified Monitoring

Network devices, bandwidth, servers, applications, virtual environments, remote systems, IoT, and more

Supported Vendors & Applications

More
cisco logo grey 40 dell logo grey 40 hp logo grey 40 ibm grey40 netapp grey40 linux grey40 aws grey40 windows grey40 vmware grey40 citrix grey40 exchange grey40 apache grey40 oracle grey40