• Company
    • About Us
    • Case Studies
    • Press Center
    • Careers
    • Blog
    • Contact us
  • Contact us
  • Login
 
  • English
    • Deutsch
    • Español
    • Français
    • Italiano
    • Português
Paessler
                    - The Monitoring Experts
  • Products
    • Paessler PRTG
      Paessler PRTGMonitor your whole IT infrastructure
      • PRTG Network Monitor
      • PRTG Enterprise Monitor
      • PRTG Hosted Monitor
      • PRTG UVexplorer
      • PRTG extensionsExtensions for Paessler PRTGExtend your monitoring to a new level
    • Icon Features
      FeaturesExplore all monitoring features
      • Maps & dashboards
      • Alerts & notifications
      • Multiple user interfaces
      • Distributed monitoring
      • Customizable reporting
  • Solutions
    • Industries
      IndustriesMonitor various industry sectors
      • Industrial
      • Healthcare
      • Data Center
      • Education
      • Finance
      • Government
    • IT Topics
      IT TopicsMonitor all areas of IT
      • Network Monitoring
      • Bandwidth Monitoring
      • SNMP Monitor
      • Network Mapping
      • WiFi Monitoring
      • Server Monitoring
  • Pricing
  • Resources
    • Getting Started
      Getting StartedModules for self-paced learning
    • How-to Guides
      How-to GuidesGet the most out of PRTG
    • Videos & Webinars
      Videos & WebinarsLearn from Paessler experts
    • IT  Knowledge
      IT KnowledgeExpand your IT knowledge
    • PRTG Manual
      PRTG ManualFull documentation
    • Knowledge Base
      Knowledge BaseShare community knowledge
    • PRTG Sensor Hub
      PRTG Sensor HubGet sensors, scripts & templates
    • Trainings
      PRTG TrainingLearn how to work with PRTG
  • Partners
    • Icon Handshake
      Become a PartnerFor resellers and channel partners
    • Icon MSP
      Become an MSPDeliver monitoring as a managed service
    • icon partner
      Partner PortalLog in to your partner account
    • Deal Registration
      Deal RegistrationRegister your sales opportunities
    • icon search
      Find a PartnerFind partners selling Paessler products
    • icon technology
      Technology AlliancesSee Paessler technology partnerships
    • Partner HubTools for Your Success
  • Company
    • About Us
    • Case Studies
    • Press Center
    • Careers
    • Blog
    • Contact us
  • Contact us
  • Login
  • English
    • Deutsch
    • Español
    • Français
    • Italiano
    • Português
  • Get a quote
  • Free trial
  1. Home>
  2. IT Topics>
  3. Hardware>
  4. TP-Link Monitoring

Enhance Network Performance with TP-Link Monitoring using PRTG

Keep a 24/7 eye on the health and performance of your business routers and switches

  • Centrally monitor traffic, system status, and firmware updates
  • Receive instant, real-time alerts on potential issues
  • Deploy SNMP, flow, syslog, and other technologies for detailed insights
Free download
PRODUCT OVERVIEW

Our Users Give Top Ratings for Monitoring With Paessler PRTG

Gartner peer insights
spiceworks
G2
Capterra

PRTG TP-Link monitoring: What you will find on this page

Table of content

    PRTG makes TP-Link monitoring as easy as it gets

    Custom alerts and data visualization let you quickly identify and prevent connectivity and performance issues on your routers and switches.

    Free download
    PRODUCT OVERVIEW

    Gain an ally in technical support with PRTG’s TP-Link monitoring

    TP-Link equipment is known for being reliable and affordable, making it a favorite for home and business networks alike. Still, even the best hardware needs consistent monitoring to keep it running well. That's where Paessler PRTG TP-Link monitoring comes in. It provides a comprehensive way to ensure your TP-Link routers, switches, access points, and other devices are available and performing at their best.

    Easy network device integration

    Managing and monitoring TP-Link devices across diverse network environments can be complex and time-consuming without a unified, compatible solution.

    PRTG has the exact tools to oversee your TP-Link hardware effectively. It works with both everyday and professional TP-Link devices, smart plugs, power adapters, and popular routers, providing a full picture of your network.

    Quick installation and setup

    Nobody wants to waste time getting a monitoring system up and running. PRTG stands out with its plug-and-play approach so you can begin collecting information from your routers and switches in minutes.

    Just enable SNMP on your devices, load the required MIB files, and PRTG will start showing you real-time data on your network's performance.

    Beyond the monitoring basics

    Basic monitoring tools lack the depth needed to uncover performance bottlenecks, resource inefficiencies, and potential security vulnerabilities in network devices.

    Beyond simple checks for connectivity, TP-Link monitoring with PRTG tracks important factors such as CPU usage, bandwidth, and unusual network traffic. This detailed oversight helps you spot performance issues, identify resource-intensive processes, and fine-tune your network for better efficiency.

    Prevent problems before they start

    Prevent issues instead of fixing them after they happen. By constantly monitoring your TP-Link devices, PRTG can detect potential issues and alert you before they impact your users.

    If PRTG notices a sudden increase in bandwidth usage on a particular interface, for example, you can identify the cause and take steps before it leads to network congestion. With monitoring the uptime of your TP-Link routers, you can catch connectivity problems that could affect important services.

    Custom alerts and notifications

    Delayed responses to network issues can risk data loss and more. PRTG's real-time alert system lets you set custom thresholds for important metrics. Receive instant notifications via email, SMS, or push notifications when something unusual does occur.

    Take alerts to the next level by customizing your alerts to suit. Create template-based escalation levels and make sure that the right team is informed at the right time.

    What TP-Link monitoring looks like in PRTG

    Diagnose network issues by continuously tracking the availability, health, and performance of your TP-Link network devices. Show uptime, hardware health, CPU load, memory usage, data traffic, bandwidth usage, and other key metrics in real time. Visualize monitoring data in clear graphs and dashboards to identify problems more easily. Gain the overview you need to troubleshoot all kinds of issues with your TP-Link environment.

    PRTG Screenshot device tree view

    Device tree view of the complete monitoring setup

    PRTG screenshot map entire it infrastructure

    Custom PRTG dashboard for keeping an eye on the entire IT infrastructure

    PRTG screenshot graph live data traffic

    Live traffic data graph in PRTG

    Start monitoring TP-Link devices with PRTG and see how it can make your network more reliable and your job easier.

    Free download
    PRODUCT OVERVIEW

    IT experts agree: Paessler PRTG is a great solution for IT infrastructure monitoring

    PCMag

    “All-around winning
     network monitor”

    IT Brief

    “The real beauty of PRTG is the endless possibilities it offers”

    ITPro

    “PRTG Network Monitor 
    is very hard to beat”

    4 more reasons why to choose PRTG as your TP-Link monitoring tool

    icon servers

    Get an all-in-one monitoring tool

    It’s common to have a mix of hardware from different brands in a network. PRTG offers a single network management system that includes monitoring TP-Link devices and more.

    Monitor your entire network, including firewalls, servers, applications, and cloud services, from one easy-to-use dashboard.

    Icon Adapt

    Customize and scale to fit your need

    Every network is different. PRTG's flexible sensor system allows you to customize your monitoring setup to meet your exact needs.

    Whether you're monitoring a few routers or hundreds of devices across multiple locations, PRTG scales smoothly.

    Icon Statistics

    Enjoy a user-friendly interface

    PRTG's straightforward web interface and apps for mobile devices (available for iOS and Android) make it simple to check your network's status anytime, anywhere.

    Customizable dashboards allow you to view important information quickly, while detailed options provide deeper insights when needed. This user-friendly interface ensures you can quickly find the information needed to make decisions without getting bogged down in complicated settings.

    Icon Sheet

    Generate detailed reports

    With PRTG's reporting system, you can easily generate comprehensive reports on your TP-Link devices' performance over time.

    These reports provide useful data for understanding long-term patterns and help you make informed decisions about capacity planning, upgrades, and troubleshooting.

    Explore our preconfigured PRTG sensors for TP-Link monitoring

    PRTG comes with more than 250 native sensor types for monitoring your entire on-premises, cloud, and hybrid cloud environment out of the box. Check out some examples below!

    SNMP Disk Free v2

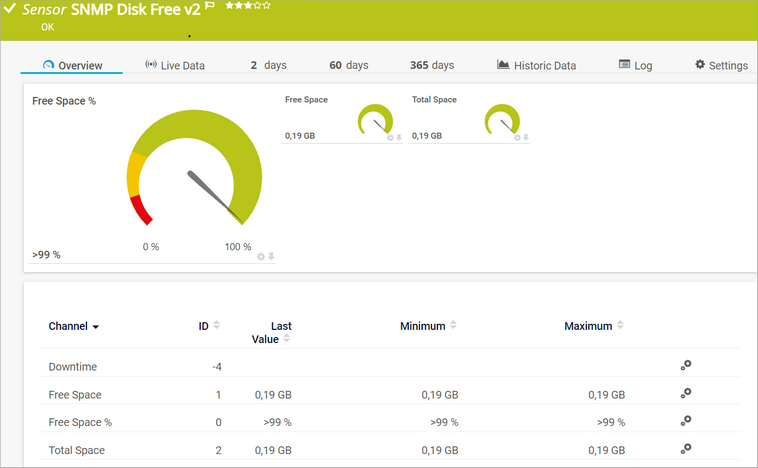
    The SNMP Disk Free v2 sensor monitors the free disk space on a logical disk. It can show the following:

    • Free space
    • Total space
    SNMP Disk Free v2
    SNMP Disk Free v2

    SNMP CPU Load

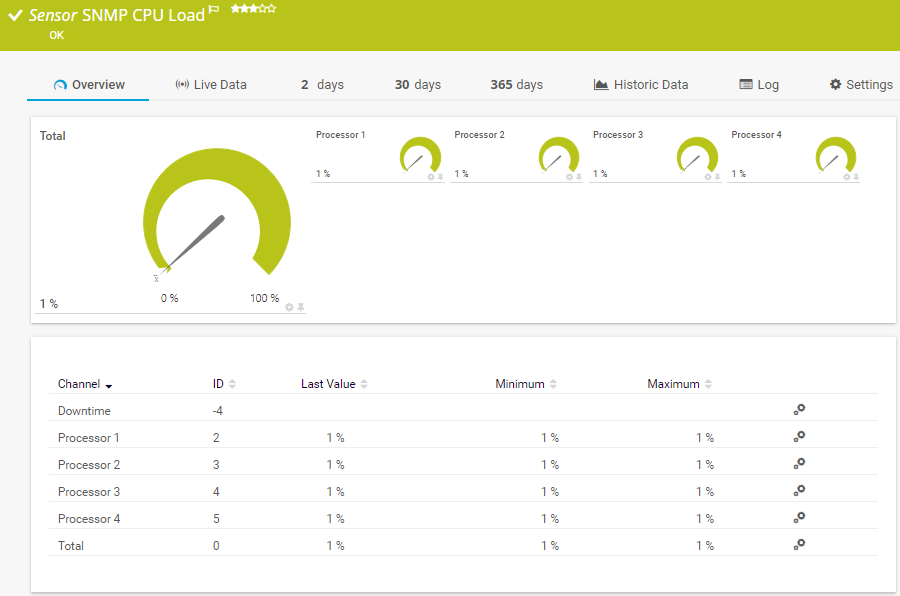
    The SNMP CPU Load sensor monitors the system load. It can show the following:

    • CPU load of a specific processor
    • Total CPU load
    SNMP CPU Load
    SNMP CPU Load

    SNMP Traffic v2

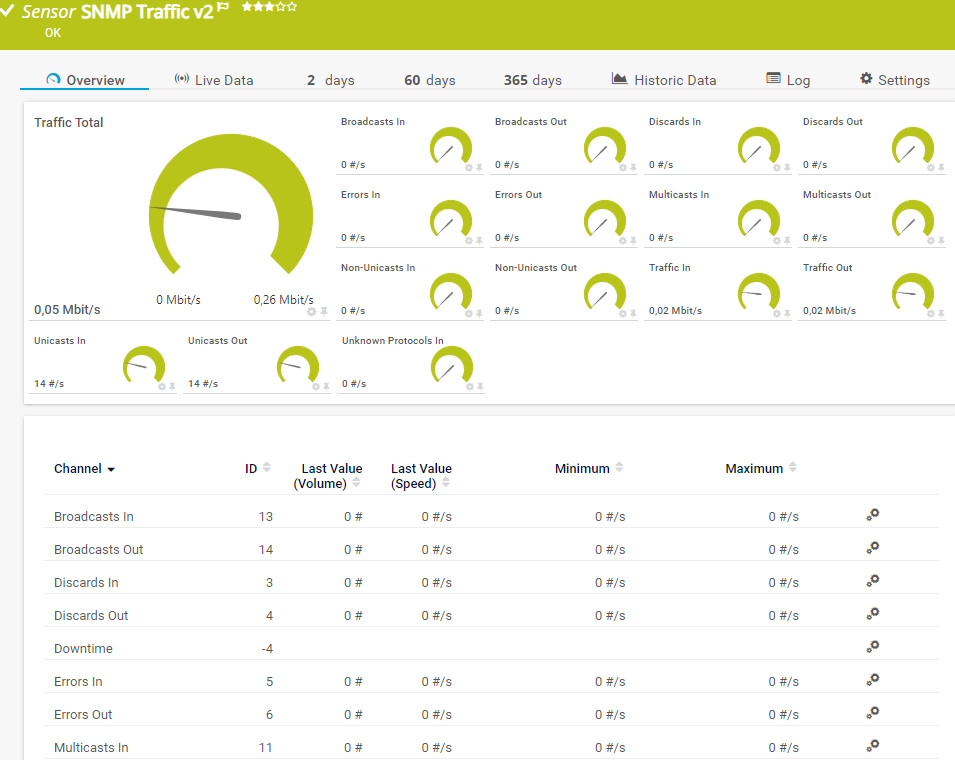
    The SNMP Traffic v2 sensor monitors bandwidth and traffic on a device. It can show the following:

    • Number of incoming and outgoing broadcast, multicast, unicast, and non-unicast packets
    • Number of incoming and outgoing discards and errors
    • Total, incoming, and outgoing traffic
    • Number of incoming, unknown protocols
    SNMP Traffic v2
    SNMP Traffic v2

    SNMP Custom Advanced

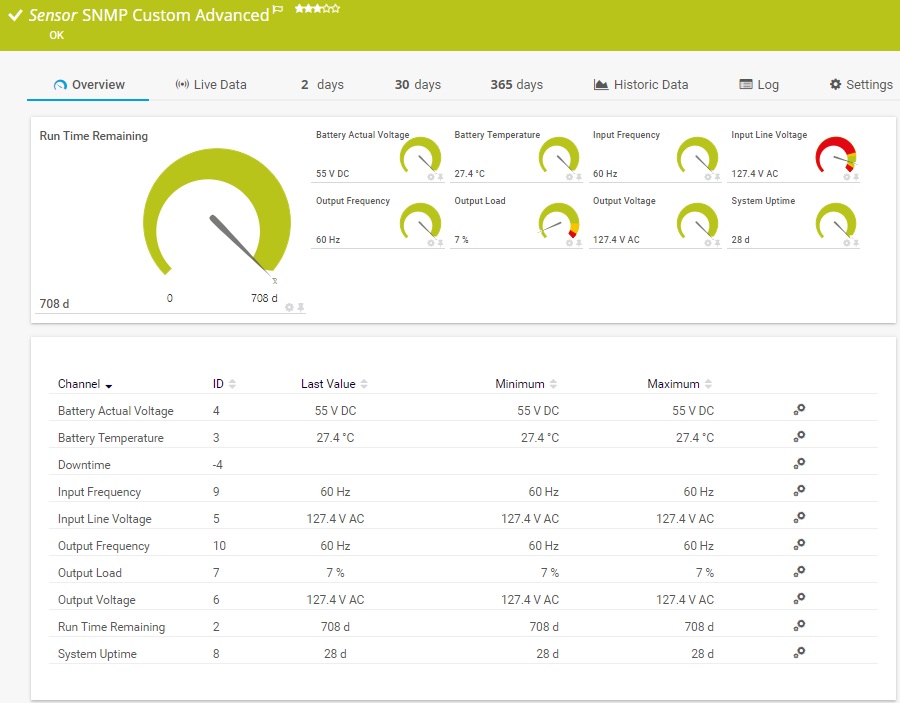
    The SNMP Custom Advanced sensor monitors numeric values returned for object identifiers (OID). It can show the following:

    • Downtime
    • Numeric value for a specified OID (up to 10 OIDs are possible) that refers to a specific SNMP device
    SNMP Custom Advanced
    SNMP Custom Advanced

    See the PRTG Manual for a list of all available sensor types.

    PRTG Is Compatible With All Major Vendors, Products, and Systems

    compatible with all major vendors, products, and systems

    PRTG makes TP-Link monitoring as easy as it gets

    Custom alerts and data visualization let you quickly identify and prevent connectivity and performance issues on your routers and switches.

    Free download
    PRODUCT OVERVIEW

    “From a server perspective, we're monitoring all of the key components of our service such as CPU usage, RAM disk space, the Windows services that it's running, and network connectivity of that server. In terms of networks, we’re monitoring all of our switches, firewalls, and access points. It’s really useful to be able to easily pull performance metrics from the PRTG dashboard.”

    Ollie Kerslake, Infrastructure Lead
    Riverford Organic Farmers

    “The tool has given us greater control over all types of devices connected to the network (switches, IP telephony, security cameras, IoT, WiFi) that previously remained opaque when dealing with service incidents. This has improved our ability to diagnose and resolve problems, which has translated into greater efficiency and a better user experience in both internal and public services.”

    Jordi Tolosà Bel, New Technologies Technician
    Vinaroz City Council

    “Our objective was to be able to monitor the health of our most critical servers containing data and applications, but also the flows and bandwidth between headquarters, our 50 servers in the cloud and the 15 servers at our production sites. For us, it is essential to have a proactive approach to understand where the weaknesses of the IT system are to be able to improve them.”

    Marc Boullier, CIO
    Carambar & Co

    Your TP-Link monitor at a glance – even on the go

    PRTG is set up in a matter of minutes and can be used on a wide variety of mobile devices.

    device overview
    Gartner peer insights

    “Excellent tool for detailed monitoring. Alarms and notifications work greatly. Equipment addition is straight forward and server initial setup is very easy. ...feel safe to purchase it if you intend to monitor a large networking landscape.”

    Read the complete review at Gartner Peer Insights

    Create innovative solutions with Paessler’s IT partners

    Partnering with innovative IT vendors, Paessler unleashes synergies to create
    new and additional benefits for joined customers.

    baramundi

    baramundi

    baramundi and PRTG create a secure, reliable and powerful IT infrastructure where you have everything under control - from the traffic in your firewall to the configuration of your clients.

    Read more
    INSYS icom

    INSYS icom

    With the combination of PRTG and Insys, the monitoring specialist Paessler and the industrial gateway manufacturer INSYS icom offer a practical possibility to merge IT and OT.

    Read more
    Siemon

    Siemon

    Siemon and Paessler bring together intelligent building technology and advanced monitoring and make your vision of intelligent buildings and data centers become reality.

    Read more

    Find the root cause of the problem with our PRTG TP-Link monitoring solution

    Real-time notifications mean faster troubleshooting so that you can act before more serious issues occur.

    Free download
    PRODUCT OVERVIEW
    Paessler PRTG

    Paessler PRTG

    Network Monitoring Software – Version 26.1.116.1532 (February 9th, 2026)

    Hosting icon

    Hosting

    Download for Windows and cloud-based version PRTG Hosted Monitor available

    Languages icon

    Languages

    English, German, Spanish, French, Portuguese, Dutch, Russian, Japanese, and Simplified Chinese

    test

    Monitor everything

    Network devices, bandwidth, servers, applications, virtual environments, remote systems, IoT, and more

    test

    Pricing

    Choose the PRTG Network Monitor subscription that's best for you

    Discover more monitoring insights and stories

    Content illustration

    Powerful stories from the monitoring world

    • Protocols, gateways and data transmission methods for building ...
    • Monitoring Windows DHCP With PRTG - Paessler Blog
    • How to identify unknown devices on your network: A complete guide
    Support illustration

    Resources to master your monitoring challenges

    • Understanding Basic Concepts
    • Quick Start Guide
    • I run PRTG on VMware. How can I obtain best performance?
    Solution illustration

    Solutions for all your monitoring needs

    • Monitoring Hardware
    • Router Monitoring
    • Linksys Monitoring

    TP-Link Monitoring: FAQ


    What is TP-Link monitoring?

    TP-Link monitoring refers to the process of tracking and managing the performance, health, and usage of TP-Link devices within a network. TP-Link is a widely used Chinese brand of networking equipment, including routers, switches, access points, and smart home devices. Monitoring these devices ensures they are operating efficiently, securely, and without interruptions.

    Can PRTG monitor both regular and business-grade TP-Link devices?

    Yes, PRTG is flexible enough to monitor both consumer-level products like home Wi-Fi routers and professional-grade equipment such as managed switches and enterprise access points.

    How does PRTG manage firmware updates for TP-Link devices?

    While PRTG doesn't update firmware directly, it tracks the current software version on your TP-Link devices and alerts you when new versions are available, helping you plan and execute updates efficiently.

    Can I monitor TP-Link devices alongside equipment from other manufacturers?

    Absolutely. PRTG is designed to work with a wide variety of network devices from different brands, including Cisco, Netgear, Juniper, Fortinet, and of course, TP-Link, without compatibility issues. You can monitor your equipment alongside devices from other manufacturers, all from a single, central interface.

    What are the key benefits of implementing TP-Link monitoring in enterprise environments?

    Implementing comprehensive TP-Link monitoring provides several critical advantages for enterprise networks. 

    First, proactive monitoring enables administrators to detect performance issues, bandwidth bottlenecks, and device failures before they impact business operations, ensuring maximum network uptime. 

    Second, centralized TP-Link monitoring allows for efficient management of multiple devices across different locations, providing unified visibility into router performance, switch utilization, and access point connectivity. 

    Additionally, proper monitoring helps optimize network performance by identifying underutilized resources and planning for capacity upgrades based on historical usage patterns and traffic analysis.

    What is a sensor in PRTG?

    In PRTG, “sensors” are the basic monitoring elements. One sensor usually monitors one measured value in your network, for example the traffic of a switch port, the CPU load of a server, or the free space on a disk drive. On average, you need about 5-10 sensors per device or one sensor per switch port.

    We asked: would you recommend PRTG? Over 95% of our customers say yes!

    Paessler conducted trials in over 600 IT departments worldwide to tune its network monitoring software closer to the needs of sysadmins. The result of the survey: over 95% of the participants would recommend PRTG – or already have.

    recommendation

    Still not convinced?

    Love

    More than 500,000 sysadmins love PRTG

    Paessler PRTG is used by companies of all sizes. Sysadmins love PRTG because it makes their job a whole lot easier.

    PRTG

    Monitor your entire IT infrastructure

    Bandwidth, servers, virtual environments, websites, VoIP services – PRTG keeps an eye on your entire network.

    test

    Try Paessler PRTG for free

    Everyone has different monitoring needs. That’s why we let you try PRTG for free.

    PRTG Logo

    Start monitoring TP-Link devices with PRTG and see how it can make your network more reliable and your job easier.

    Free download
    PRODUCT OVERVIEW

    Products

    • Paessler PRTG
      Paessler PRTGMonitor your whole IT infrastructure
      • PRTG Network Monitor
      • PRTG Enterprise Monitor
      • PRTG Hosted Monitor
      • PRTG UVexplorer
      • PRTG extensions
        Extensions for Paessler PRTGExtend your monitoring to a new level
    • Icon Features
      FeaturesExplore all monitoring features

    Monitoring with PRTG

    • Network monitoring
    • Bandwidth monitoring
    • SNMP monitoring
    • Network mapping
    • Wi-Fi monitoring
    • Server monitoring
    • Network traffic analyzer
    • NetFlow monitoring
    • Syslog server

    Useful Links

    • PRTG Manual
    • Knowledge Base
    • Customer Success Stories
    • About Paessler
    • Subscribe to newsletter
    • PRTG Support
    • PRTG Consulting
    • PRTG Feedback & Roadmap

    Contact

    Paessler GmbH
    Thurn-und-Taxis-Str. 14, 
    90411 Nuremberg 
    Germany

    [email protected]

    +49 911 93775-0

    • Contact us
    ©2026 Paessler GmbHTerms & ConditionsPrivacy PolicyImprintReport VulnerabilityDownload & InstallSitemap
    Sensor Hub Sensor Hub Sensor Hub