![]()
Low web performance?
Try PRTG as website load tester

Monitor your website
Keep an eye on load times, processes, and content
Be alerted in the event of interruptions and errors
PRTG as website load tester
Active load test vs. passive website monitoring
Active website load tests
Do you wish to deliberately test the load of your website? Or simulate pageviews and users and perform a stress test on your network bandwidth? Our Webserver Stress Tool can help. It will provide you with precise details on the breaking point of your website. The Webserver Stress Tool can be downloaded independently of PRTG. Please check beforehand whether your network can support it.
Passive website monitoring
PRTG is a network monitoring tool. It lets you continually monitor your website, servers, and applications. When it comes to your website, you'll mainly monitor availability, load times, and processes. PRTG immediately sounds the alarm if the performance of your website drops. Its notification system can be customized to meet the specific needs of your company. Try PRTG for free and execute a web performance testing!
➔ 5 examples of monitoring with PRTG
Test the performance of your website with our Webserver Stress Tool
![]()
The tool
The Webserver Stress Tool is a software that can test an HTTP server to help you determine when the speed of your web server or applications is likely to suffer. How it works: the tool simulates hundreds or thousands of visitors, all of whom send HTTP requests to the server at the same time. This simulation will allow you to clearly and immediately identify the load at which your website performance begins to drop.
![]()
The amount of load it can generate
The Webserver Stress Tool can be tested at up to the following threshold values: approx. 500 mbps of bandwidth; one million pageviews per hour; 10,000 simultaneous users.
![]()
System requirements
Please note: The Webserver Stress Tool has not been updated since 2014. At Paessler, we devote all our time to PRTG. You will not be able to use the Webserver Stress Tool to perform stress tests on SSL-encrypted pages. It will prove useful, however, for an internal network or other individual cases.
![]()
Why should I run a load testing tool?
Often performance problems are hidden. At normal everyday loads, these problems are undetectable. Load and performance tests allow you to test the maximum availability and speed of your website. The tool’s diagrams are easy to understand. And to get started, you’ll only need a few minutes.
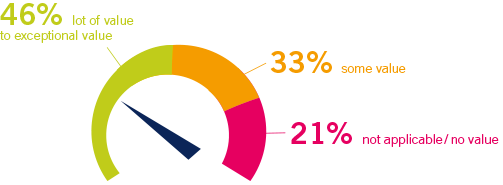
Example performance test
We’ve run an example performance test to give you an idea of how the tool works.
Click on the links below for more detailed documents, graphs, and data.
| Test Description | Users | |
|---|---|---|
| Probing the limits of a web server: Requesting a simple HTML page every 2 seconds in a ramp test | 4,000 | Details |
| In this test we wanted to see the difference between two web server programs on the same machine. | 1,000 | Details |
| In this test we are trying to find the maximum bandwidth a web server can serve. | 100 | Details |
| Test Description | Users | Pageviews | Bandwidth kbit/s | |
|---|---|---|---|---|
| Probing the limits of a server: Comparing request times of a static HTML file vs. a CGI Script | 1300 | ~78,000 | ~750 | Details |
| Megabit/Gigabit Upgrade for a Download Server: Comparing user experience of a download server connected to a 100MBit and a GigaBit network | 250 | ~46,000 downloads | ~120,000 | Details |
| Limits of a Download Server for Large Downloads: Probing the maximum number of users without deterioration of performance | 100 | ~6,400 downloads | ~480,000 | Details |
| Probing a Webserver with 3000 Users: Running a test with up to 3000 users against an IIS6 server | 3,000 | ~1,050,000 | ~10,000 | Details |
| Webserver Burn-In Test: Testing a server with constant load for 8 hours | 3,000 | ~1,070,000 | ~15,000 | Details |
| PHP Script Stress Test: Up to 500 users accessing a PHP script perpetually | 500 | ~326,000 | ~30,000 | Details |
| Comparing PHP Script Performance on Linux and Windows: Running two tests with different server OS on the same hardware | 500 | ~285,500 | ~24,000 | Details |
Monitor the performance of your website with PRTG
![]()
PRTG at a glance
PRTG keeps a constant eye on your entire IT infrastructure. With PRTG, you get a global overview of your network devices, website, bandwidth, servers, apps, virtual environments, and more. You’ll need around 10 sensors per device, or one sensor to monitor CPU, memory, the hard drive, and more. Licenses are determined by the number of sensors you will require.
![]()
PRTG monitoring
The most basic version of PRTG is free of charge. You can use it to monitor a small network. All functions (including reports and the alarm) are included. If the time comes to expand your monitoring, simply choose the license that meets your needs. You can always upgrade your license later.
![]()
System requirements
PRTG is a network monitoring tool for Windows systems. However, it can also be used with Linux-based networks. If you have a problem configuring or customizing your monitoring, our technical support team will be happy to help – and usually answers inquiries within 24 hours on weekdays. You can also find the answers to many questions in our knowledge base.
![]()
Why should I monitor my network?
PRTG lets you keep a constant eye on the performance of your network. It promptly sends you an alert if your system malfunctions. This means you can go about your daily work with total peace of mind. Thanks to long-term analyses and reports, you can also monitor how your network load evolves.

The goal: 99.999 percent!
When it comes to the availability of your website, servers, and databases, only one figure matters: 99.999. These “five nines” are indicative of the high availability of your network. PRTG helps you target this ambitious goal.
5 reasons to choose PRTG for your website monitoring
![]() How PRTG defines sensors
How PRTG defines sensors
In PRTG, “sensors” are the basic monitoring elements. One sensor usually monitors one measured value in your network, e.g. the traffic of a switch port, the CPU load of a server, the free space of a disk drive. On average you need about 5-10 sensors per device or one sensor per switch port.
![]()
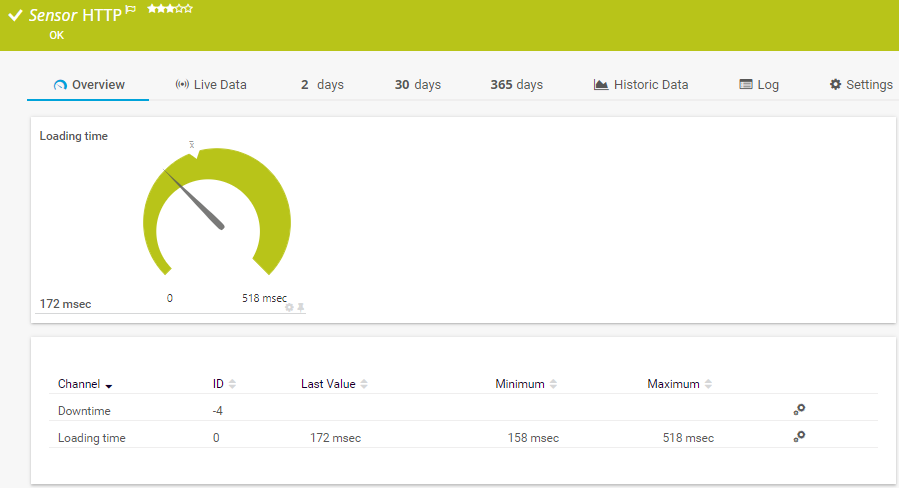
Monitor availability with the HTTP v2 Sensor
With the HTTP v2 Sensor, you can see how long it takes to load an individual page. If the load time increases, you’ll be notified at once. The HTTP Advanced Sensor determines the download speed, or the “time to first byte.”
![]()
Obtain detailed load time data with the HTTP Full Web Page Sensor
How long does it take for the entire website to load? Which elements are slowing the page down? How do load times change over extended periods of time? Get the answers to these questions with the HTTP Full Web Page Sensor.
![]()
Monitor content with the HTTP Content Sensor
The HTTP Content Sensor is an all-purpose sensor. It lets you monitor a variety of information, read the internal values of web applications (such as visitor numbers), or be notified if a page has been updated.
![]()
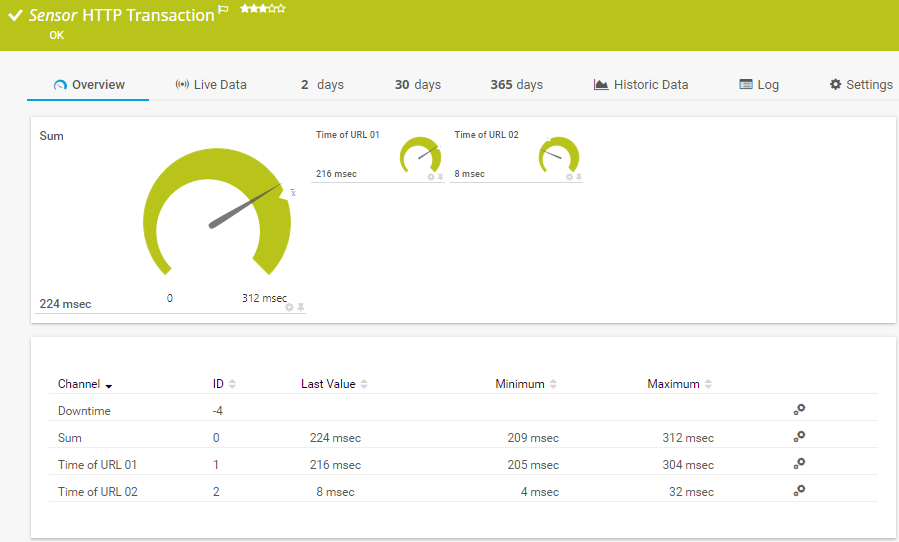
Monitor order processes with the HTTP Transaction Sensor
It’s a long road from the first visit to the login screen, shopping cart, and confirmation page. It can be extremely frustrating to encounter errors or interruptions along the way. Monitor the functionality and processes of your website with the HTTP Transaction Sensor.
![]()
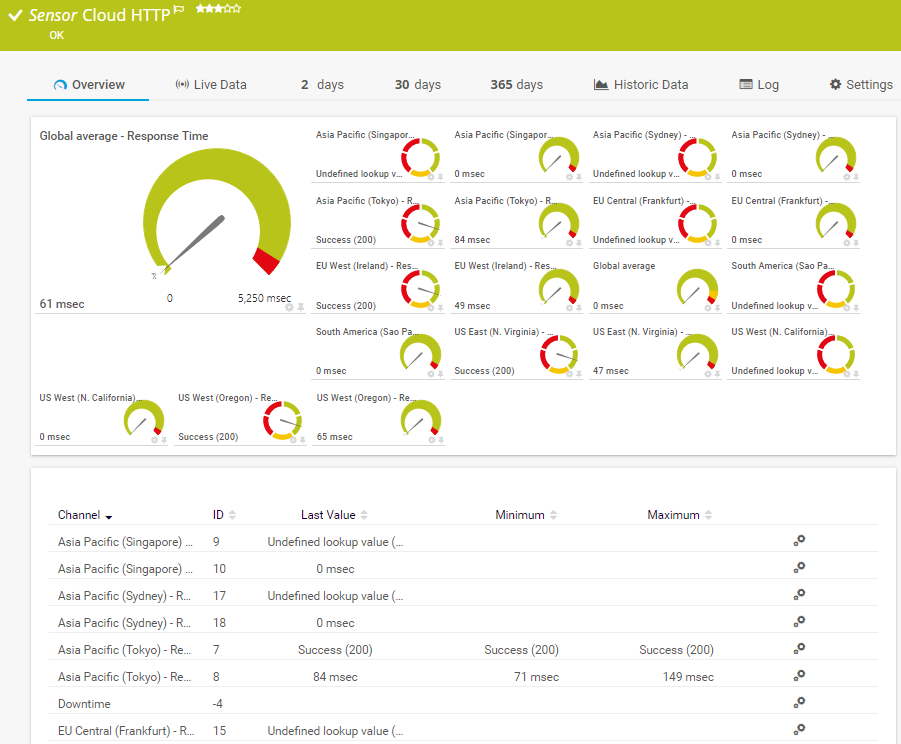
Monitor distributed networks with the Cloud HTTP v2 Sensor
Many companies have customers all over the world. Use the Cloud HTTP v2 Sensor and Cloud Ping v2 Sensor to check the availability of your website from each and every continent. Make sure your website is always up and running for customers around the globe.
An introduction to PRTG sensors
HTTP Sensor
Cloud HTTP v2 sensor
HTTP Transaktion Sensor
Trusted by 500,000 users and recognized
by industry analysts as a leader

“Fantastic network and infrastructure monitoring solution that is easy to deploy and easier still to use. Simply the best available.”

“Software is absolutely perfect, Support is superior. Meets all needs and requirements, this is a must have solution if you are needing any form of monitoring.”

“The tool excels at its primary focus of being a unified infrastructure management and network monitoring service.”
Keep a constant eye on your network – even while on the go
Set up PRTG in minutes and use it on almost any mobile device.


“Our network engineers really love PRTG, because of its customization”
John Krull, CTO, Oakland Unified School District, USA
PRTG is worth it: You’ll optimize your entire IT!
The costs for a one-year PRTG license usually pay for themselves within a few weeks.
PRTG improves the reliability of your network
PRTG saves network management costs
PRTG saves time spent on network management
“Easy to implement and configure with good technical support.”
R. v. S., ICT Manager at Heinen & Hopman Eng BV

What else can PRTG do? Keep reading!
Monitor traffic
Why is my system so slow? To answer this question, set up some customized traffic monitoring. You’ll discover how much bandwidth is being used by each of your devices and applications. SNMP monitoring gives you an overview. Packet sniffing and NetFlow monitoring analyze your traffic in detail.
Monitor websites
Want to take a closer look at your website? Find out the best way to configure your website monitoring. We offer a variety of tips and tricks to help you improve your load times. By the way, you can also monitor your WLAN with PRTG.
Monitor VoIP
When the firm’s VoIP goes down, the sysadmin and IT support team are immediately bombarded with calls. VoIP monitoring and QoS monitoring will help you ensure your VoIP is always up and running.

Get your free copy of our website performance ebook now.
Create innovative solutions with Paessler’s partners
Partnering with innovative vendors, Paessler unleashes synergies to create
new and additional benefits for joined customers.


With ScriptRunner, Paessler integrates a powerful event automation platform into PRTG Network Monitor.
ScriptRunner

PRTG: The multi-tool for sysadmins
Adapt PRTG individually and dynamically to your needs and rely on a strong API:- HTTP API: Access monitoring data and manipulate monitoring objects via HTTP requests
- Custom sensors: Create your own PRTG sensors for customized monitoring
- Custom notifications: Create your own notifications and send action triggers to external systems
- REST Custom sensor: Monitor almost everything that provides data in XML or JSON format
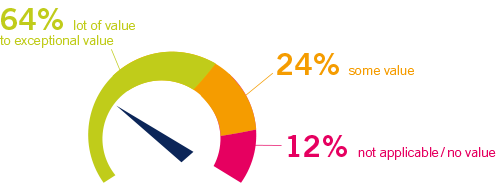
We asked: would you recommend PRTG?
Over 95% of our customers say yes!
Paessler AG conducted trials in over 600 IT departments worldwide to tune its network monitoring software closer to the needs of sysadmins.
The result of the survey: over 95% of the participants would recommend PRTG – or already have.

Still not convinced?
![]()
More than 500,000 sysadmins love PRTG
Paessler PRTG is used by companies of all sizes. Sysadmins love PRTG because it makes their job a whole lot easier.
Still not convinced?
![]()
Monitor your entire IT infrastructure
Bandwidth, servers, virtual environments, websites, VoIP services – PRTG keeps an eye on your entire network.
![]()
Try Paessler PRTG for free
Everyone has different monitoring needs. That’s why we let you try PRTG for free. Start now with your trial.
|
PRTG |
Network Monitoring Software - Version 24.2.94.1400 (April 10th, 2024) |
|
Hosting |
Download for Windows and cloud-based version PRTG Hosted Monitor available |
Languages |
English, German, Spanish, French, Portuguese, Dutch, Russian, Japanese, and Simplified Chinese |
Pricing |
Up to 100 sensors for free (Price List) |
Unified Monitoring |
Network devices, bandwidth, servers, applications, virtual environments, remote systems, IoT, and more |
Supported Vendors & Applications |
|