• Company
    • About Us
    • Case Studies
    • Press Center
    • Careers
    • Blog
    • Contact us
  • Contact us
  • Login
 
  • English
    • Deutsch
    • Español
    • Français
    • Italiano
    • Português
Paessler
                    - The Monitoring Experts
  • Products
    • Paessler PRTG
      Paessler PRTGMonitor your whole IT infrastructure
      • PRTG Network Monitor
      • PRTG Enterprise Monitor
      • PRTG Hosted Monitor
      • PRTG UVexplorer
      • PRTG extensionsExtensions for Paessler PRTGExtend your monitoring to a new level
    • Icon Features
      FeaturesExplore all monitoring features
      • Maps & dashboards
      • Alerts & notifications
      • Multiple user interfaces
      • Distributed monitoring
      • Customizable reporting
  • Solutions
    • Industries
      IndustriesMonitor various industry sectors
      • Industrial
      • Healthcare
      • Data Center
      • Education
      • Finance
      • Government
    • IT Topics
      IT TopicsMonitor all areas of IT
      • Network Monitoring
      • Bandwidth Monitoring
      • SNMP Monitor
      • Network Mapping
      • WiFi Monitoring
      • Server Monitoring
  • Pricing
  • Resources
    • Getting Started
      Getting StartedModules for self-paced learning
    • How-to Guides
      How-to GuidesGet the most out of PRTG
    • Videos & Webinars
      Videos & WebinarsLearn from Paessler experts
    • IT  Knowledge
      IT KnowledgeExpand your IT knowledge
    • PRTG Manual
      PRTG ManualFull documentation
    • Knowledge Base
      Knowledge BaseShare community knowledge
    • PRTG Sensor Hub
      PRTG Sensor HubGet sensors, scripts & templates
    • Trainings
      PRTG TrainingLearn how to work with PRTG
  • Partners
    • Icon Handshake
      Become a PartnerFor resellers and channel partners
    • Icon MSP
      Become an MSPDeliver monitoring as a managed service
    • icon partner
      Partner PortalLog in to your partner account
    • Deal Registration
      Deal RegistrationRegister your sales opportunities
    • icon search
      Find a PartnerFind partners selling Paessler products
    • icon technology
      Technology AlliancesSee Paessler technology partnerships
    • Partner HubTools for Your Success
  • Company
    • About Us
    • Case Studies
    • Press Center
    • Careers
    • Blog
    • Contact us
  • Contact us
  • Login
  • English
    • Deutsch
    • Español
    • Français
    • Italiano
    • Português
  • Get a quote
  • Free trial

Reliable Network Performance Test Tool

Monitor latency, packet loss, network speed, bandwidth, and throughput continuously, across every device, site, and link.

Free download
PRODUCT OVERVIEW

What Does a Network Performance Test Tool Need to Show You? 

A network performance test tool is only useful if it gives you data you can actually act on. Not just a snapshot from one moment, but a continuous record across all your devices and links. That means multiple measurement methods, historical data you can go back to, and coverage that doesn't leave gaps. The combination of ICMP, SNMP, flow protocols like NetFlow, jFlow, sFlow, and IPFIX, plus QoS sensors and HTTP response monitoring is what separates a monitoring setup from a one-time test. 

Paessler PRTG brings all of these into one interface, covering on-premises, hybrid, and multi-site environments. It keeps collecting whether or not you're actively looking. Real-time data and historical records, all in the same place. PRTG collects network performance data from Cisco, Juniper, HP/Aruba, Ubiquiti, Dell, and other SNMP-capable routers, switches, and firewalls. Measurement methods include ICMP, SNMP v1/v2c/v3, NetFlow, jFlow, sFlow, IPFIX, WMI, and packet sniffing. 

Download PRTG Trial

What you will find on this page

  • See your Network Performance
  • How to Monitor Network Performance
  • Manual Network Testing vs. PRTG
  • FAQs

PRTG is compatible with all major vendors, products, and systems

compatible with all major vendors, products, and systems

What PRTG Shows You About Your Network Performance

Pinpoint Exactly What's Happening on Your Network

PRTG collects interface utilization, traffic breakdowns by protocol and source, and device-level resource data in parallel. Cross-referencing these lets you narrow down which segment or device is most likely involved. The analysis is yours; PRTG gives you the data to do it. That matters because having visibility across multiple collection points turns every performance question into something answerable. Is it the WAN uplink? A device saturating a segment? High latency on a critical path? A server hitting resource limits? With data from multiple points simultaneously, you work from evidence instead of assumptions, and identifying bottlenecks becomes a structured process. 

  • Interface utilization across routers, switches, and firewalls
  • Traffic breakdown by protocol and source/destination
  • Device-level performance data (CPU, memory) for Windows hosts
  • Per-device visibility to help isolate the source segment and narrow down likely bottlenecks

Performance Data You Can Go Back To Anytime

Performance degrades, users report it, you check, and everything looks normal. The problem was real, but it's gone. Because PRTG polls at configurable intervals, every data point is stored, so when a complaint references a specific time window, you look at the historical graph: did latency spike? Did packet loss occur? Did an interface hit high utilization? 

Worth noting: PRTG is scanning-based, not streaming. A spike shorter than your scanning interval may not be captured. At standard 1-minute intervals, though, the vast majority of user-impacting events will show up. Test results are timestamped and available hours, days, and weeks later, not just during the moment you happen to be watching.  

  • Polling at configurable intervals (often as low as ~60 seconds, depending on sensor settings)
  • Timestamped historical data accessible hours, days, and weeks later
  • Visual graphs showing exactly when conditions changed
  • Data retention across all monitored metrics
PRTG Ping sensor graphs showing response time, min, max, and packet loss over time

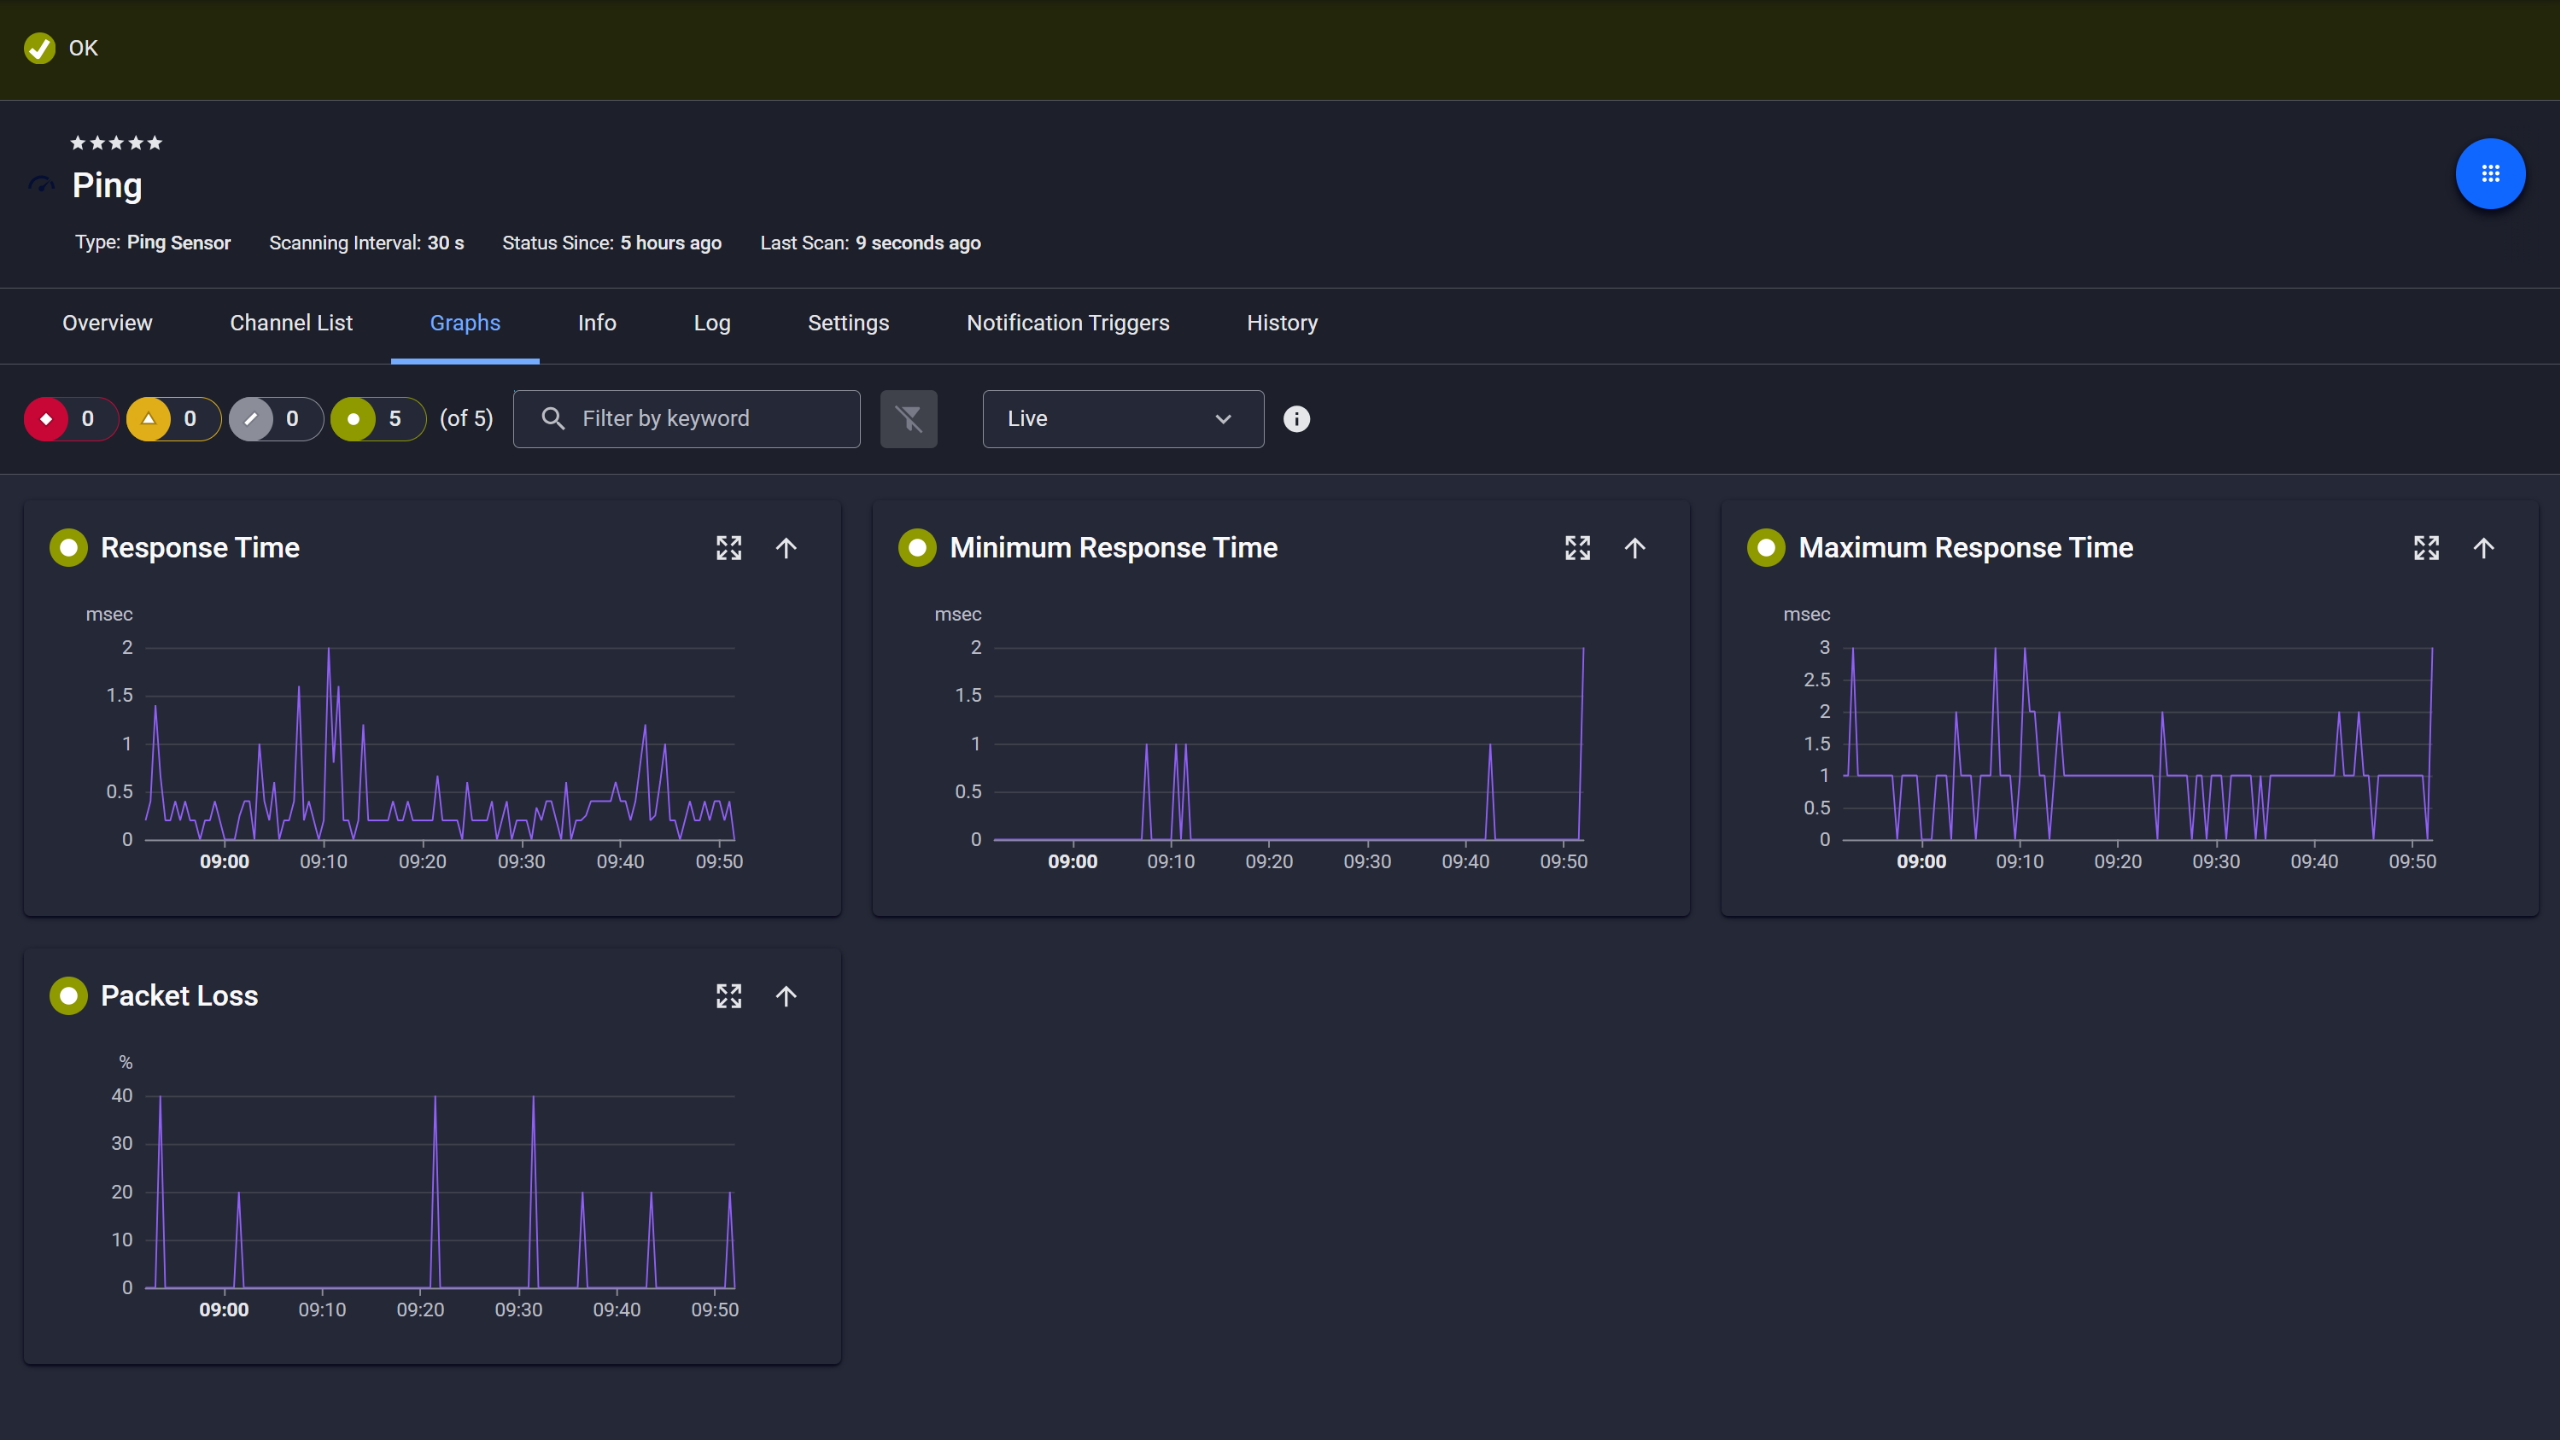
Ping response and packet loss

PRTG web interface showing live performance graphs for a Probe Health sensor

Live graphs, real-time performance data

PRTG device overview for an HPE Aruba 2530 switch with port state, ping, and CPU sensors

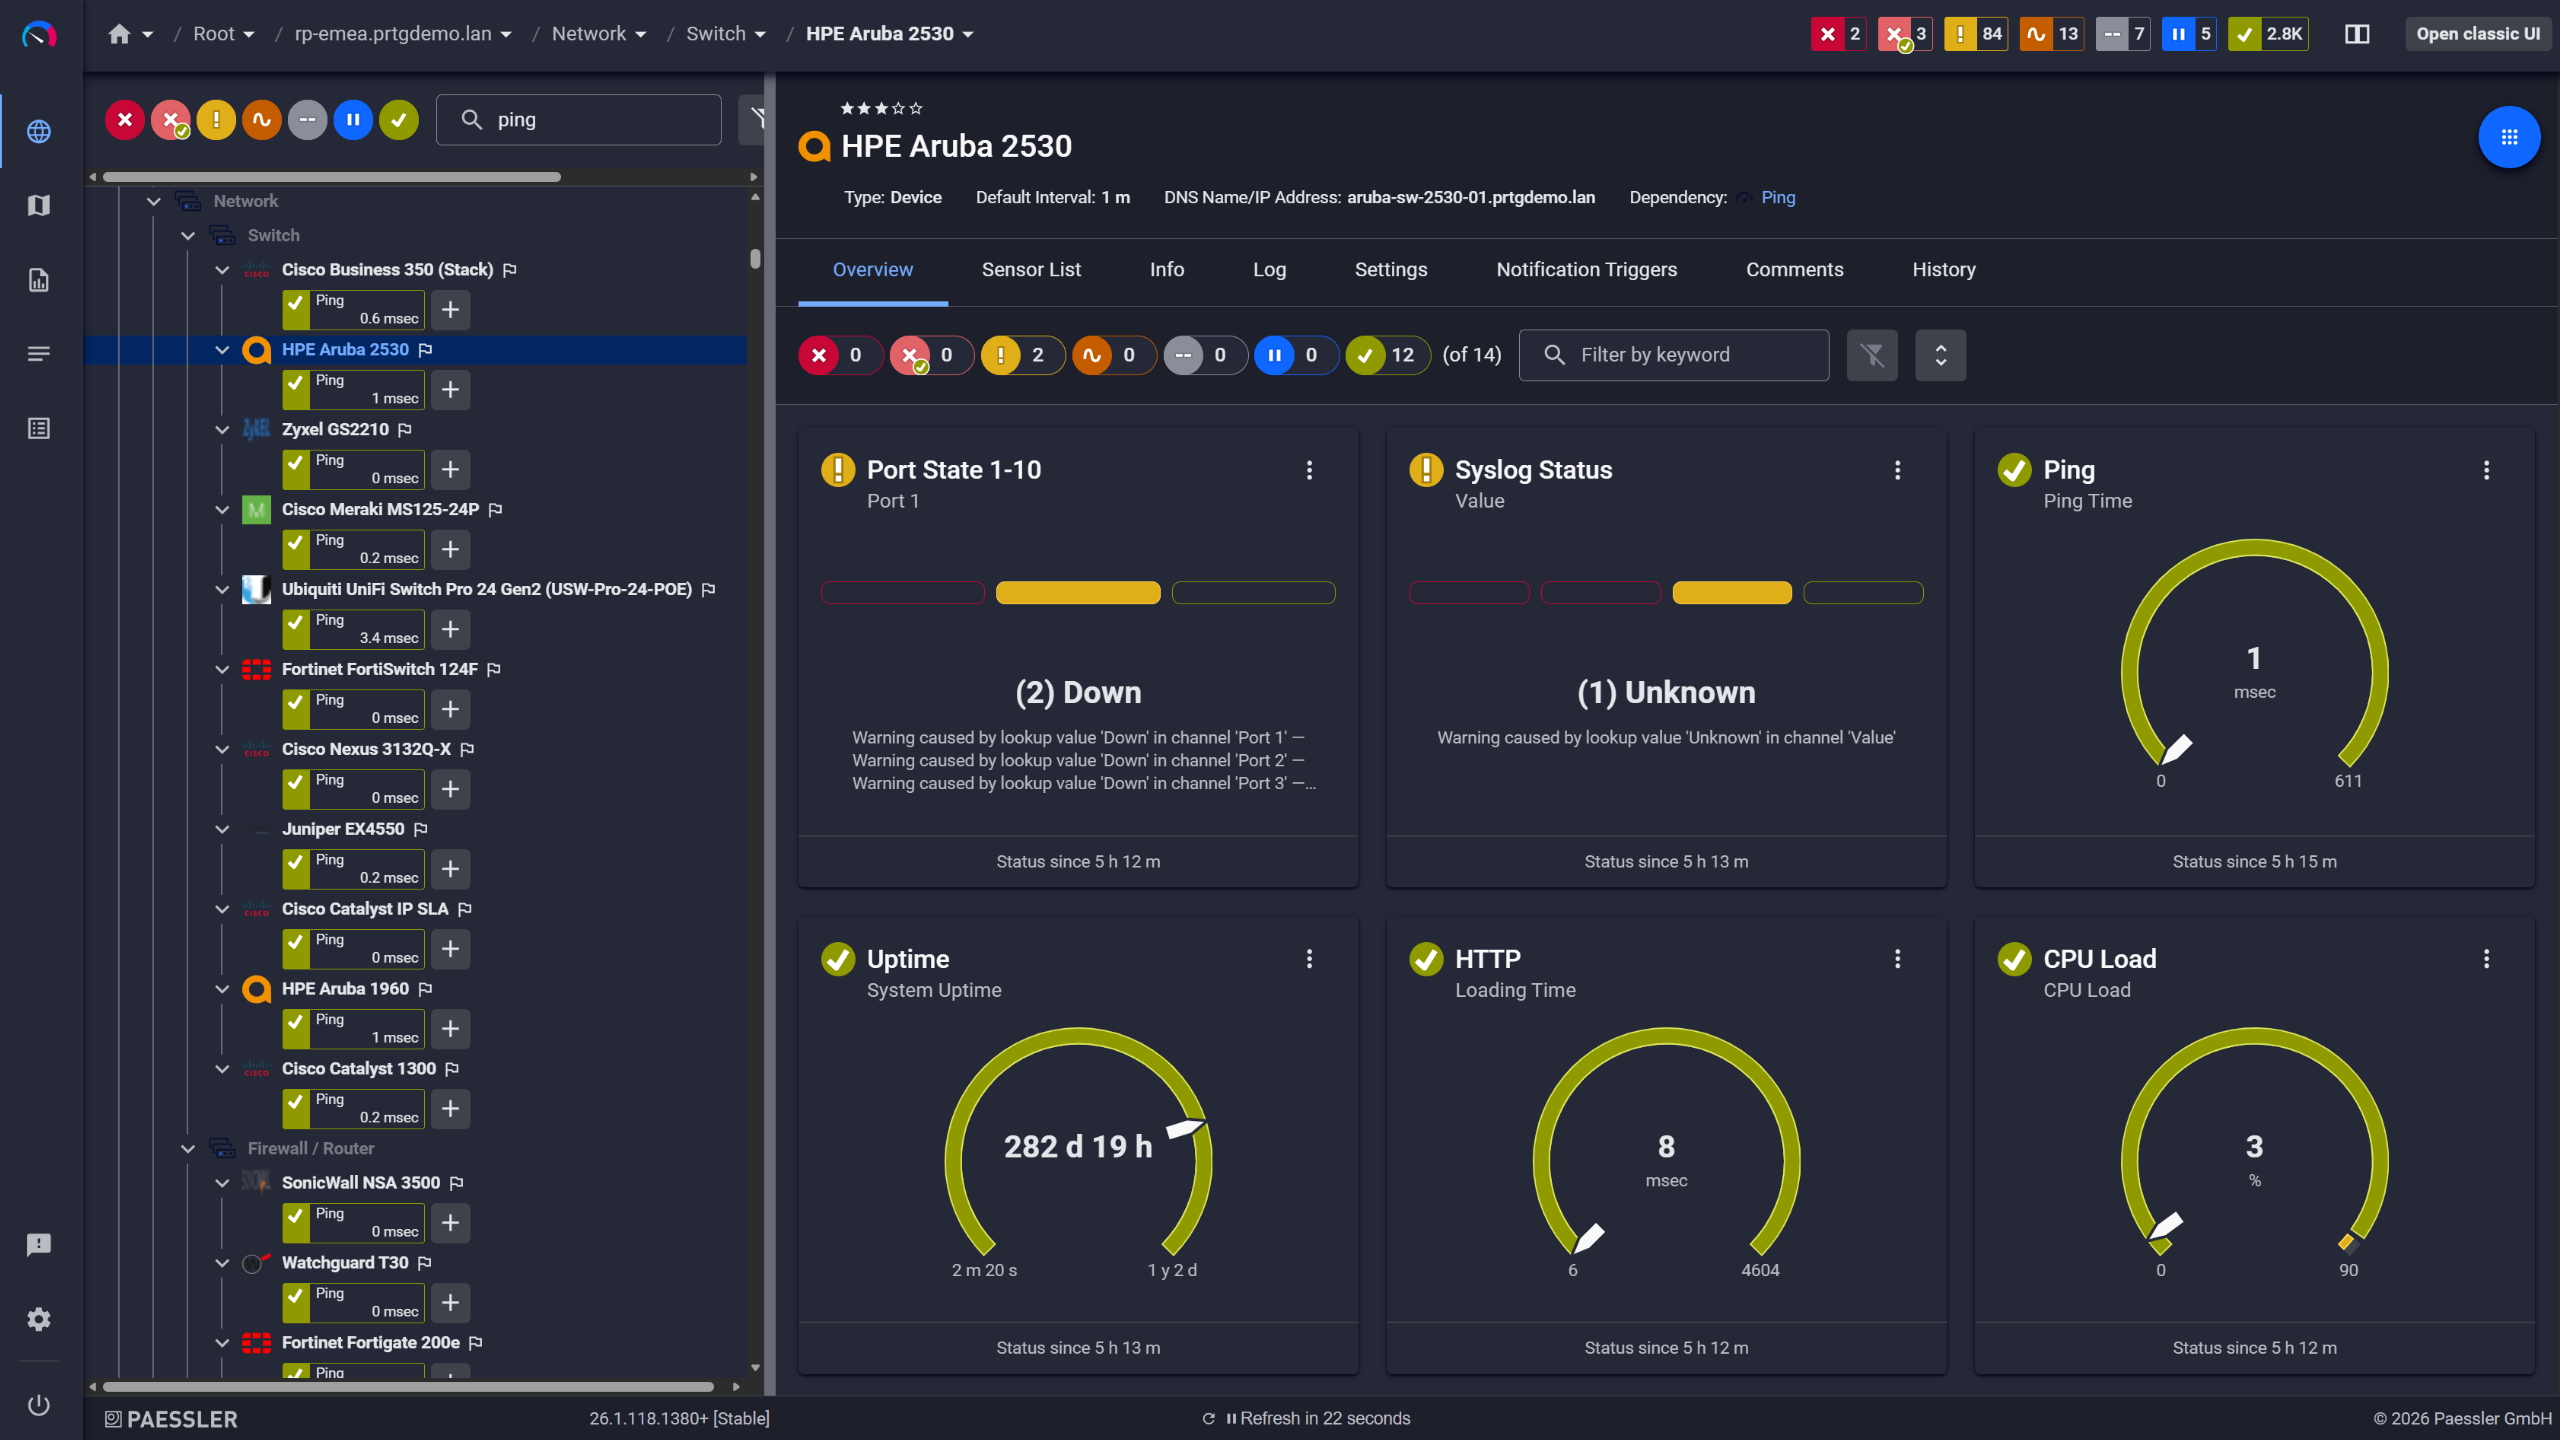
Network switches monitored across vendors

A Baseline You Can Actually Point To

Threshold alerting only works if you know what normal looks like first. That's what the historical reports are for. 

PRTG builds a performance record from the moment monitoring starts. Compare utilization and response times across weeks, identify what normal looks like for each link and device, then set thresholds so PRTG notifies you when values go outside the limits you define. There's no automatic anomaly detection. You set the thresholds based on what you know about your environment. Was network speed always this low on that WAN link? Are ping times to that server creeping up since the last application rollout? The data answers those questions. Without it, they stay open.

  • Historical graphs across hours, days, weeks, and months
  • Per-interface and per-device trend visibility
  • Configurable threshold alerting via email, SMS, or push notification
  • Reports for capacity planning and management escalations
  • Per-sensor data retention with exportable data

See Why IT Professionals Trust PRTG

Start monitoring your infrastructure in minutes. No professional services, no complex configuration, no risk.

Free download
PRODUCT OVERVIEW

All Your Network Performance Data in One Place 

Having ping, flow data, interface counters, and browser-based speed results on the same timeline makes a real difference. When every data source shares one view, you stop switching between tools and start seeing connections directly. 

PRTG brings all of these methods into one interface. All sensor data shares the same timeline, stored historically and visualized together. What used to require multiple tools is one dashboard. The correlation that previously happened in your head now happens on screen. 

  • ICMP, SNMP, Flow (NetFlow, IPFIX, sFlow, jFlow), WMI, HTTP, and packet sniffing, all in one platform
  • Unified timeline across all monitoring methods
  • No manual data export or cross-tool comparison needed
  • More than 250 preconfigured sensor types, no scripting required for standard network testing setups
  • Auto-discovery to get devices into monitoring quickly
PRTG reports list showing scheduled monitoring reports with run times and sensor counts

Scheduled reports, always on time

PRTG sunburst chart visualizing the full network hierarchy with color-coded sensor status

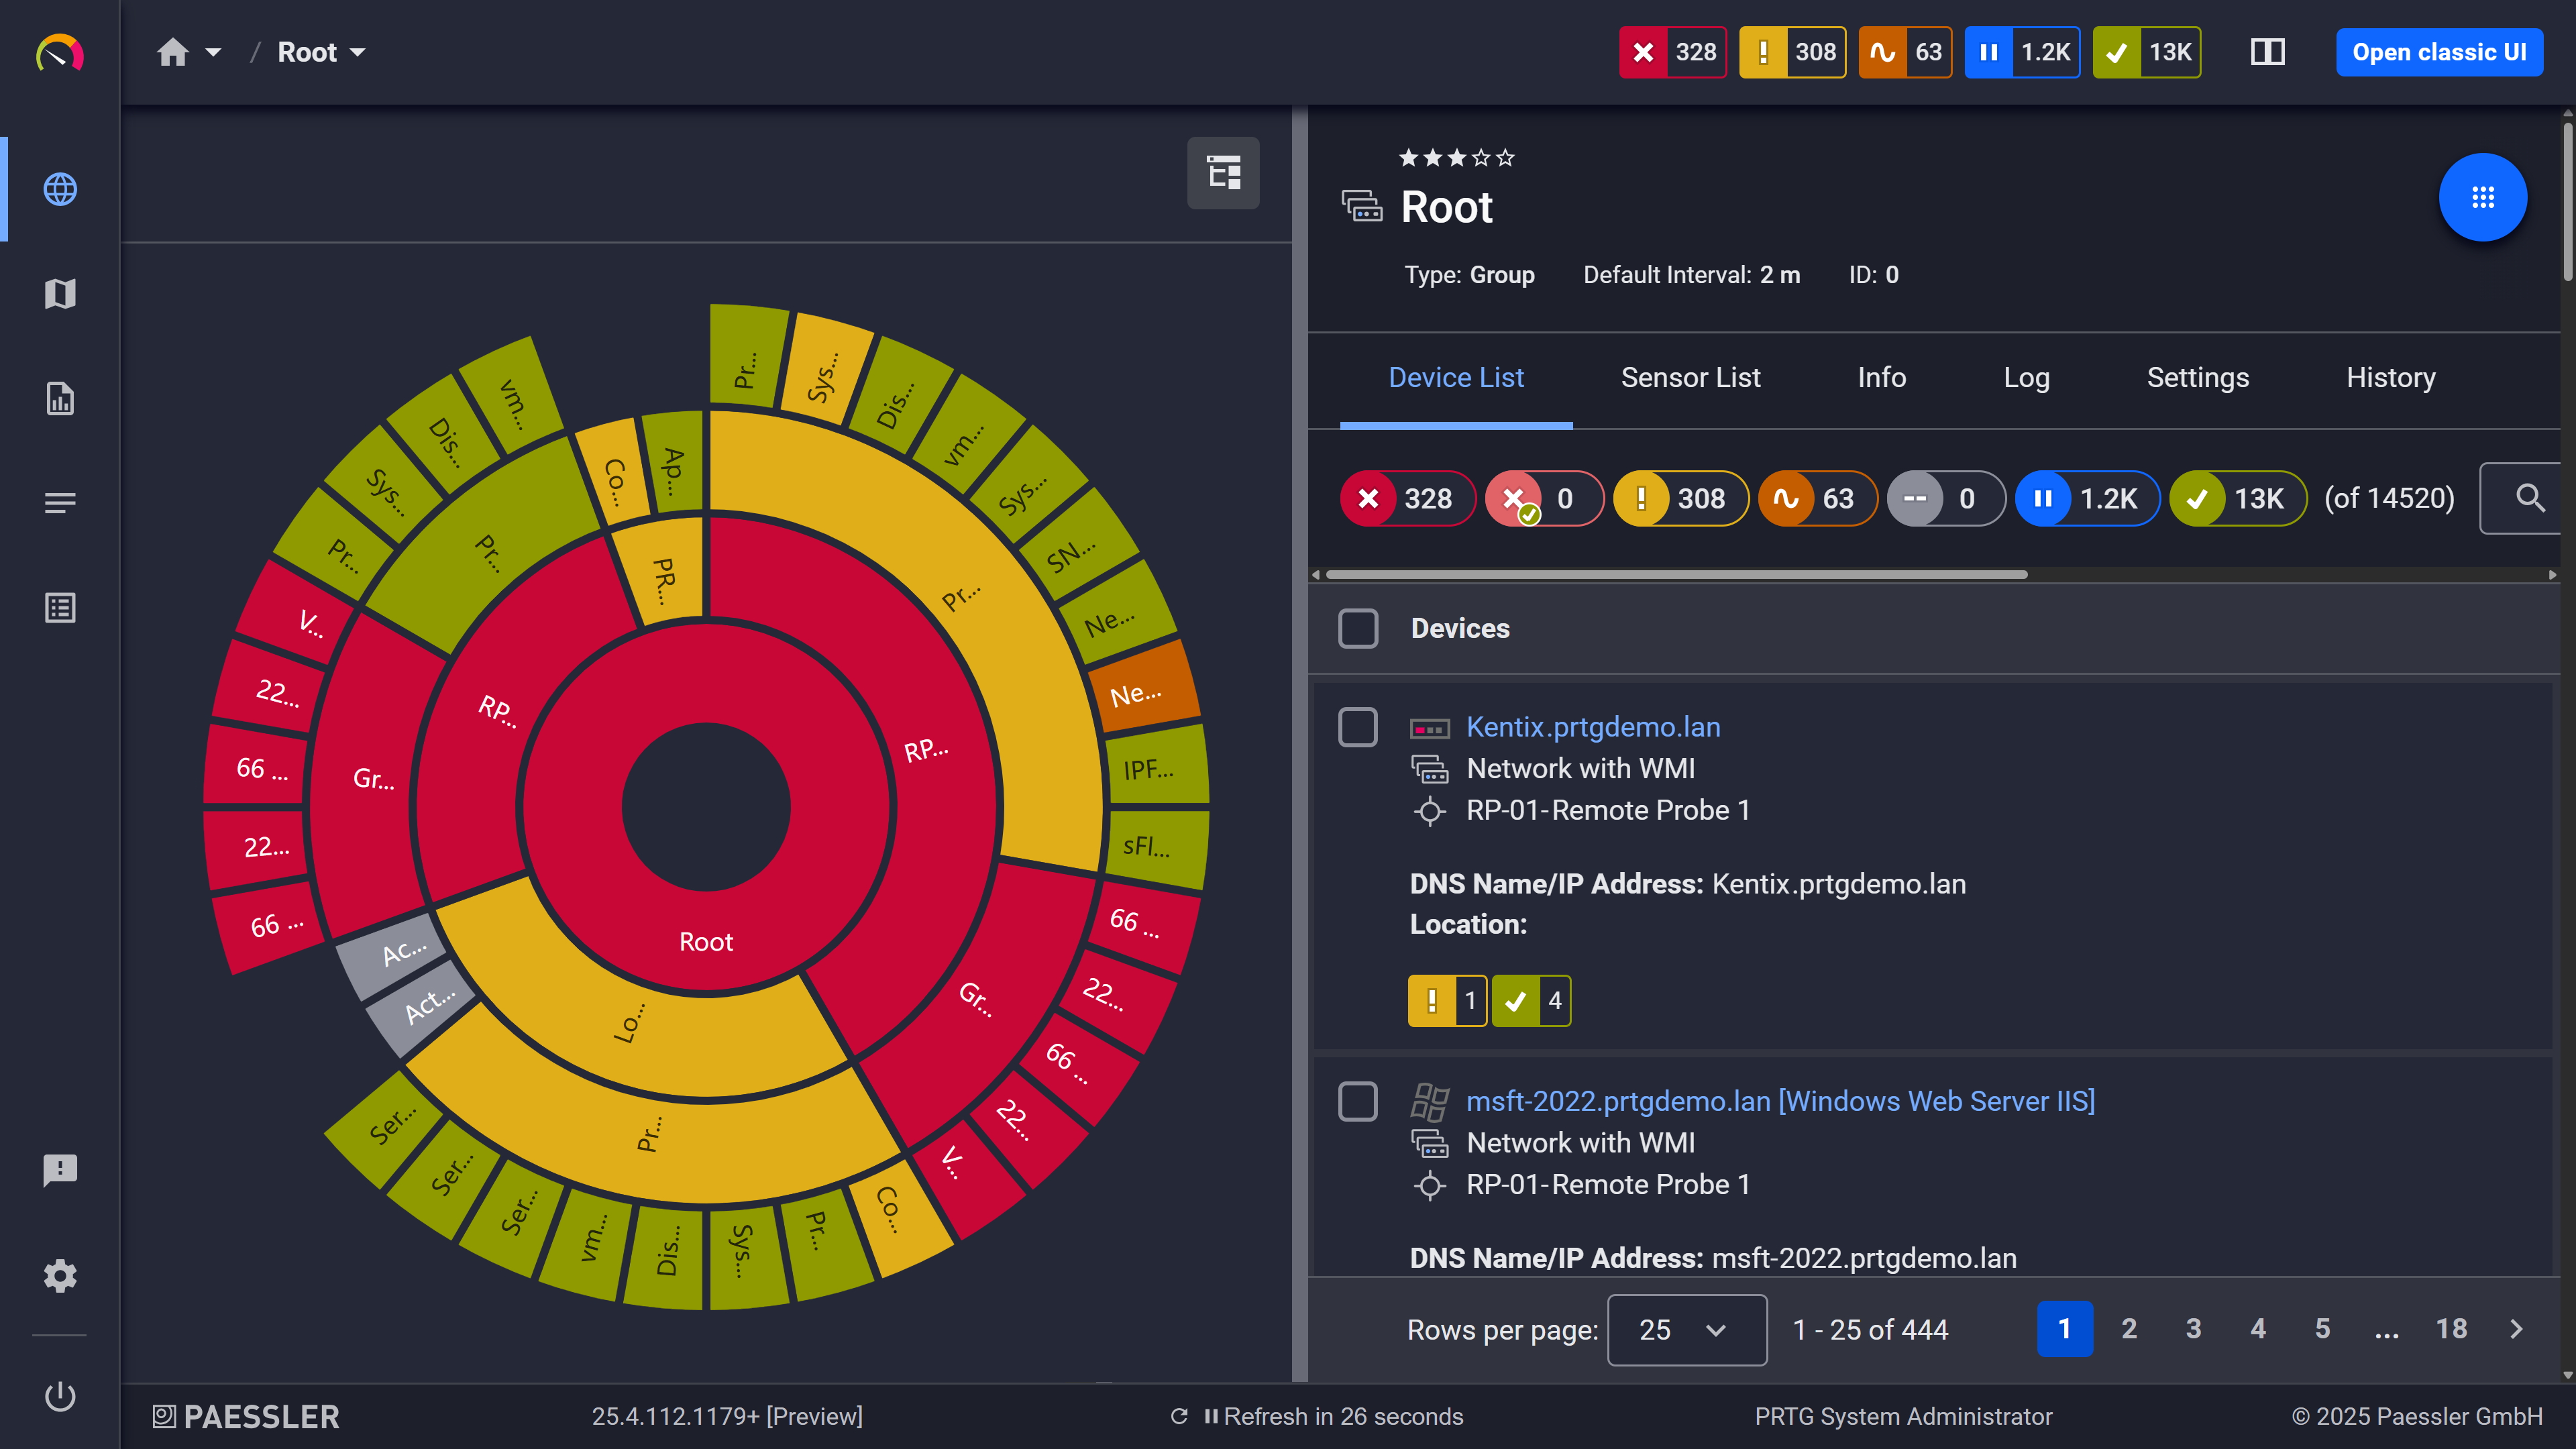
Your entire network, visualized instantly

PRTG web interface showing device tree and full device list with sensor status badges

Full device list, instant overview

Branch Site Visibility, Straight From HQ 

A remote site reports degraded connectivity. You can't immediately tell whether the problem is local (a switch, an access point, an overloaded server) or whether it's the WAN link between the sites reaching capacity. 

PRTG's remote probe architecture puts a Windows-based remote probe at each site, monitoring local devices independently and reporting to the central PRTG instance. With QoS Round Trip sensors configured between probe endpoints, you get continuous latency, jitter, and packet loss data for that path. One important note: PRTG monitors between your probe endpoints. It doesn't trace every intermediate hop in the ISP routing path. For hop-by-hop path analysis, a dedicated path-tracing tool is the right choice.

  • Remote probe deployment per site (Windows-based)
  • Site-to-site path monitoring via QoS Round Trip sensors (latency, jitter, packet loss)
  • Local device monitoring at each site: routers, switches, access points
  • WAN interface utilization via SNMP, per-site and per-link
  • Alerts on WAN saturation, high latency, or path quality degradation

How PRTG Monitors Network Performance 

PRTG uses several complementary methods to collect performance data. The right combination depends on what your devices support and what you need to measure. Most environments use more than one of these at the same time.

ICMP / Ping Monitoring 

The Ping v2 sensor sends ICMP echo requests at configurable intervals and returns response time, packet loss percentage, and min/max ping times. It covers availability, uptime, and basic latency tracking for any IP address or hostname reachable on the network.  

For jitter measurement over ICMP, the Ping Jitter sensor is a separate sensor that sends a series of ICMP echo requests to a target and calculates statistical jitter from the response variance. If you need both latency and jitter data from ICMP, deploy both sensors. They serve distinct purposes.  

Coverage limit: ICMP tells you whether a device responds and how quickly. It doesn't show what's happening on the device's interfaces.

SNMP Traffic Monitoring

The SNMP Traffic sensor reads interface-level MIB data from routers, switches, and firewalls via SNMP v1, v2c, or v3. Default channels include download speed and upload speed per interface (traffic in/out in Mbps or gigabit), traffic total, interface error counts (in/out), and packet discards (in/out). SNMP needs to be enabled on the target device. 

Flow Monitoring 

Flow-capable routers and switches export traffic metadata to PRTG for analysis by protocol and endpoints. Where the device exports them, traffic and application fields are included as well. The NetFlow v9 sensor, IPFIX sensor, sFlow v5 sensor, and jFlow sensor are all available with preconfigured and custom channel options.  

Flow export requires configuration on the network device itself. It doesn't work automatically on all hardware.

Path Quality Monitoring

QoS Round Trip sensor: Measures latency, jitter, packet loss, and corrupted or duplicated packets on a specific network path between two PRTG probe endpoints. The sensor sends UDP packets from a source probe to a target probe. This typically requires a PRTG remote probe installed on a Windows machine at each end of the connection you want to measure.  

Cisco IP SLA sensor: For Cisco environments, this sensor reads IP SLA measurements configured on the Cisco device via SNMP, including latency, jitter, packet loss, and MOS for VoIP paths. It's a dedicated sensor in PRTG that supports MOS (Mean Opinion Score) output for VoIP quality assessment. MOS is Cisco IP SLA-specific and is not available from the QoS Round Trip sensor.  

SNMP Cisco CBQoS sensor: Monitors class-based traffic policy data from Cisco devices, useful for traffic-shaping and QoS policy visibility.

free downLoad

Manual Network Testing vs. Continuous Monitoring with PRTG

FEATURE

Done Manually

Done Manually

With PRTG

With PRTG 

Performance data availability

Done Manually
not included

Only during active test sessions

With PRTG
included

24/7, stored for historical access

Test results for intermittent issues

Done Manually
not included

Missed if you're not testing at that moment

With PRTG
included

Captured in historical graphs regardless of when it happened

Threshold alerting

Done Manually
not included

Manual check required

With PRTG
included

Automatic, alerts sent when limits are exceeded

Data from multiple sources

Done Manually
not included

Separate tools, no shared timeline

With PRTG
included

ICMP, SNMP, Flow, WMI, all in one timestamped view

Multi-site coverage

Done Manually
not included

Requires on-site access or VPN CLI per location

With PRTG
included

Remote probes report to central PRTG instance

free downLoad

“PRTG helps us to keep control of our IT by making issues visible immediately – and everywhere. We always have an eye on the performance and availability of our IT and can react in time if any failures occur. On a long-term perspective, the monitoring data helps us with capacity planning so that we can deliver the required resources for our own systems as well as for our customers, without wasting money on unwarranted redundancies.”

Stein Erik Høybakk, Senior Network Engineer
TAFJORD

“All our production and business processes depend on SAP. But, of course, IT and production systems also play a crucial role in securing these processes. By incorporating SAP, production, and IT into one centralized monitoring system, we can quickly detect critical drops in performance and identify the causes of these issues. In fact, thanks to PRTG and itesys, this couldn’t be any easier.”

Andreas Schmidt, Senior Systems Engineer
Truma

“Any downtime could be detrimental to our customers. We also strive to provide the best possible service to our customers. PRTG allows us to see the health and performance of the network. Using these measurements we can make decisions on how to repair a piece of equipment before it fails and causes a service interruption.”

James Ott Jr., Communications System Technician and IT Administrator
Federal Radio

Paessler PRTG Network Monitor licenses & pricing

Choose the PRTG Network Monitor subscription that's best for you.

License NameLicense descriptionPriceLicense DetailsGet startedPricing Details
PRTG 500$200per month paid annuallyBuy nowBuy now

Enough to monitor multiple aspects of 50 devices

PRTG 1000$358per month paid annuallyBuy nowBuy now

Enough to monitor multiple aspects of 100 devices

PRTG 2500$742per month paid annuallyBuy nowBuy now

Enough to monitor multiple aspects of 250 devices

PRTG 5000$1,300per month paid annuallyBuy nowBuy now

Enough to monitor multiple aspects of 500 devices

PRTG 10000$1,642per month paid annuallyBuy nowBuy now

Enough to monitor multiple aspects of 1000 devices

Over 100,000 Customers Worldwide Love Paessler  

customer success stories

 Network Performance Test Tool: Frequently Asked Questions


What's the difference between a network performance test and continuous network monitoring?

The main difference is time coverage. On-demand network testing tools (a CLI ping, iPerf, an Ookla speed test) tell you what conditions look like during the test. That's it. PRTG polls at regular intervals and stores every result, so you have a historical record you can go back to even for events that happened days ago. Point-in-time testing is useful for capacity validation or benchmarking. Continuous monitoring is what you need for troubleshooting, identifying bottlenecks, baselining, and ongoing visibility.

What network performance metrics does PRTG track?

Latency, packet loss, jitter, download speed and upload speed per interface (Mbps/Gbps), traffic volume by protocol, interface error rates, and HTTP response times. Here's how those metrics map to sensors:  

  • Ping v2 sensor: response time, packet loss, min/max ping times  
  • Ping Jitter sensor: ICMP-based jitter  
  • SNMP Traffic sensor: interface download speed and upload speed (Mbps in/out), error counts, packet discards  
  • QoS Round Trip sensor: path-level latency, jitter, packet loss between two probe endpoints  
  • Flow sensors (NetFlow v9, IPFIX, sFlow v5, jFlow): traffic volume and protocol/endpoint breakdown 
How does PRTG measure bandwidth without disrupting production traffic?

None of PRTG's standard network performance methods generate traffic. SNMP polling reads MIB counters directly from the device. Flow monitoring receives metadata that your router or switch exports passively. Packet sniffing reads headers of packets passing the local network adapter, read-only. No active load is added to the network by any of these methods. Worth noting if you're already planning to use flow: enabling export on the device side does add a small processing overhead there, but that's a device-level configuration, not something PRTG introduces.

How does PRTG differ from tools like iPerf for network performance testing?

iPerf is an open-source tool that generates active TCP or UDP traffic for load testing scenarios or to measure maximum throughput on a link. You run it when you need to know what a link can actually handle under load. It runs on Linux, Windows, and macOS, and Android and iOS apps are available as well. PRTG does something different: it monitors real traffic behavior over time and stores the test results passively. They're complementary. iPerf answers "what's the ceiling?" and PRTG answers "what's actually happening, and what was happening yesterday?"

Can PRTG monitor performance to external endpoints and internet connections?

Yes, within scope. The HTTP v2 sensor measures response times and availability for internal and external URLs. The Cloud HTTP v2 sensor checks external endpoints from PRTG Cloud locations distributed across four continents. The Ping v2 sensor can target any IP address, including your ISP gateway, which makes it useful for spotting high latency or packet loss on the path to the internet.  

Unlike a one-time internet speed test, PRTG monitors these endpoints continuously and stores every result, so you can see whether a slowdown is a recurring pattern or an isolated event.  

What PRTG doesn't do: full ISP path tracing or intermediate hop analysis. It tests reachability and response time to the endpoints you define. For hop-by-hop path analysis, a dedicated traceroute or path-tracing tool is the right choice.

What protocols does PRTG use for network performance monitoring?

ICMP, SNMP v1/v2c/v3, NetFlow, IPFIX, sFlow, jFlow, TCP, WMI, and packet sniffing. No proprietary agent is required for SNMP- or flow-capable devices.

Does PRTG monitor Wi-Fi network performance?

PRTG monitors the network-facing side of your wireless infrastructure: traffic volume, error rates, and availability from SNMP-capable access points. Client-side wireless metrics are a different story. RF signal strength, air quality, per-client WLAN data — those require dedicated wireless LAN tools. If you need visibility into both, PRTG and a WLAN-specific tool cover different layers and don't really overlap.

How long does it take to start getting network performance data with PRTG?

Auto-discovery scans an IP range and adds reachable devices by IP address automatically. It works best for devices in the same network segment as the probe. With more than 250 preconfigured sensor types, standard ICMP and SNMP monitoring starts without any scripting, and time to first data is typically minutes after installation.  

Flow monitoring and QoS path monitoring take longer: flow requires configuration on the network device, and QoS Round Trip monitoring requires a remote probe at each measurement endpoint. For basic availability and interface monitoring, you're up and running quickly.

Paessler PRTG

Paessler PRTG

Network Monitoring Software – Version 26.1.116.1532 (February 9th, 2026)

Hosting icon

Hosting

Download for Windows and cloud-based version PRTG Hosted Monitor available

Languages icon

Languages

English, German, Spanish, French, Portuguese, Dutch, Russian, Japanese, and Simplified Chinese

test

Monitor everything

Network devices, bandwidth, servers, applications, virtual environments, remote systems, IoT, and more

test

Pricing

Choose the PRTG Network Monitor subscription that's best for you

Discover more monitoring insights and stories

Content illustration

Powerful stories from the monitoring world

  • Easy ways to quickly test your bandwidth - Paessler Blog
  • Network observability for enhanced network performance
  • How to Measure Network Latency: A Complete Step-by-Step Guide
Support illustration

Resources to master your monitoring challenges

  • Are there any testing tools for WMI? - Paessler Helpdesk
  • PRTG Manual: HTTP API - Paessler
  • PRTG Administration Tool on PRTG Core Server Systems - Paessler
Solution illustration

Solutions for all your monitoring needs

  • Network Performance Test
  • Network Bandwidth Test
  • Network Speed Monitoring
PRTG Logo

Start Monitoring with PRTG and see how it can make your network more reliable and your job easier.

Free download
PRODUCT OVERVIEW

Products

  • Paessler PRTG
    Paessler PRTGMonitor your whole IT infrastructure
    • PRTG Network Monitor
    • PRTG Enterprise Monitor
    • PRTG Hosted Monitor
    • PRTG UVexplorer
    • PRTG extensions
      Extensions for Paessler PRTGExtend your monitoring to a new level
  • Icon Features
    FeaturesExplore all monitoring features

Monitoring with PRTG

  • Network monitoring
  • Bandwidth monitoring
  • SNMP monitoring
  • Network mapping
  • Wi-Fi monitoring
  • Server monitoring
  • Network traffic analyzer
  • NetFlow monitoring
  • Syslog server

Useful Links

  • PRTG Manual
  • Knowledge Base
  • Customer Success Stories
  • About Paessler
  • Subscribe to newsletter
  • PRTG Support
  • PRTG Consulting
  • PRTG Feedback & Roadmap

Contact

Paessler GmbH
Thurn-und-Taxis-Str. 14, 
90411 Nuremberg 
Germany

[email protected]

+49 911 93775-0

  • Contact us
©2026 Paessler GmbHTerms & ConditionsPrivacy PolicyImprintReport VulnerabilityDownload & InstallSitemap
References References References