• Company
    • About Us
    • Case Studies
    • Press Center
    • Careers
    • Blog
    • Contact us
  • Contact us
  • Login
 
  • English
    • Deutsch
    • Español
    • Français
    • Italiano
    • Português
Paessler
                    - The Monitoring Experts
  • Products
    • Paessler PRTG
      Paessler PRTGMonitor your whole IT infrastructure
      • PRTG Network Monitor
      • PRTG Enterprise Monitor
      • PRTG Hosted Monitor
      • PRTG UVexplorer
      • PRTG extensionsExtensions for Paessler PRTGExtend your monitoring to a new level
    • Icon Features
      FeaturesExplore all monitoring features
      • Maps & dashboards
      • Alerts & notifications
      • Multiple user interfaces
      • Distributed monitoring
      • Customizable reporting
  • Solutions
    • Industries
      IndustriesMonitor various industry sectors
      • Industrial
      • Healthcare
      • Data Center
      • Education
      • Finance
      • Government
    • IT Topics
      IT TopicsMonitor all areas of IT
      • Network Monitoring
      • Bandwidth Monitoring
      • SNMP Monitor
      • Network Mapping
      • WiFi Monitoring
      • Server Monitoring
  • Pricing
  • Resources
    • Getting Started
      Getting StartedModules for self-paced learning
    • How-to Guides
      How-to GuidesGet the most out of PRTG
    • Videos & Webinars
      Videos & WebinarsLearn from Paessler experts
    • IT  Knowledge
      IT KnowledgeExpand your IT knowledge
    • PRTG Manual
      PRTG ManualFull documentation
    • Knowledge Base
      Knowledge BaseShare community knowledge
    • PRTG Sensor Hub
      PRTG Sensor HubGet sensors, scripts & templates
    • Trainings
      PRTG TrainingLearn how to work with PRTG
  • Partners
    • Icon Handshake
      Become a PartnerFor resellers and channel partners
    • Icon MSP
      Become an MSPDeliver monitoring as a managed service
    • icon partner
      Partner PortalLog in to your partner account
    • Deal Registration
      Deal RegistrationRegister your sales opportunities
    • icon search
      Find a PartnerFind partners selling Paessler products
    • icon technology
      Technology AlliancesSee Paessler technology partnerships
    • Partner HubTools for Your Success
  • Company
    • About Us
    • Case Studies
    • Press Center
    • Careers
    • Blog
    • Contact us
  • Contact us
  • Login
  • English
    • Deutsch
    • Español
    • Français
    • Italiano
    • Português
  • Get a quote
  • Free trial

Unified Network Management Software  

Monitor every network device, diagnose network performance issues fast, and keep your infrastructure running

Free download
PRODUCT OVERVIEW

What Should Network Management Software Actually Do for Your IT Team? 

Managing a network means keeping track of availability, performance, traffic, and device health across hardware from different vendors, running different protocols, spread across different locations. Most IT teams deal with that using a mix of tools, each covering one piece. The gaps between them are where problems hide.  

Paessler PRTG consolidates that into one interface, using SNMP, WMI, SSH, NetFlow, and other standard protocols to collect metrics continuously, with no agents required for most device types. Auto-Discovery scans your network on first run and keeps your device list current as new devices are added.  
PRTG covers routers, switches, firewalls, servers, endpoints, wireless access points, and virtual machines across Cisco, Juniper, HP, Dell, Microsoft, and Linux/Unix environments, whether on-premises, in VMware or Hyper-V, or connected to cloud services. For devices outside standard protocol support, the PRTG Sensor Hub provides additional community-built and vendor-specific sensors. 

Download PRTG Trial

What you will find on this page

  • All You Need to Monitor a Network
  • How to Monitor Your Network
  • Manual Network Management vs. PRTG
  • FAQs

PRTG is compatible with all major vendors, products, and systems

compatible with all major vendors, products, and systems

Everything Your Team Needs to Monitor the Network

Get a Complete, Accurate View of Your Network 

Network devices get added without IT teams' involvement. Inherited environments come with zero documentation. The network diagram someone made two years ago reflects a network that no longer exists.  

PRTG’s auto-discovery scans defined IP ranges, identifies devices, and builds a structured device tree with monitoring sensors already assigned. You get an accurate, live view of what's actually on your network. Not a spreadsheet someone updated six months ago.  

  • Scans IP ranges and populates the device tree without manual entry
  • Assigns device icons and sensor templates automatically using MAC address and ARP detection (IPv4 environments only)
  • Scheduled re-discovery catches newly connected devices; run it once, hourly, daily, or weekly
  • Network maps give you a visual overview of your infrastructure, built around the devices and locations that matter most to your team
  • No scripting or coding required; core device monitoring starts from the first setup session

One tool for your entire mixed infrastructure  

Cisco switches. HP servers. Linux boxes. Microsoft environments. Each one has its own management interface, its own login, its own way of reporting network issues. You're logging into five different monitoring tools to get a picture of one network, and things still fall through the cracks.  

PRTG uses standard industry protocols to monitor any network device that supports them, regardless of vendor. Switches, routers, firewalls, servers, and endpoints all appear in a single device tree. When a switch issue cascades into a server problem, IT teams see the full chain in one place, with no context-switching between tools.  

  • Covers network hardware from Cisco, Juniper, HP, Dell, and others via standard protocols
  • Monitors Windows servers and workstations alongside Linux and Unix systems, including backup job status via WMI or script sensors (sensor setup required)
  • Tracks cloud-connected services and web apps next to on-premises infrastructure
  • All devices and statuses in one dashboard, with no separate logins needed
  • Custom sensors and REST API integration extend coverage to systems outside standard protocol support, with some configuration required
  • The PRTG Sensor Hub provides additional community-built sensors for less common device types
PRTG sunburst chart visualizing the full network hierarchy with color-coded sensor status

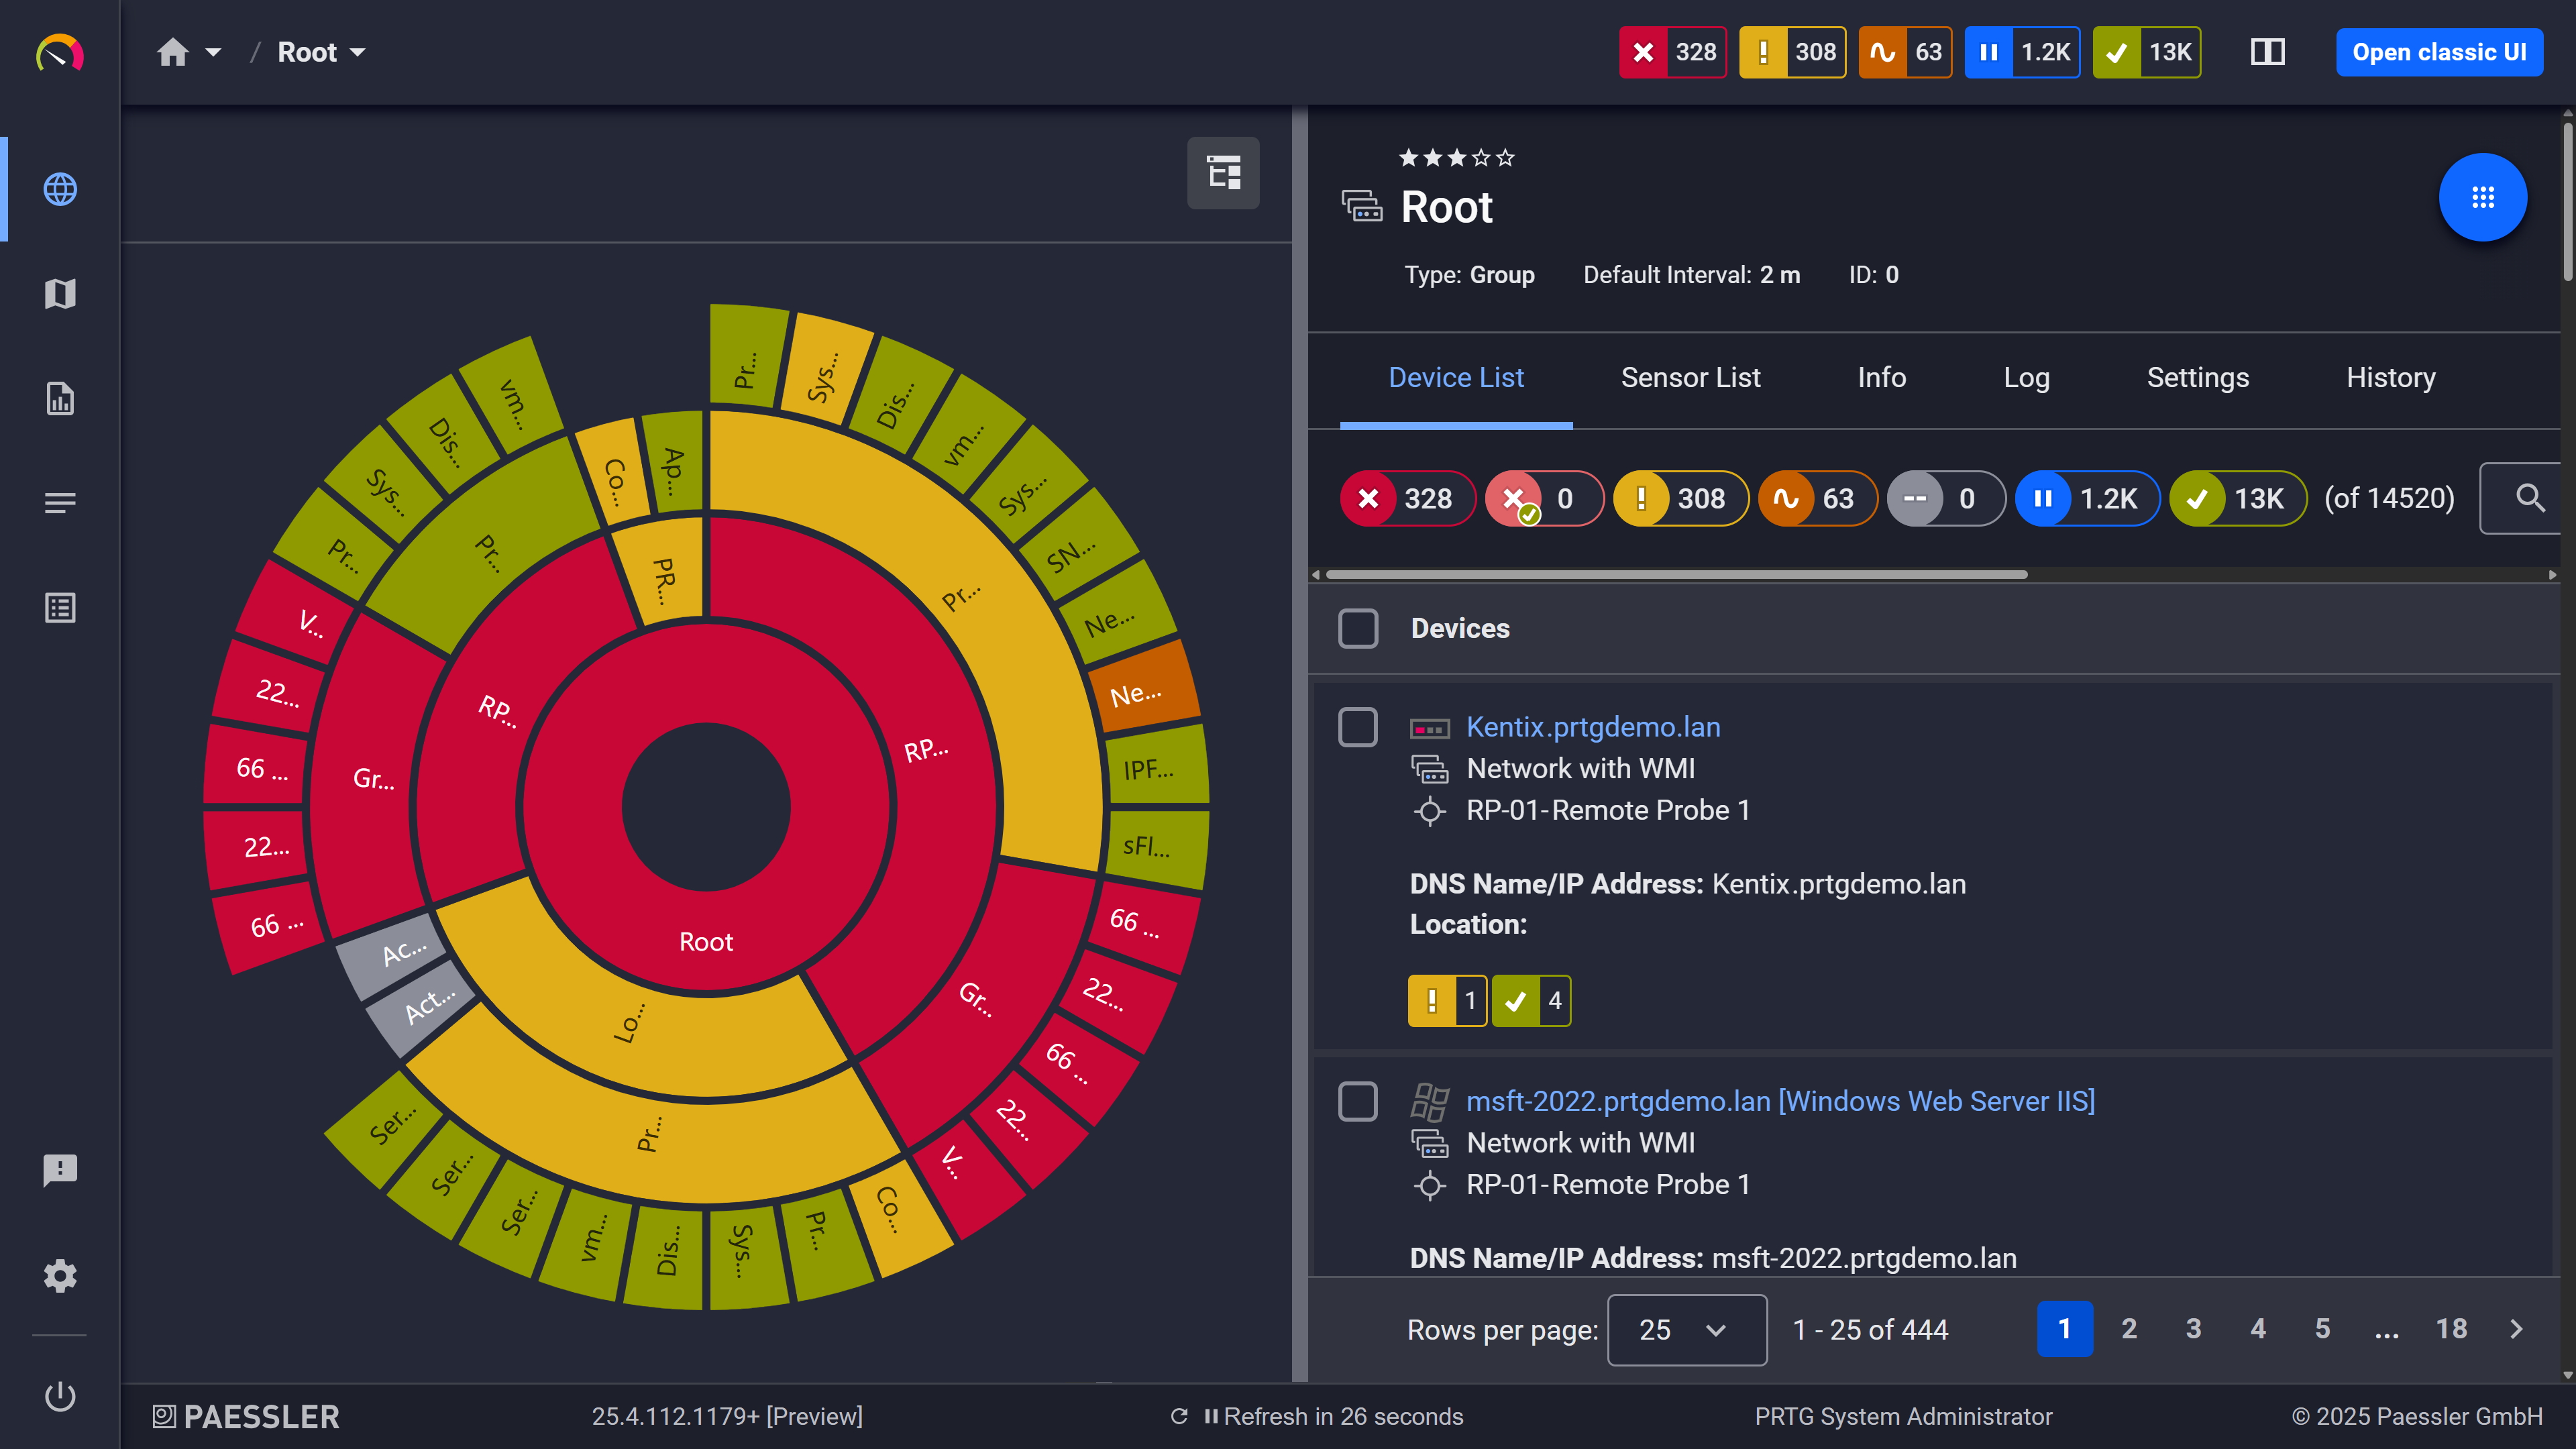
Your entire network, visualized instantly

PRTG web interface showing device tree and full device list with sensor status badges

Full device list, instant overview

PRTG device overview for an HPE Aruba 2530 switch with port state, ping, and CPU sensors

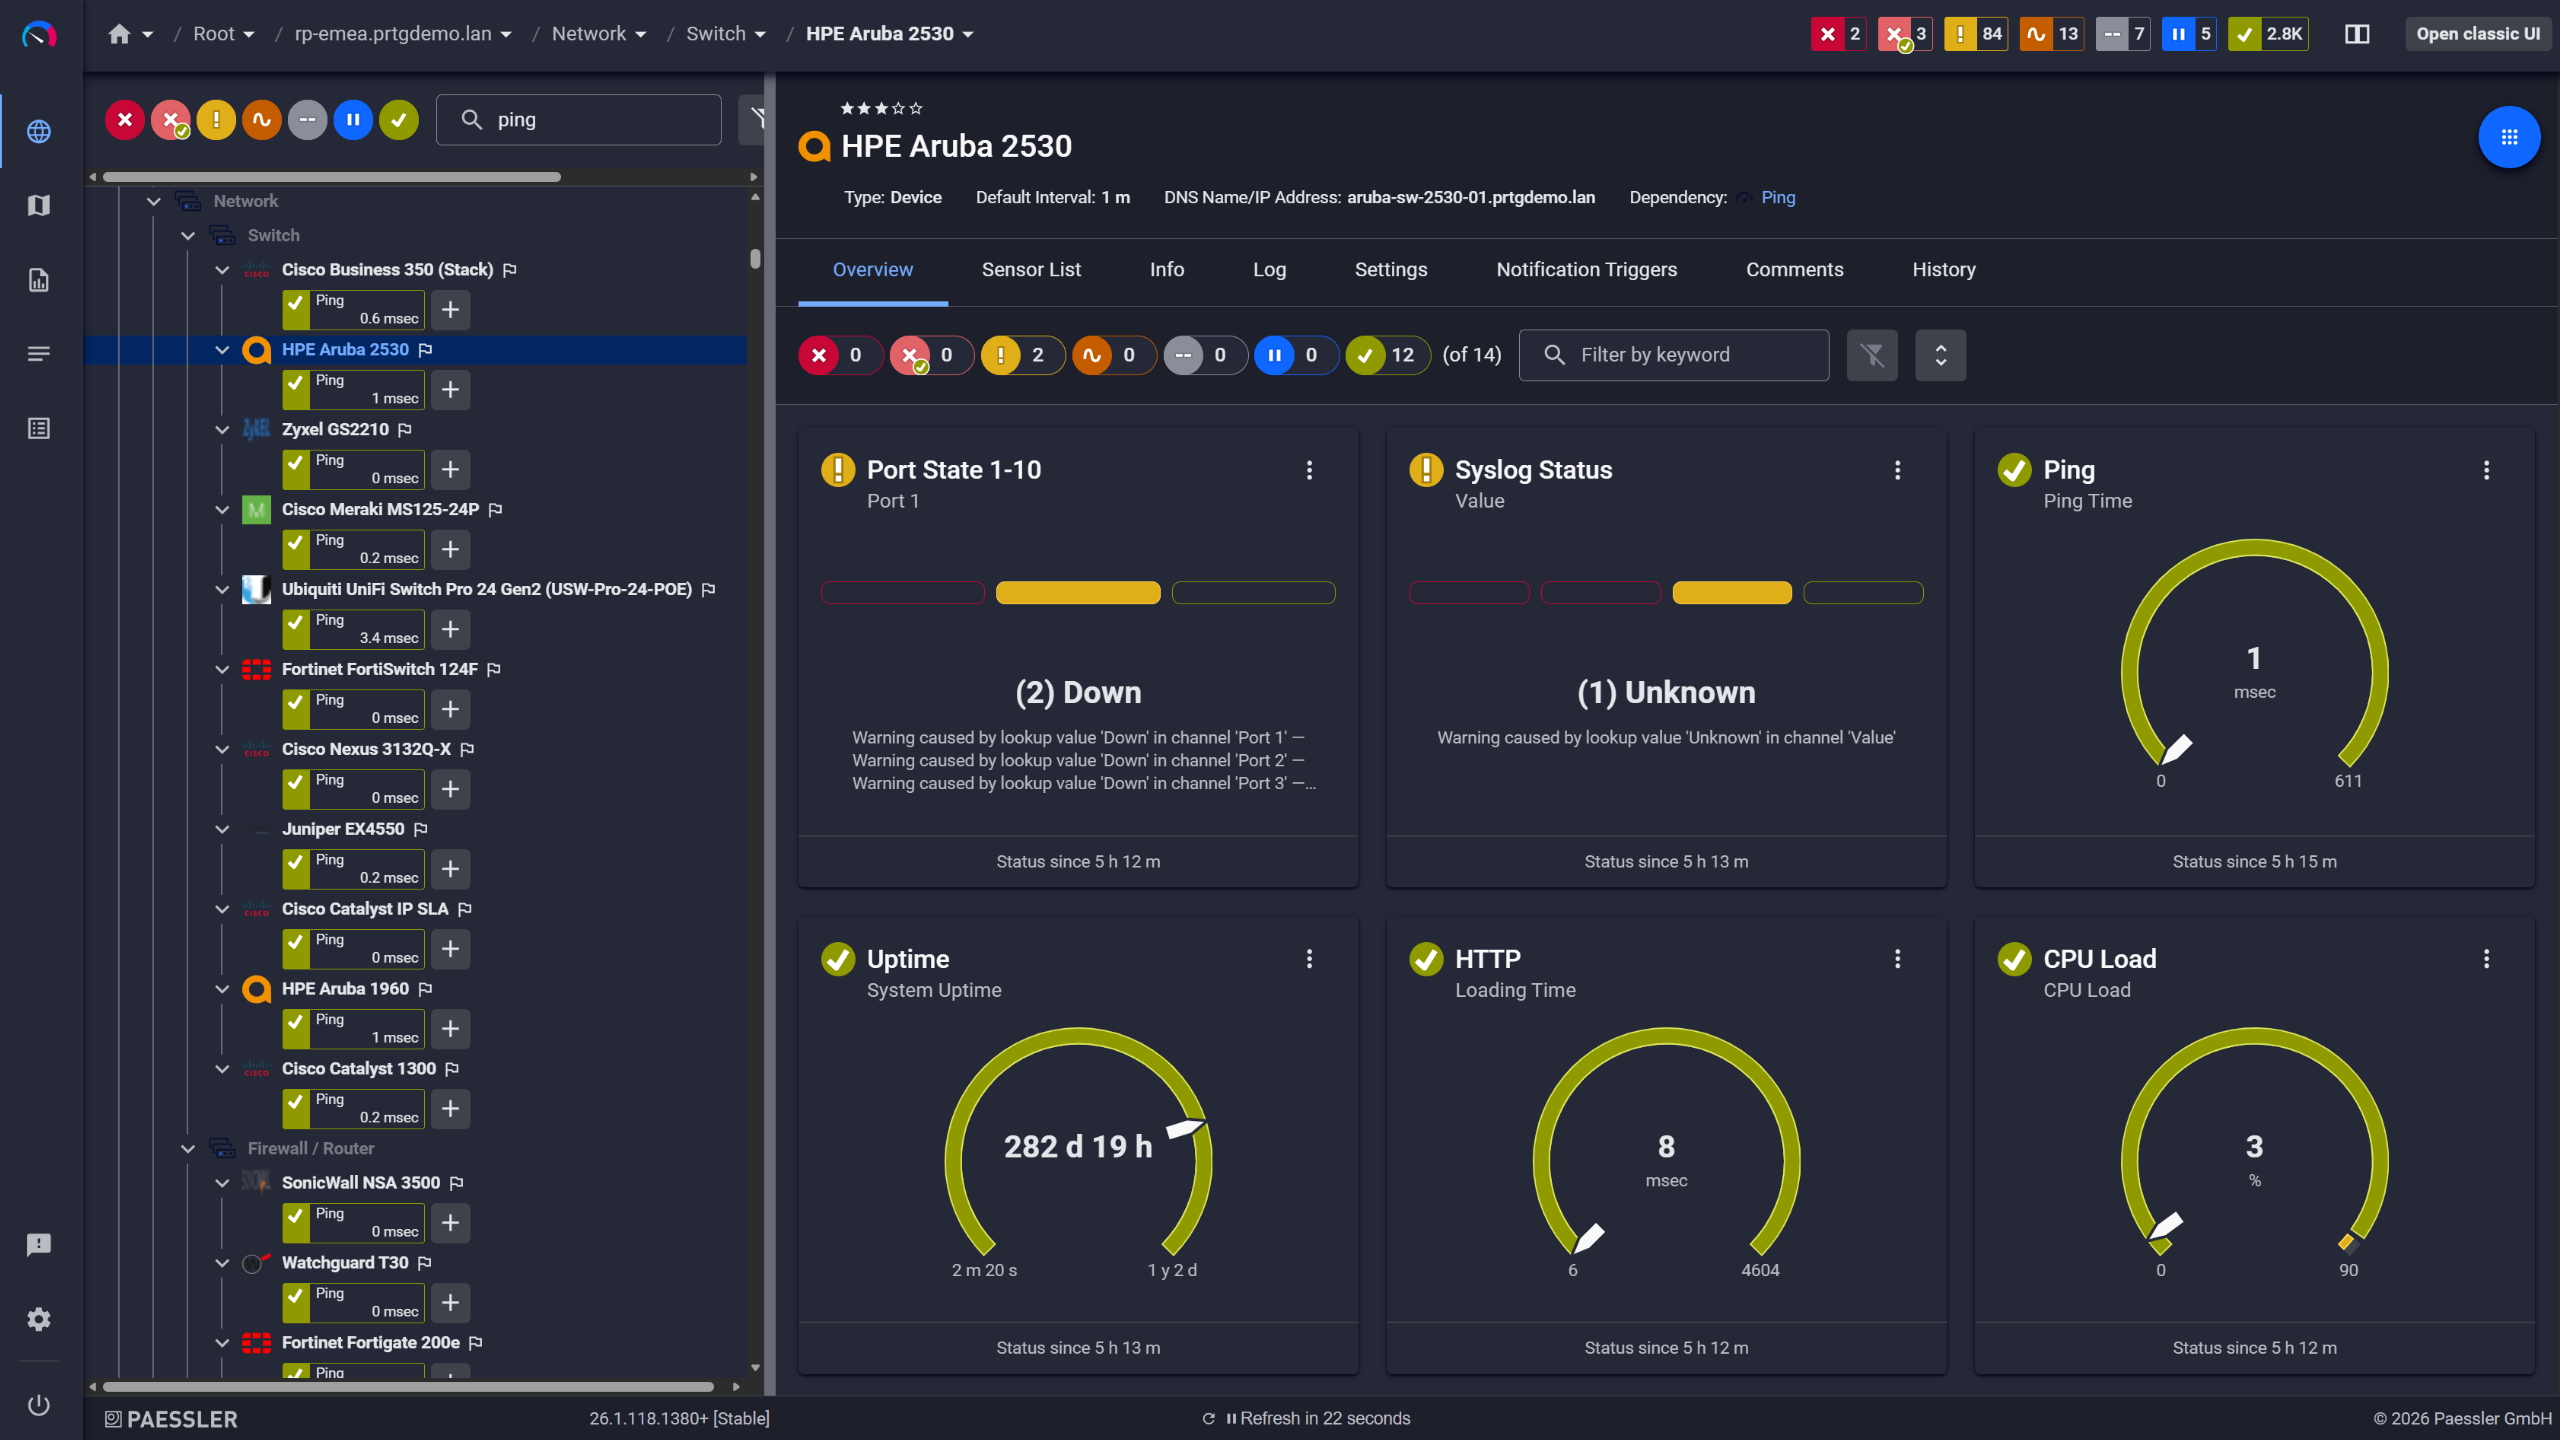
Network switches monitored across vendors

Pinpoint Bandwidth Usage in Minutes 

"The network is slow" is not a diagnosis, it’s just a statement. Without network traffic data, investigating a bandwidth usage problem means logging into router CLIs, running show commands, and manually correlating what you find, while user experience suffers and people wait for calls to stabilize and files to load.  

PRTG collects flow data exported from your routers and switches and breaks it down into Top Talkers, Top Connections, and Top Protocols views. Once flow export is configured on your network devices, you can pinpoint which device, app, or connection is saturating a link in minutes. Bandwidth complaints become diagnosable.  

  • See which specific devices, apps, and connections are driving the highest bandwidth usage
  • Historical network traffic data lets you optimize capacity planning before problems happen
  • Per-interface traffic graphs update continuously without manual scanning
  • Works alongside your existing on-premises network hardware without additional agents on monitored devices
  • For environments where flow export isn't an option, PRTG's packet sniffer captures network traffic directly via a SPAN or mirror port

Note: Flow analysis requires flow export to be enabled on the source device first, typically a few CLI commands on your router or switch. PRTG receives and processes the exported data. 

See Why IT Professionals Trust PRTG

Start monitoring your infrastructure in minutes. No professional services, no complex configuration, no risk.

Free download
PRODUCT OVERVIEW

Monitoring that works on day one, not after weeks of configuration   

Open-source monitoring tools like Zabbix are capable, but getting them running across a mixed environment takes time, and usually someone who already knows the platform well. Enterprise network monitoring software like SolarWinds or ManageEngine adds a different kind of overhead: procurement cycles, onboarding processes, and licensing structures that need to be sorted out before you've monitored a single device.  

PRTG takes a different approach. A 5-step setup wizard walks you through initial configuration. Built-in device templates handle sensor selection for common hardware automatically. For standard scenarios such as availability, network performance monitoring, and network traffic, there's no coding involved. Core monitoring is running the same day you install.  

5-step setup wizard covers initial configuration without requiring prior PRTG knowledge  

Built-in device templates automatically select the right sensors for Cisco, Dell, HP, and other common hardware  

No scripting or coding required for standard IT management workflows  

PRTG freeware gives you 100 sensors permanently free; after a 30-day trial, no license key required to continue  

PRTG scales from a single site to distributed multi-site environments without re-architecting your setup 

PRTG Map Designer showing a custom network map with live device status and vendor icons

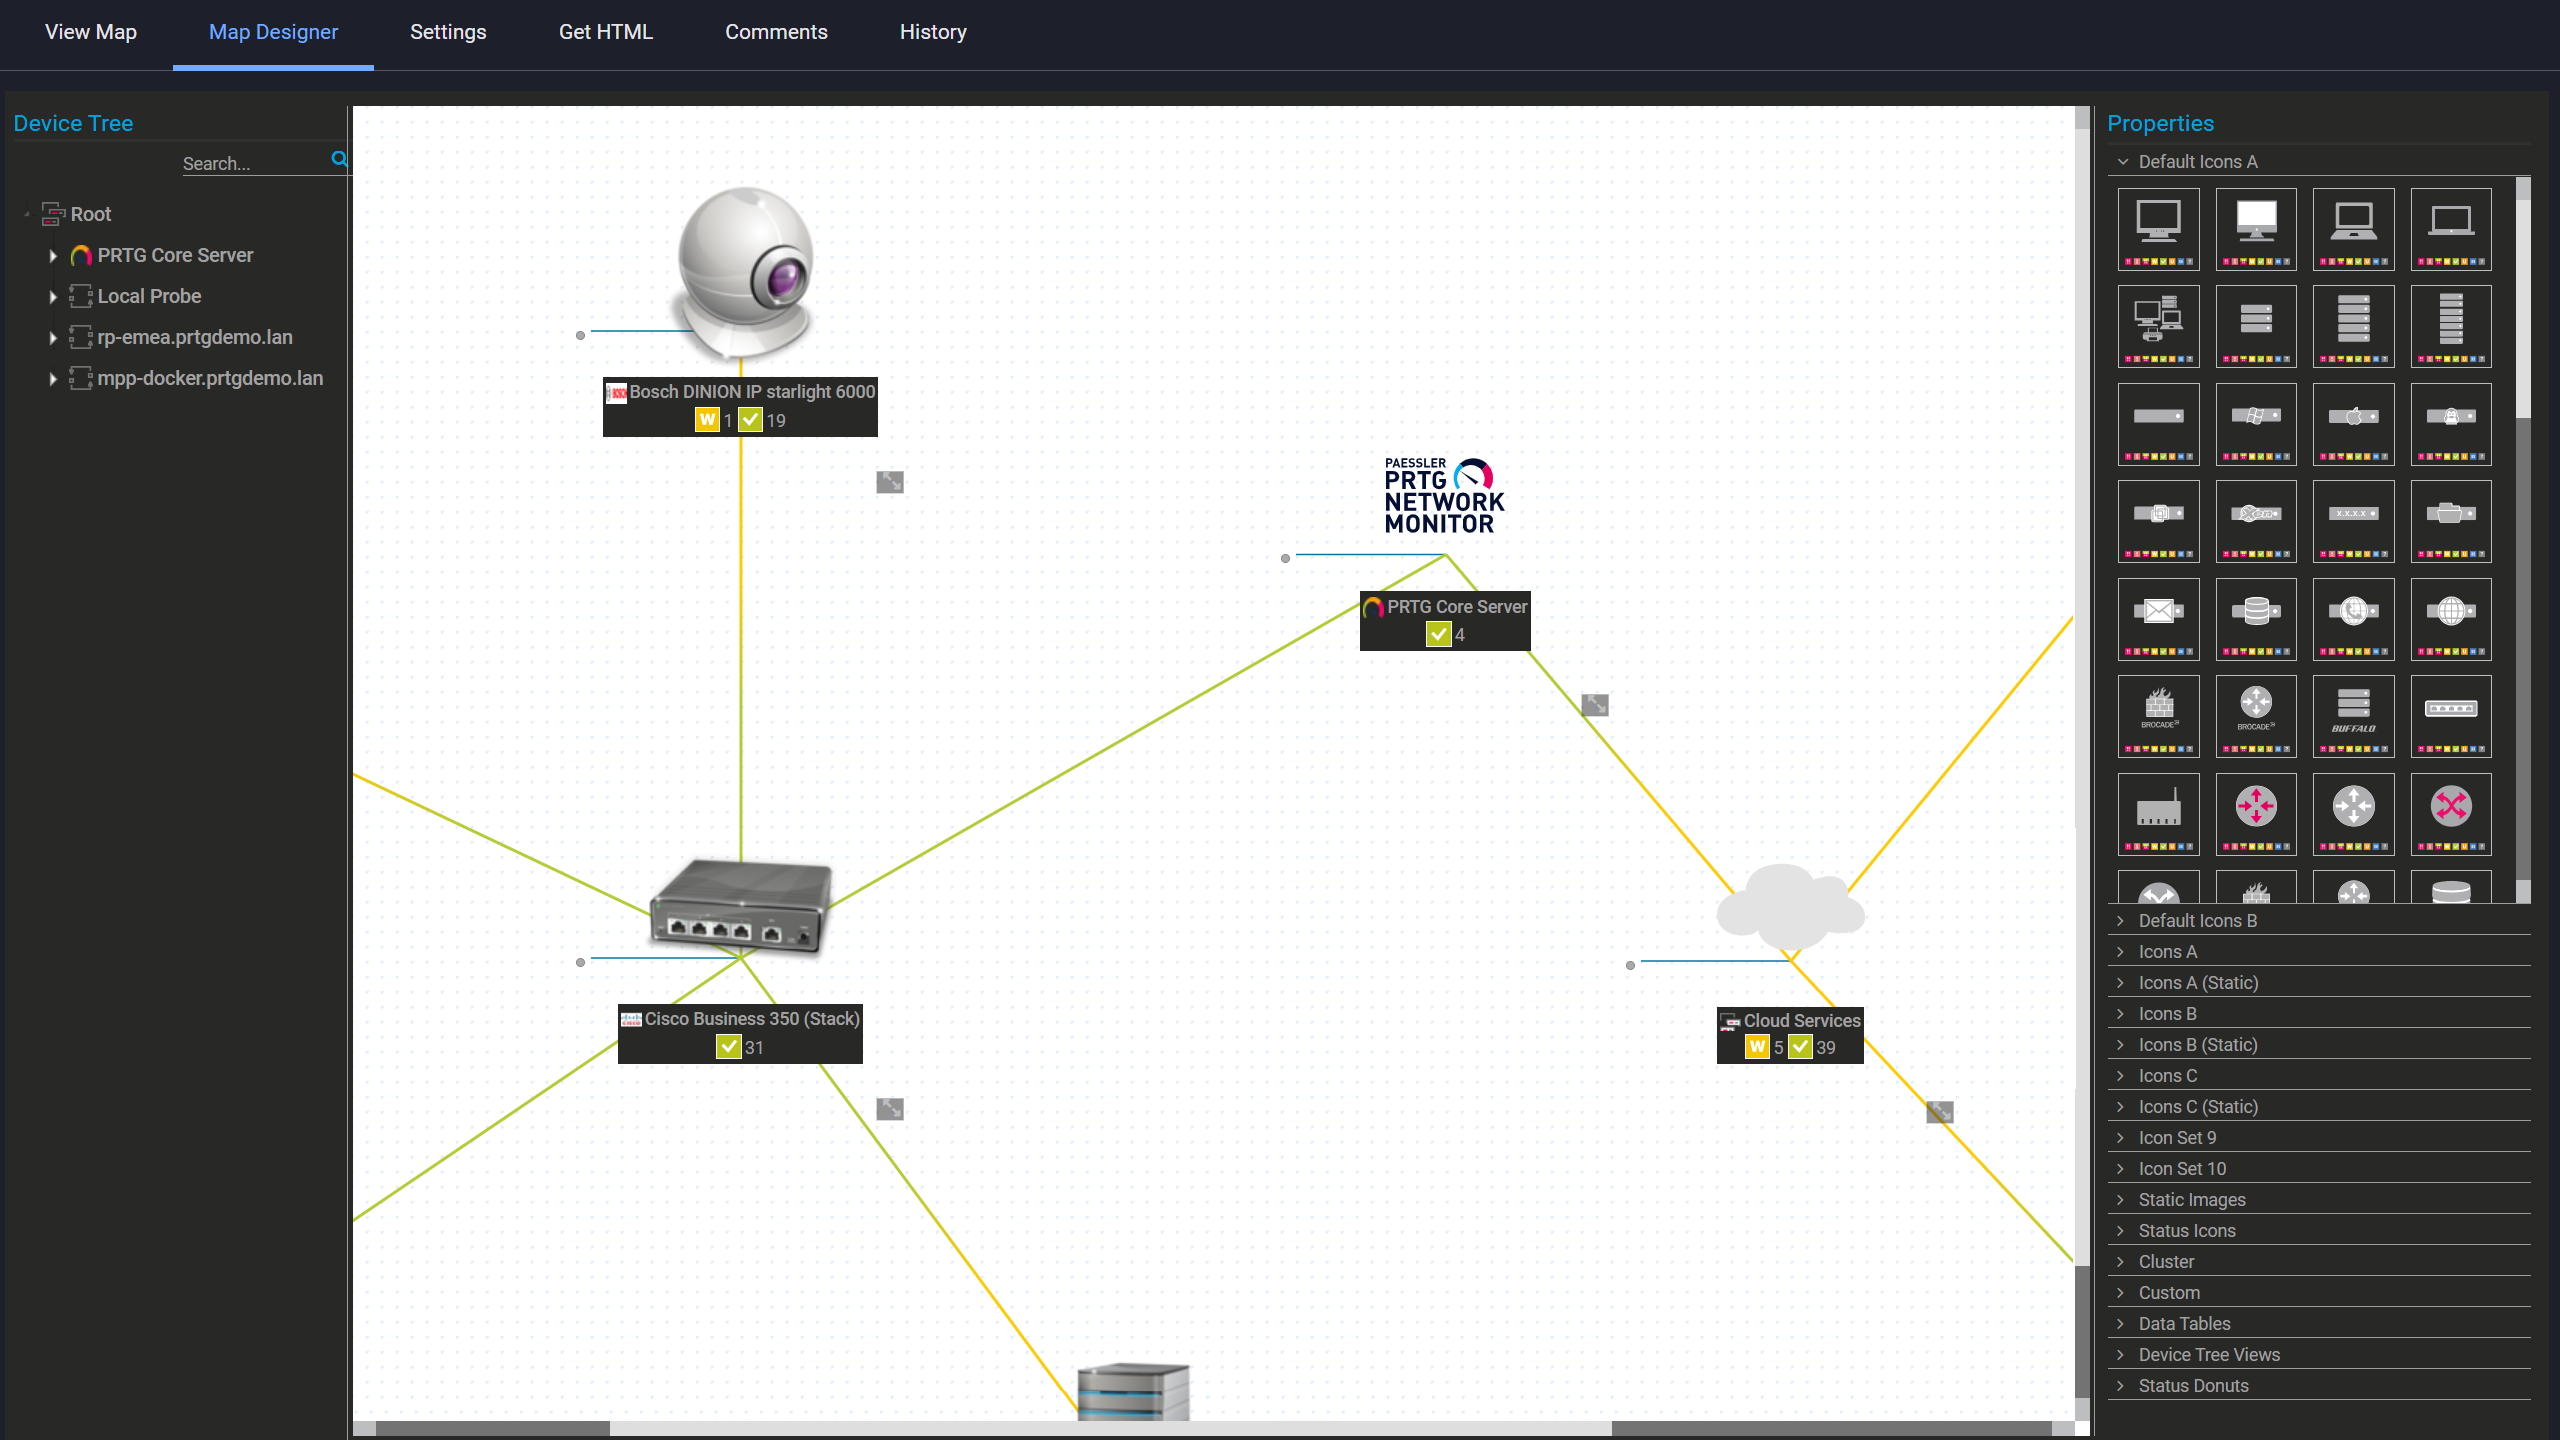
Custom maps with live status

PRTG reports list showing scheduled monitoring reports with run times and sensor counts

Scheduled reports, always on time

PRTG home screen showing feature highlight cards including mobile interface and API

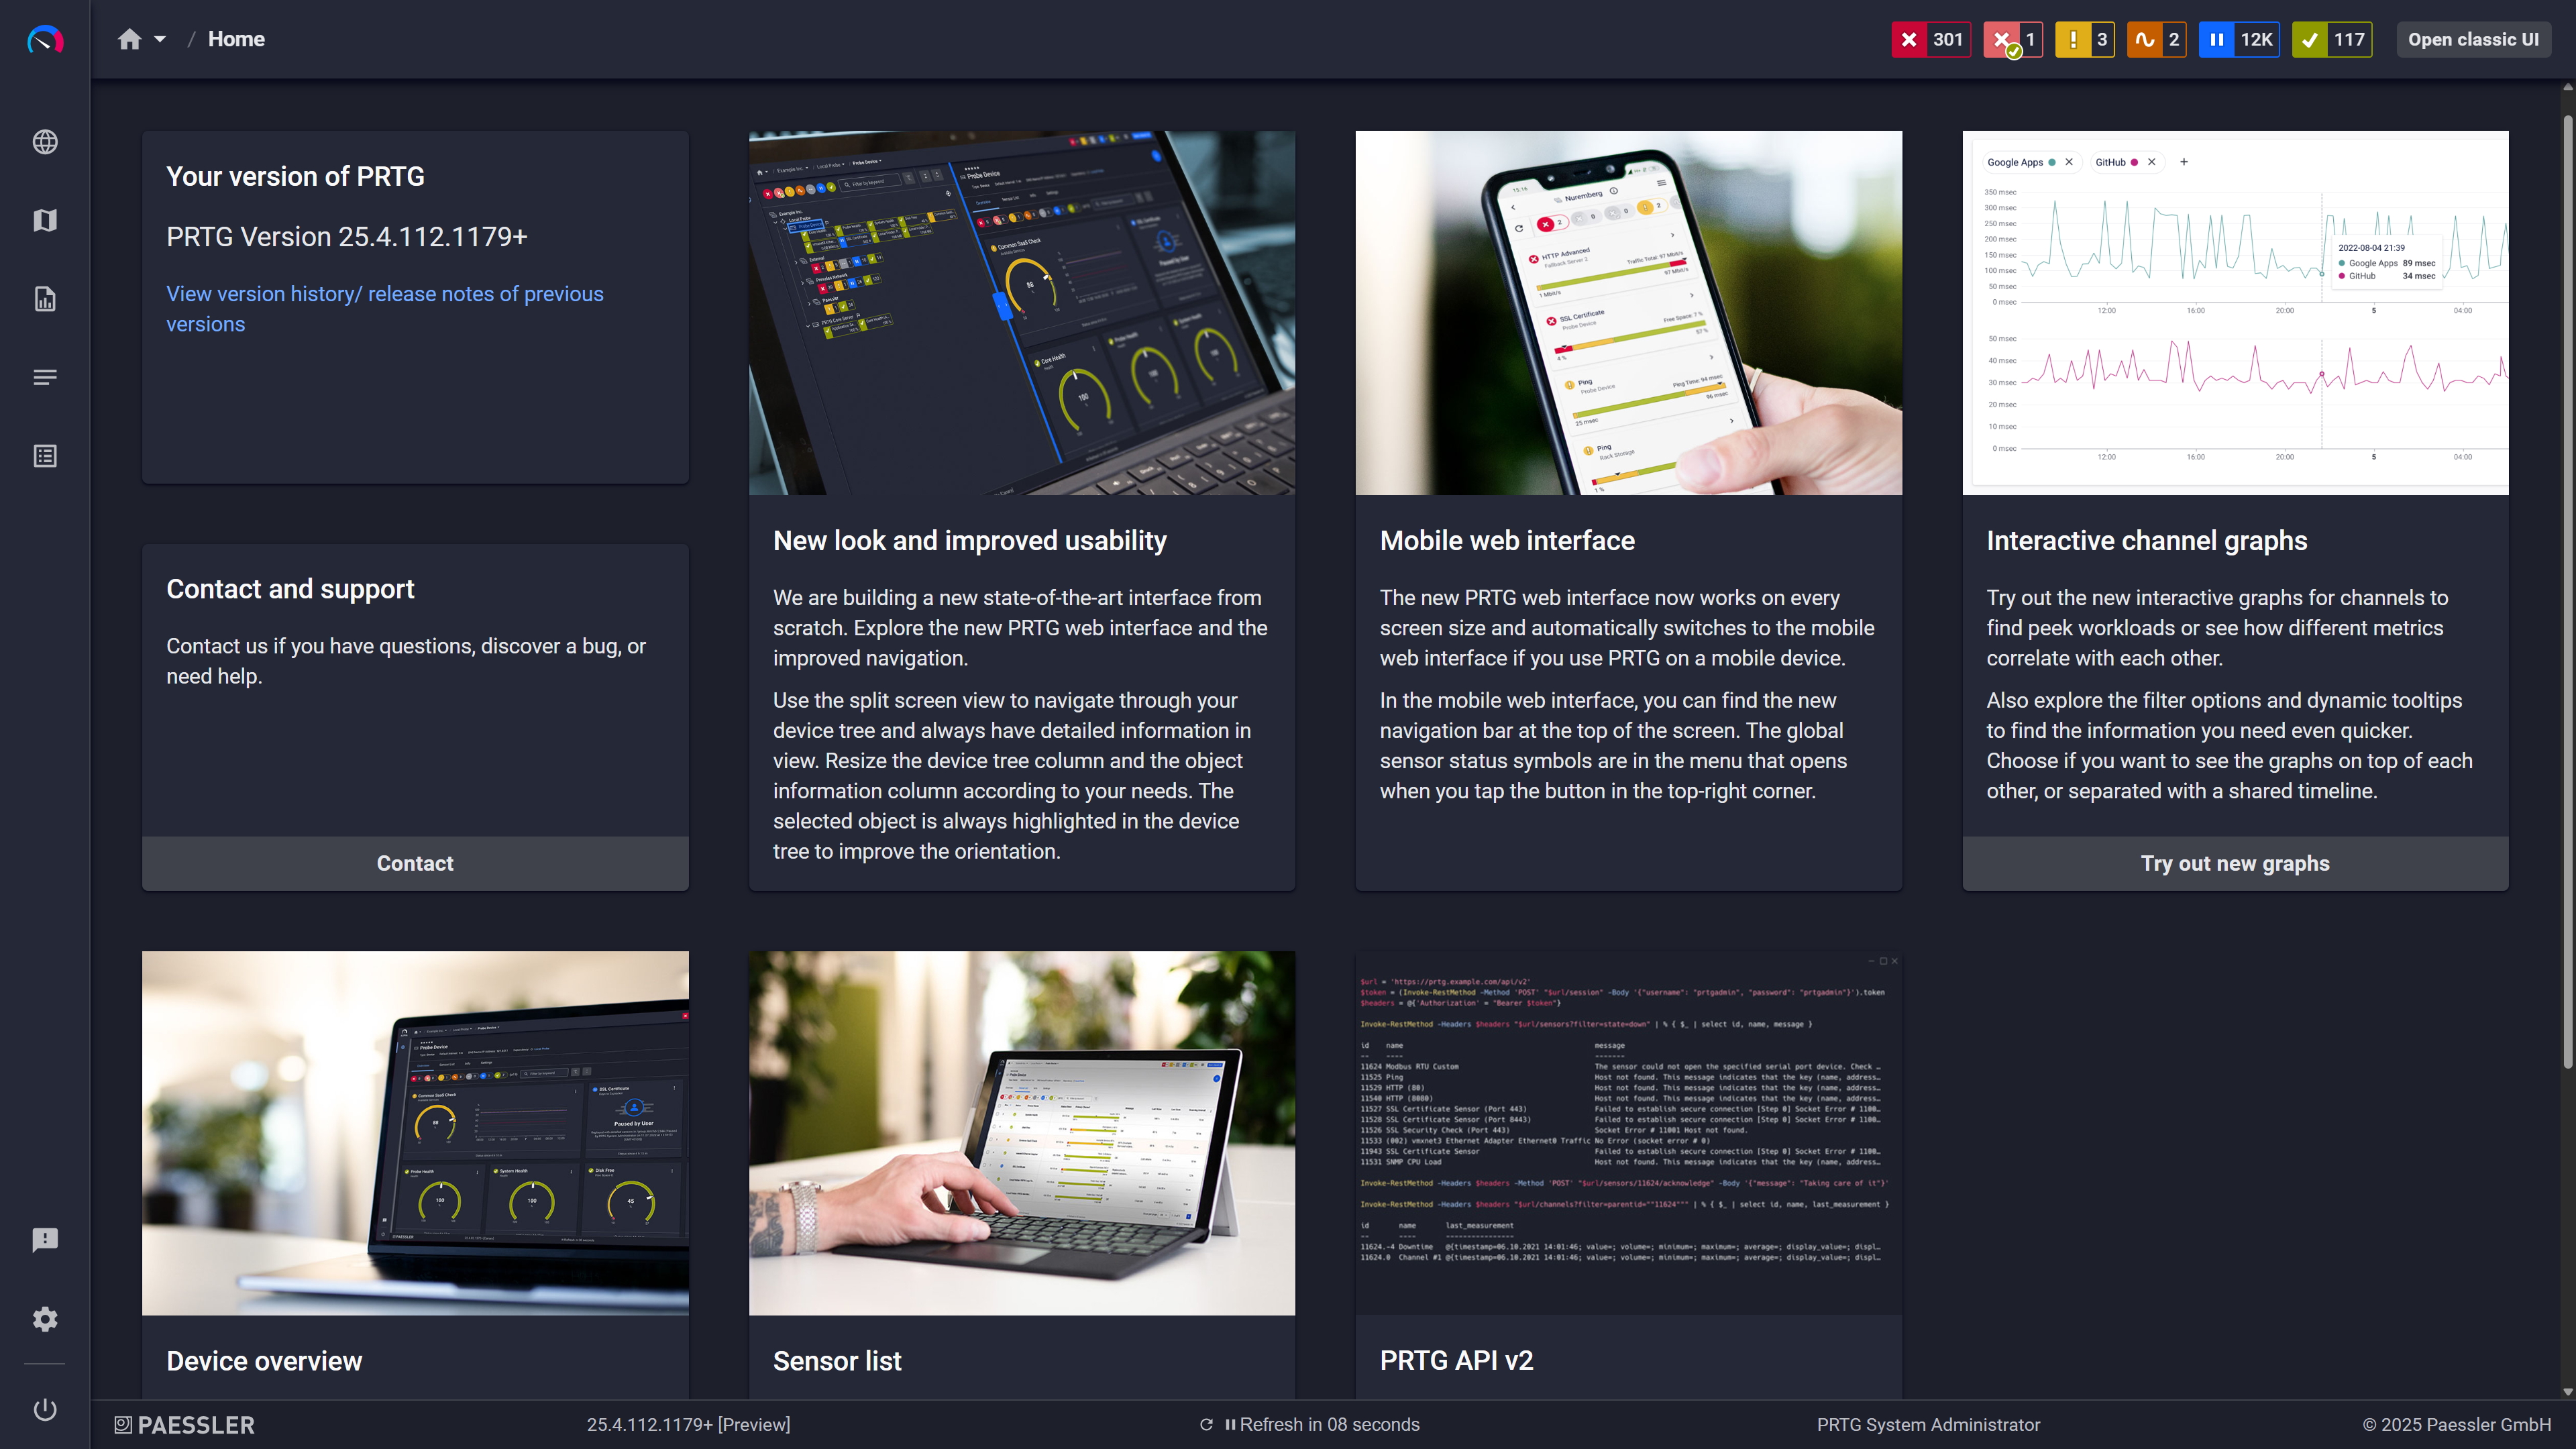
Modern interface, everything within reach

One View Across Every Site You Manage 

Branch offices and remote sites don't exist inside the reach of a single monitoring instance. The usual result is one of two things: separate monitoring tools per location, each with its own management overhead, or those sites simply don't get monitored at all. For enterprise networks with distributed infrastructure, neither option works.  

PRTG remote probes extend monitoring to any additional network segment or remote location. Classic probes run on Windows; multi-platform probes run on Linux. Debian, Ubuntu, RHEL, and Raspberry Pi are all supported. Both report back to one central Core Server. One IT management view covers every site.  

  • Remote probes monitor their local network segments directly; processed data goes to the Core Server, keeping WAN bandwidth use low
  • Classic (Windows) and multi-platform (Linux) probe options to fit mixed environments
  • All probe data consolidates in the central PRTG interface, with no separate dashboards per site
  • Custom Geo Maps let you place and monitor network devices from all sites on a single world map view
  • Probe-to-server communication works across WAN links and firewalled network segments

Note: Multi-platform probes support the core monitoring workload but have some feature limitations compared to classic probes. Check the PRTG documentation for a current feature comparison before deciding which probe type to deploy. 

How PRTG Monitors Your Network  

Not one method fits everything. PRTG runs several in parallel depending on what it's talking to. And when you need topology and change context on top of that monitoring data, Paessler PRTG UVexplorer adds it.

SNMP polling

PRTG scans network devices via SNMP GET requests on whatever interval you configure. The default is 60 seconds. It pulls OID values straight from the device's MIB: interface status, traffic counters, error rates, CPU load, memory. Adjustable per sensor if you need tighter or looser timing on specific devices.  

All three SNMP versions are supported. v1 and v2c use community strings. v3 adds authentication and encryption if your environment requires it. Either way, credentials go in once at the device or group level and inherit downward. You're not touching every device individually.  

WMI and SSH

Windows servers and workstations get queried over WMI. Nothing installed on the monitored system. PRTG reads CPU, memory, disk, running services, and event log entries remotely, using the credentials you've stored in PRTG centrally.  

Linux and Unix: same idea, different protocol. PRTG connects via SSH and runs commands to pull the data. Set credentials on the group and everything under it picks them up automatically. 

Flow Data Collection 

Routers and switches that support flow export send records to PRTG's built-in receiver. PRTG takes that data and breaks it down into Top Talkers, Top Connections, and Top Protocols views.  

Supported: NetFlow v5 and v9, sFlow, IPFIX, jFlow. Getting flow export running means a few CLI commands on the source device, pointing it at PRTG's receiver address. That's a one-time setup. After that, PRTG handles the rest.  

No flow export support on a device? Use the packet sniffer instead. Point it at a SPAN or mirror port and it captures traffic directly. Nothing changes on the source device. 

Availability Checks

Every IP-addressed device in your tree gets ICMP ping checks at configurable intervals. Lightweight, continuous, and usually the first thing that fires when something goes down. Before users call.  

For web services and internal apps, HTTP/HTTPS sensors check response codes, page content, and load times. DNS sensors confirm name resolution is working. Between ping, HTTP, and DNS, you've got availability covered from core switches to hosted endpoints. 

Alerts and Thresholds 

Every sensor has its own warning and error thresholds, which you set yourself. Not PRTG defaults, not industry averages. The limits that make sense in your environment. When a value triggers one, PRTG sends a notification through whatever channel you've set up: email, SMS, push notification on iOS or Android, syslog, webhook, or a script.  

Dependency settings handle alert noise. If a router goes down, PRTG knows every device behind it is unreachable for the same reason. It suppresses those downstream alerts and shows you the actual failure, not 40 alerts for every device sitting behind a downed router. Maintenance windows let you pause alerting for scheduled work without turning monitoring off entirely. 

Add topology, dependencies, and change history with Paessler PRTG UVexplorer

PRTG tells you a device is down. It doesn't show you the port-level path that device sits on, what depends on it, or what changed right before it broke. That's the next question every incident raises, and answering it the old way usually means SSH sessions and a Visio diagram that went stale months ago. 

PRTG UVexplorer closes that gap. It discovers your network and builds Layer 2 and Layer 3 topology maps automatically, down to the port level. Click any device to see what's upstream and what's downstream, so the blast radius of a failure is one click away instead of a manual trace. It also backs up device configurations with a side-by-side diff view and flags topology changes after each scheduled discovery run, so you can see what changed leading up to an incident. PRTG UVexplorer is a separate Paessler product with its own interface. Its topology and change data is surfaced inside PRTG, while discovery and configuration happen in UVexplorer itself. Maps and change history refresh through scheduled discoveries, so what you see reflects the state captured at the last run. 

See how Paessler PRTG UVexplorer completes the network management picture →

free downLoad

What changes when you add PRTG to your network management 

Task 

Without PRTG

Without PRTG

With PRTG

With PRTG

Device inventory 

Without PRTG
not included

Manual spreadsheet, updated when someone remembers 

With PRTG
included

Network discovery builds and keeps the device list current as new devices are added 

Bandwidth usage diagnosis 

Without PRTG
not included

Log into router CLI, run show commands, correlate manually 

With PRTG
included

Top Talkers, Top Connections, Top Protocols view from network traffic data — in minutes 

Availability monitoring 

Without PRTG
not included

Reactive — downtime already in progress when users report it 

With PRTG
included

Continuous ICMP/SNMP polling with threshold-based alerts before users notice 

Multi-site visibility 

Without PRTG
not included

Separate monitoring tools per location, or no coverage at the edge 

With PRTG
included

Remote probes consolidate all sites under one IT management interface 

Initial setup 

Without PRTG
not included

Days to weeks for open-source; procurement overhead for enterprise tools 

With PRTG
included

Guided wizard, device templates, core monitoring running the same day 

free downLoad

“I would recommend PRTG because it has helped us significantly improve service uptime by highlighting important alerts that would otherwise result in a system failure or service disruption if action was not taken. Thanks to PRTG, we can ensure that The Ritz London’s network and IT systems are five-star, just like the hotel.”

Richard Isted, IT Manager
The Ritz London

”GESAC increasingly focuses on innovation to improve the quality of services offered and the experience of passengers handled every day by Naples Airport. Thanks to PRTG, we finally have unified, automatic, and continuous monitoring of the airport network and can guarantee quick and timely interventions.”

Domenico Ciervo, GESAC ICT Manager
Naples International Airport

”As an international company, PRTG is ideal for us. If something went down half way across the world, we wouldn’t be woken up – we can rely on PRTG to identify the problem and alert us before it occurs – enabling the right person, in the right time zone to resolve the problem. At the end of the day, if we’re to provide an internal network experience for our employees that meets expectations, we need a tool like PRTG to be successful.”

Barry Kelly, Systems Engineer
Skyscanner

Paessler PRTG Network Monitor licenses & pricing

Choose the PRTG Network Monitor subscription that's best for you.

License NameLicense descriptionPriceLicense DetailsGet startedPricing Details
PRTG 500$200per month paid annuallyBuy nowBuy now

Enough to monitor multiple aspects of 50 devices

PRTG 1000$358per month paid annuallyBuy nowBuy now

Enough to monitor multiple aspects of 100 devices

PRTG 2500$742per month paid annuallyBuy nowBuy now

Enough to monitor multiple aspects of 250 devices

PRTG 5000$1,300per month paid annuallyBuy nowBuy now

Enough to monitor multiple aspects of 500 devices

PRTG 10000$1,642per month paid annuallyBuy nowBuy now

Enough to monitor multiple aspects of 1000 devices

Over 100,000 Customers Worldwide Love Paessler  

customer success stories

 Network Management Software: Frequently Asked Questions 


What's the difference between network monitoring and network management?

Network monitoring is the continuous collection of data from your infrastructure: availability, performance metrics, network traffic, device status. Network management is the broader discipline that includes monitoring but also covers change management, capacity planning, configuration management, and troubleshooting network issues.  

PRTG is network monitoring software. It gives IT teams continuous data, threshold-based alerts, historical records, and traffic analysis. The management decisions stay with your team. PRTG is the data foundation those decisions are built on. 

Does PRTG support Cisco, Juniper, HP, and other major vendors?

Yes. PRTG uses standard protocols (SNMP, WMI, SSH, REST) so it works with any network device that supports them, regardless of manufacturer. Built-in device templates cover Cisco, Dell, HP, and others, selecting the right sensors automatically during network discovery.  

For devices not covered by built-in sensors, the PRTG Sensor Hub has additional community-built and vendor-specific sensors. Custom sensors via PRTG's API are an option too. 

Can PRTG monitor both on-premises and cloud-connected services from one instance?

Yes. PRTG monitors on-premises hardware, servers, and endpoints alongside cloud-connected services, all from one interface. HTTP/HTTPS and REST API sensors cover web services and SaaS apps. Remote probes extend monitoring to cloud-connected infrastructure at remote sites.  

For deeper cloud-native metric collection, PRTG includes native sensors for services like Amazon CloudWatch. Coverage varies by cloud provider and service. Check the PRTG sensor library for what's available natively before building custom sensors. 

How is PRTG different from SolarWinds, Zabbix, or ManageEngine?

The main differences come down to setup time, licensing, and scope.  

Zabbix is open-source and capable, but initial setup across a mixed environment takes time and platform knowledge, and there's no commercial support included. SolarWinds and ManageEngine are full-featured enterprise network monitoring tools, but they bring enterprise procurement cycles, module-based licensing, and professional services costs to match. PRTG uses straightforward per-sensor licensing, designed to get IT teams up and running the same day in most environments. PRTG freeware gives you 100 sensors permanently free to evaluate, with no procurement cycle required. 

Does PRTG require agents on monitored devices?

No, for the majority of device types. SNMP, WMI, and SSH monitoring are all agentless. PRTG queries the network device directly using credentials you provide. ICMP ping and HTTP checks require nothing on the monitored device at all.  

Custom sensors can be deployed on monitored systems for specialized use cases, but that's not needed for standard monitoring. 

What is a sensor in PRTG, and how many will I need?

A sensor is PRTG's basic monitoring unit. It monitors one specific aspect of a device: one network interface, one service, one disk. A single server might use 5–10 sensors covering CPU, memory, each disk volume, and each monitored service.  

Licensing is based on sensor count, not device count or user count. PRTG freeware covers 100 sensors permanently, enough for a small environment or a solid proof of concept. 

Can PRTG be used by MSPs or for monitoring multiple client environments?

Yes. Managed service providers use PRTG to monitor multiple client environments from a single deployment. Remote probes deploy at each client site and report back to a central Core Server. The device tree lets you organize clients into separate groups with their own credentials, sensors, and alert contacts.  

One thing to know: PRTG doesn't have native multi-tenant isolation. No separate client portals, no per-client billing, no built-in role separation out of the box. MSPs who use it successfully build their own structure within the platform. It works well for internal NOC monitoring across managed service environments. It's not a purpose-built MSP platform. 

Does PRTG offer real-time monitoring, root cause analysis, or network topology mapping?

These are common terms worth clarifying.  

PRTG is interval-based, not a true real-time stream. The default polling interval is 60 seconds, adjustable down to 30 seconds for individual sensors. For most infrastructure monitoring scenarios, that's more than sufficient, but if you need sub-second telemetry, PRTG isn't the right fit.  

Automated root cause analysis is also outside what PRTG does. What it does instead: dependency-based alerting suppresses downstream noise when an upstream device fails, so you see the actual failure point rather than 40 alerts for every device behind a downed router. Combined with historical sensor data and traffic views, your team has what it needs to diagnose network issues fast. The analysis itself stays with you.  

On network topology mapping: PRTG builds a structured device tree from its discovery scans, and you can create custom network maps manually, placing devices visually and linking them to show relationships. That's useful for dashboards and operational overviews. What it doesn't do on its own is automated Layer 2 and Layer 3 topology discovery. 
For that, Paessler PRTG UVexplorer adds automated topology with port-level detail, surfaces upstream and downstream dependencies in the PRTG interface, and keeps the maps current through scheduled discoveries. 
Learn more about Paessler PRTG UVexplorer.

Paessler PRTG

Paessler PRTG

Network Monitoring Software – Version 26.1.116.1532 (February 9th, 2026)

Hosting icon

Hosting

Download for Windows and cloud-based version PRTG Hosted Monitor available

Languages icon

Languages

English, German, Spanish, French, Portuguese, Dutch, Russian, Japanese, and Simplified Chinese

test

Monitor everything

Network devices, bandwidth, servers, applications, virtual environments, remote systems, IoT, and more

test

Pricing

Choose the PRTG Network Monitor subscription that's best for you

Discover more monitoring insights and stories

Content illustration

Powerful stories from the monitoring world

  • Usability is Key Factor for Network Monitoring Software - Paessler Blog
  • Network Mapping Tools: 9 Professional Solutions for IT Teams
  • What Is SNMP? – IT Explained
Support illustration

Resources to master your monitoring challenges

  • PRTG Manual: Installing the Software - Paessler
  • PRTG Manual: Available Sensor Types - Paessler
  • PRTG Manual: PRTG Administration Tool - Paessler
Solution illustration

Solutions for all your monitoring needs

  • Network Management
  • PRTG network monitoring tool - Paessler
  • Offline Network Monitoring
PRTG Logo

Start Monitoring with PRTG and see how it can make your network more reliable and your job easier.

Free download
PRODUCT OVERVIEW

Products

  • Paessler PRTG
    Paessler PRTGMonitor your whole IT infrastructure
    • PRTG Network Monitor
    • PRTG Enterprise Monitor
    • PRTG Hosted Monitor
    • PRTG UVexplorer
    • PRTG extensions
      Extensions for Paessler PRTGExtend your monitoring to a new level
  • Icon Features
    FeaturesExplore all monitoring features

Monitoring with PRTG

  • Network monitoring
  • Bandwidth monitoring
  • SNMP monitoring
  • Network mapping
  • Wi-Fi monitoring
  • Server monitoring
  • Network traffic analyzer
  • NetFlow monitoring
  • Syslog server

Useful Links

  • PRTG Manual
  • Knowledge Base
  • Customer Success Stories
  • About Paessler
  • Subscribe to newsletter
  • PRTG Support
  • PRTG Consulting
  • PRTG Feedback & Roadmap

Contact

Paessler GmbH
Thurn-und-Taxis-Str. 14, 
90411 Nuremberg 
Germany

[email protected]

+49 911 93775-0

  • Contact us
©2026 Paessler GmbHTerms & ConditionsPrivacy PolicyImprintReport VulnerabilityDownload & InstallSitemap
References References References