• Company
    • About Us
    • Case Studies
    • Press Center
    • Careers
    • Blog
    • Contact us
  • Contact us
  • Login
 
  • English
    • Deutsch
    • Español
    • Français
    • Italiano
    • Português
Paessler
                    - The Monitoring Experts
  • Products
    • Paessler PRTG
      Paessler PRTGMonitor your whole IT infrastructure
      • PRTG Network Monitor
      • PRTG Enterprise Monitor
      • PRTG Hosted Monitor
      • PRTG UVexplorer
      • PRTG extensionsExtensions for Paessler PRTGExtend your monitoring to a new level
    • Icon Features
      FeaturesExplore all monitoring features
      • Maps & dashboards
      • Alerts & notifications
      • Multiple user interfaces
      • Distributed monitoring
      • Customizable reporting
  • Solutions
    • Industries
      IndustriesMonitor various industry sectors
      • Industrial
      • Healthcare
      • Data Center
      • Education
      • Finance
      • Government
    • IT Topics
      IT TopicsMonitor all areas of IT
      • Network Monitoring
      • Bandwidth Monitoring
      • SNMP Monitor
      • Network Mapping
      • WiFi Monitoring
      • Server Monitoring
  • Pricing
  • Resources
    • Getting Started
      Getting StartedModules for self-paced learning
    • How-to Guides
      How-to GuidesGet the most out of PRTG
    • Videos & Webinars
      Videos & WebinarsLearn from Paessler experts
    • IT  Knowledge
      IT KnowledgeExpand your IT knowledge
    • PRTG Manual
      PRTG ManualFull documentation
    • Knowledge Base
      Knowledge BaseShare community knowledge
    • PRTG Sensor Hub
      PRTG Sensor HubGet sensors, scripts & templates
    • Trainings
      PRTG TrainingLearn how to work with PRTG
  • Partners
    • Icon Handshake
      Become a PartnerFor resellers and channel partners
    • Icon MSP
      Become an MSPDeliver monitoring as a managed service
    • icon partner
      Partner PortalLog in to your partner account
    • Deal Registration
      Deal RegistrationRegister your sales opportunities
    • icon search
      Find a PartnerFind partners selling Paessler products
    • icon technology
      Technology AlliancesSee Paessler technology partnerships
    • Partner HubTools for Your Success
  • Company
    • About Us
    • Case Studies
    • Press Center
    • Careers
    • Blog
    • Contact us
  • Contact us
  • Login
  • English
    • Deutsch
    • Español
    • Français
    • Italiano
    • Português
  • Get a quote
  • Free trial

Complete Network Protocol Analyzer

See which protocols, IPs, and connections are consuming bandwidth. Not just when something breaks.

Free download
PRODUCT OVERVIEW

What does a network protocol analyzer actually show you about your traffic? 

PRTG analyzes network traffic using two methods: flow monitoring and packet sniffing. With flow monitoring, routers, switches, and firewalls export flow data (NetFlow, jFlow, sFlow, or IPFIX) directly to PRTG, giving you continuously updated traffic breakdowns by IP address, connection pair, and protocol. The packet sniffer covers local segments on devices that don't support flow export, analyzing packet headers on the PRTG probe's network interface. 

Together, the two methods give you the packet analysis and protocol-level visibility to turn "the network feels slow" into a specific host, connection, or protocol that's degrading network performance. Something you can actually act on, rather than a vague complaint with no clear starting point. 

PRTG supports: NetFlow v5/v9, jFlow, sFlow, IPFIX on routers, switches, and firewalls (Cisco, Juniper, Palo Alto, Fortinet, and others) · Packet Sniffer on Ethernet and Wi-Fi interfaces on the PRTG probe system · Traffic classified by TCP, UDP, ICMP, HTTP/S, DNS, FTP, and other well-known protocols and port assignments · Single sites and distributed environments via remote probes

Download PRTG Trial

What you will find on this page

  • Traffic Visibility for Your Network
  • Analyze Network Protocol Traffic
  • Manual Analysis vs. PRTG
  • FAQs

PRTG is compatible with all major vendors, products, and systems

compatible with all major vendors, products, and systems

Get the Traffic Visibility Your Network Troubleshooting Actually Needs

Full visibility into what's consuming your network bandwidth

Bandwidth spikes without context. Total throughput numbers tell you something changed, but not which host caused it, which connection is responsible, which protocol is involved, or where the bottlenecks are. Every network troubleshooting session starts from scratch with incomplete information and manual captures that only cover a single point in time. PRTG collects flow data from your existing routers, switches, and firewalls and breaks traffic down by IP address, connection pair, and protocol in continuously updated Toplists. Toplists show exactly what's consuming bandwidth, specific enough to act on and available without manual intervention.

  • Traffic ranked by IP address (Top Talkers), connection pair (Top Connections), and protocol (Top Protocols)
  • Flow data comes in continuously from your existing infrastructure. No manual captures.
  • Covers wired Ethernet and wireless interfaces
  • Continuously updated traffic graphs with historical data for trend comparison
  • Compatible with NetFlow v5/v9, jFlow, sFlow, and IPFIX. That covers the vast majority of enterprise routers, switches, and firewalls without additional software.

A clear view of every protocol running on your network

Networks are living environments. Applications get added, protocols accumulate, and traffic patterns shift over time as infrastructure changes. Keeping a clear picture of what's actually running across every segment is part of staying on top of a network, not a reactive task. PRTG's flow monitoring categorizes all traffic by protocol across every monitored interface. The full protocol mix stays visible at all times, including traffic from older applications or services that have since been superseded. Unexpected entries surface in the Top Protocols view continuously, giving you the full picture without manual scanning.

  • Full protocol distribution across all monitored interfaces, updated continuously
  • Unexpected or legacy protocols surface in the Top Protocols view without manual scanning
  • Inactive applications or retired services still generating traffic are identifiable
  • Works across routers, switches, firewalls, and Wi-Fi infrastructure that supports flow export
  • No deep packet inspection required. Flow data is enough.
PRTG web interface showing live performance graphs for a Probe Health sensor

Live graphs, real-time performance data

PRTG device overview for an HPE Aruba 2530 switch with port state, ping, and CPU sensors

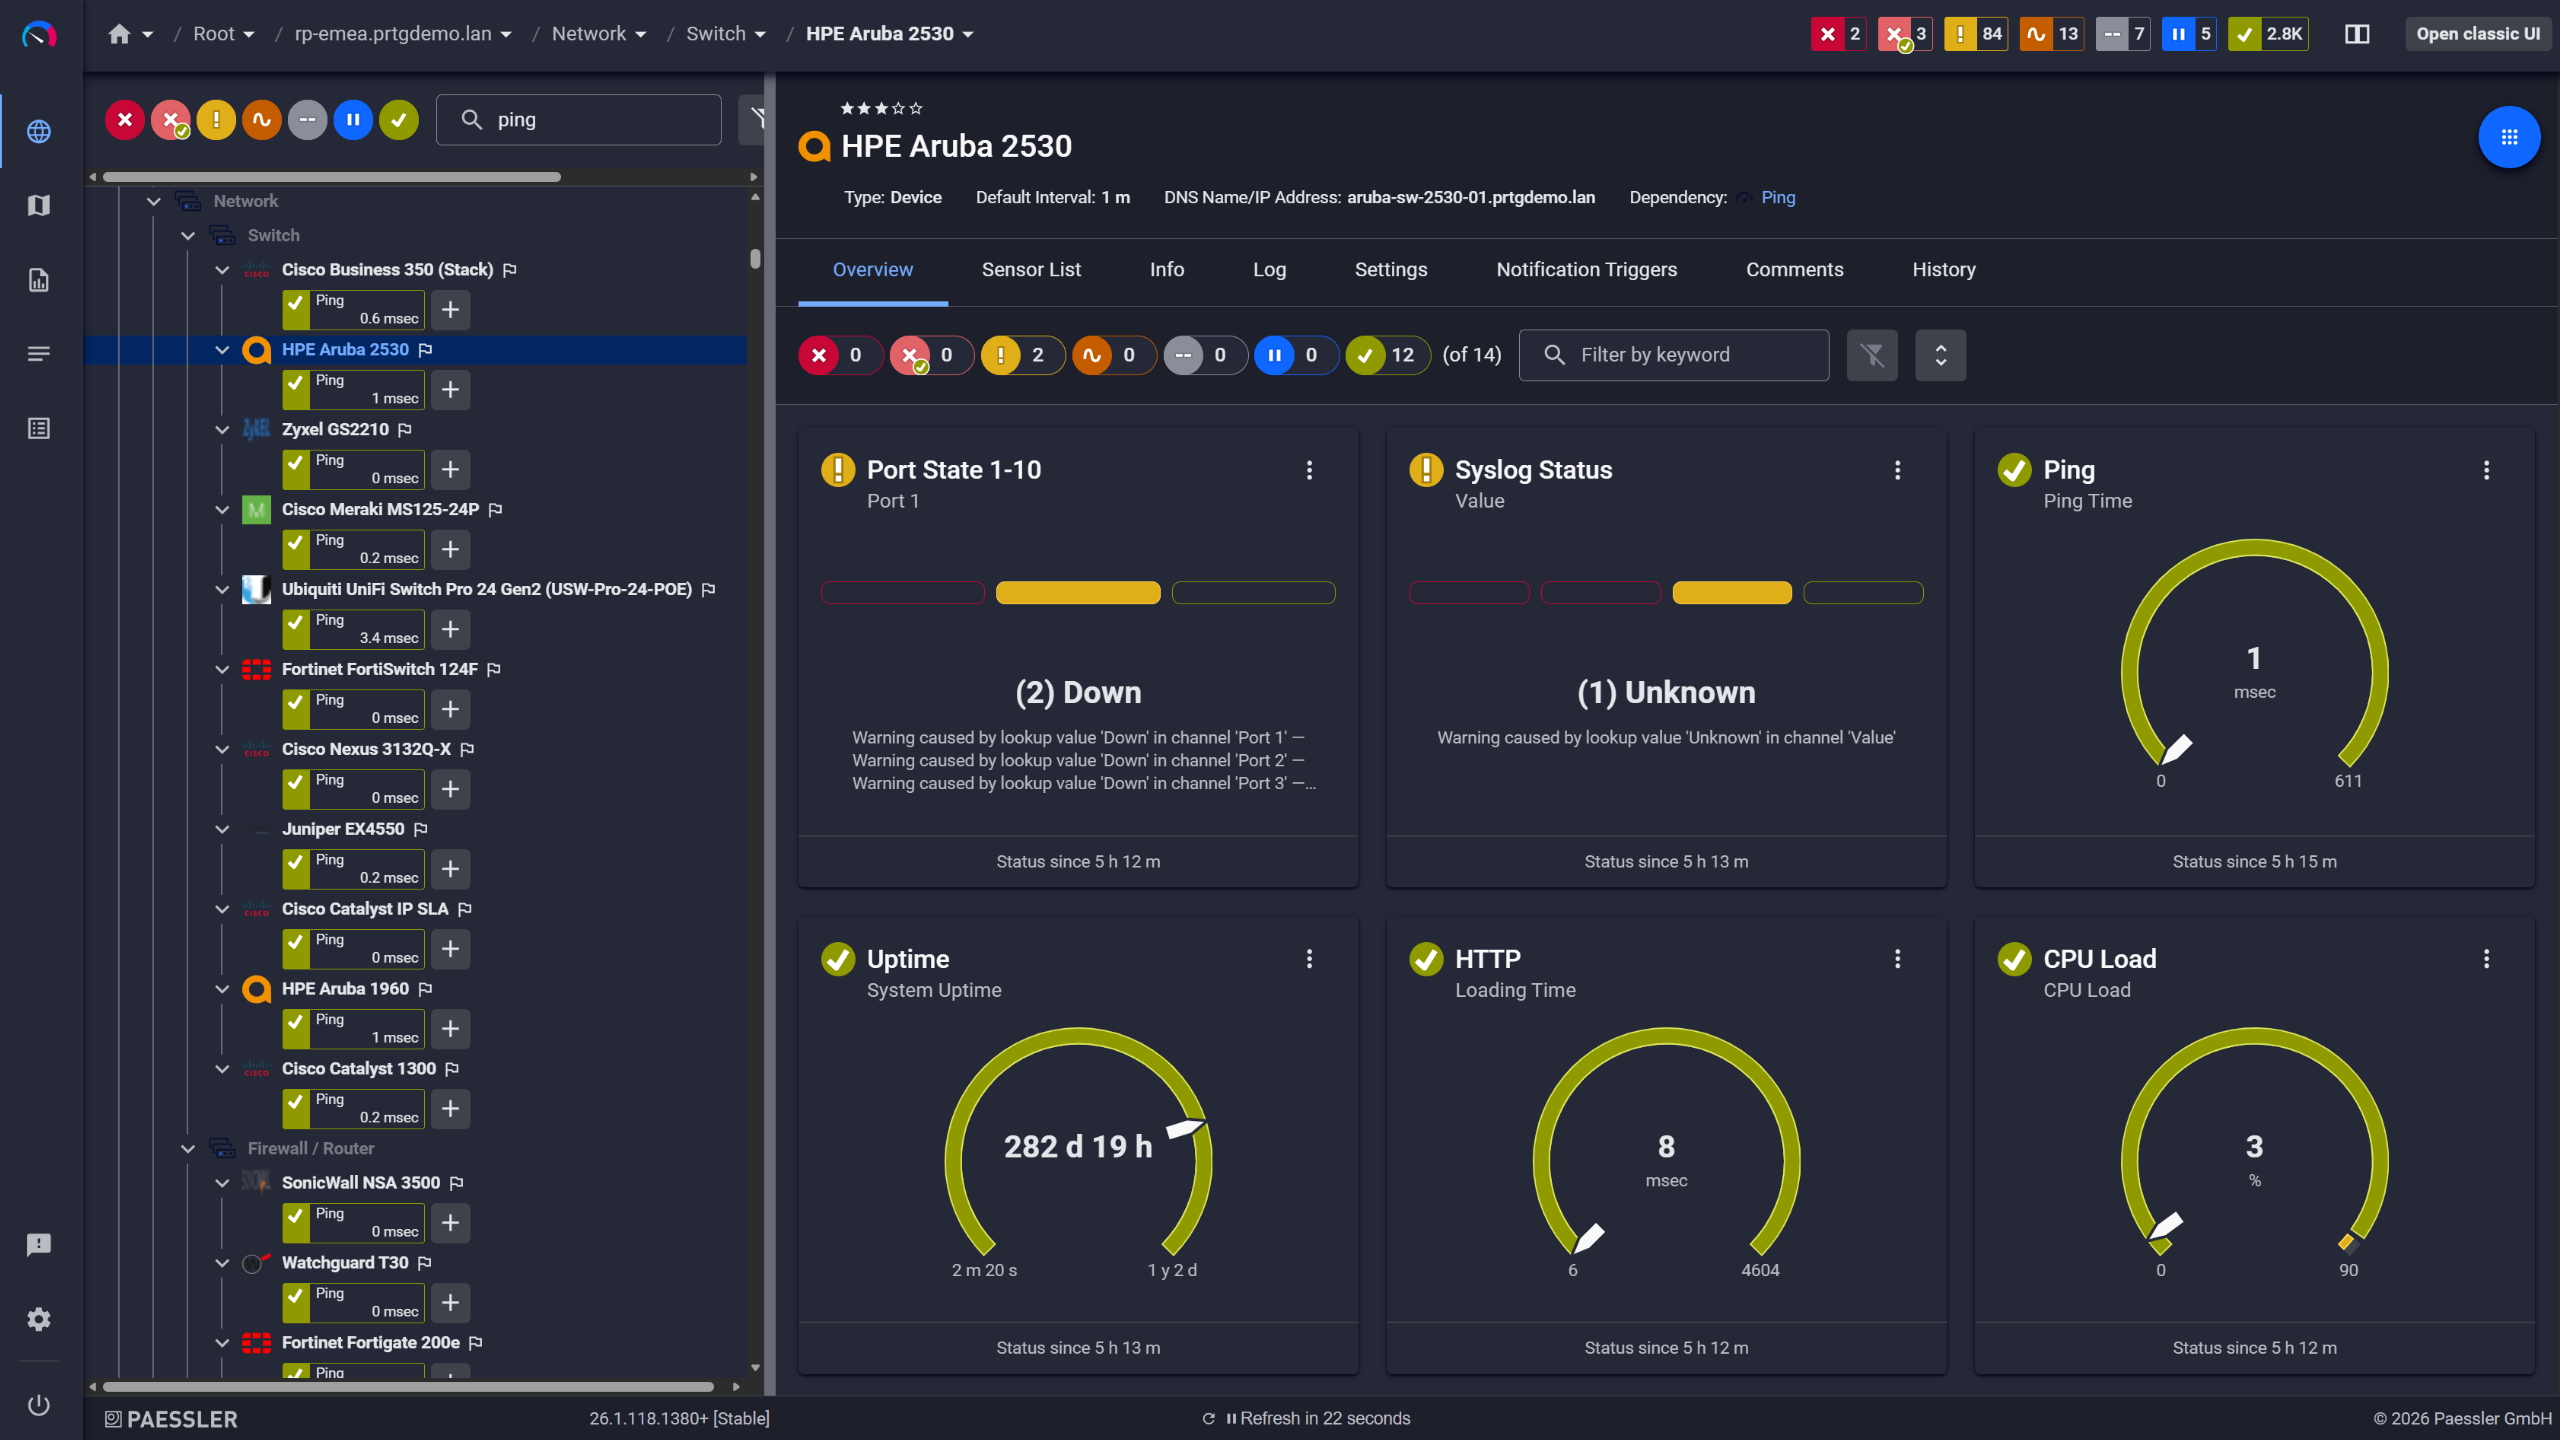
Network switches monitored across vendors

PRTG web interface showing device tree and full device list with sensor status badges

Full device list, instant overview

Alerts that reflect how your network actually behaves

Useful alert thresholds are built on real data. Traffic patterns vary by interface, time of day, and the mix of applications running on a given segment, and knowing what normal actually looks like for your environment is the foundation for alerts that mean something. PRTG stores historical traffic and protocol data so you can review actual behavior before setting limits. Once you know what normal looks like for a given interface or protocol, you configure thresholds based on that. Notifications go out only when something actually warrants attention. Email, SMS, push, Teams, HTTP actions to third-party tools. 

  • Historical traffic graphs across all flow and Packet Sniffer sensors provide real baseline context
  • Flexible thresholds per sensor channel, time window, and severity level
  • Alert on specific protocol or connection thresholds, not just total bandwidth
  • Email, SMS, push, Teams, and third-party integrations via HTTP actions
  • No machine learning dependency. Threshold-based, fully configurable.

See Why IT Professionals Trust PRTG

Start monitoring your infrastructure in minutes. No professional services, no complex configuration, no risk.

Free download
PRODUCT OVERVIEW

Traffic data that makes capacity planning a straightforward conversation 

Capacity decisions carry more weight when backed by data. Whether you're making the case for a bandwidth upgrade or demonstrating that existing capacity is sufficient, concrete traffic history is a stronger foundation than estimates or manually assembled samples. PRTG retains weeks or months of traffic history depending on your data retention configuration, broken down by protocol, interface, and bandwidth consumption. That's enough to back up either argument. Scheduled reports let you share a clear summary with stakeholders who need the numbers but won't go digging through dashboards. 

  • Long-term traffic trend data stored and displayed as time-series graphs
  • Scheduled and on-demand reports for capacity planning and management briefings
  • Protocol distribution over time, so you can see how your traffic mix shifts
  • Exportable data for further analysis
  • Bandwidth consumption broken down per interface, per protocol, and across defined time ranges. Useful for both internal reviews and external audits.
PRTG sunburst chart visualizing the full network hierarchy with color-coded sensor status

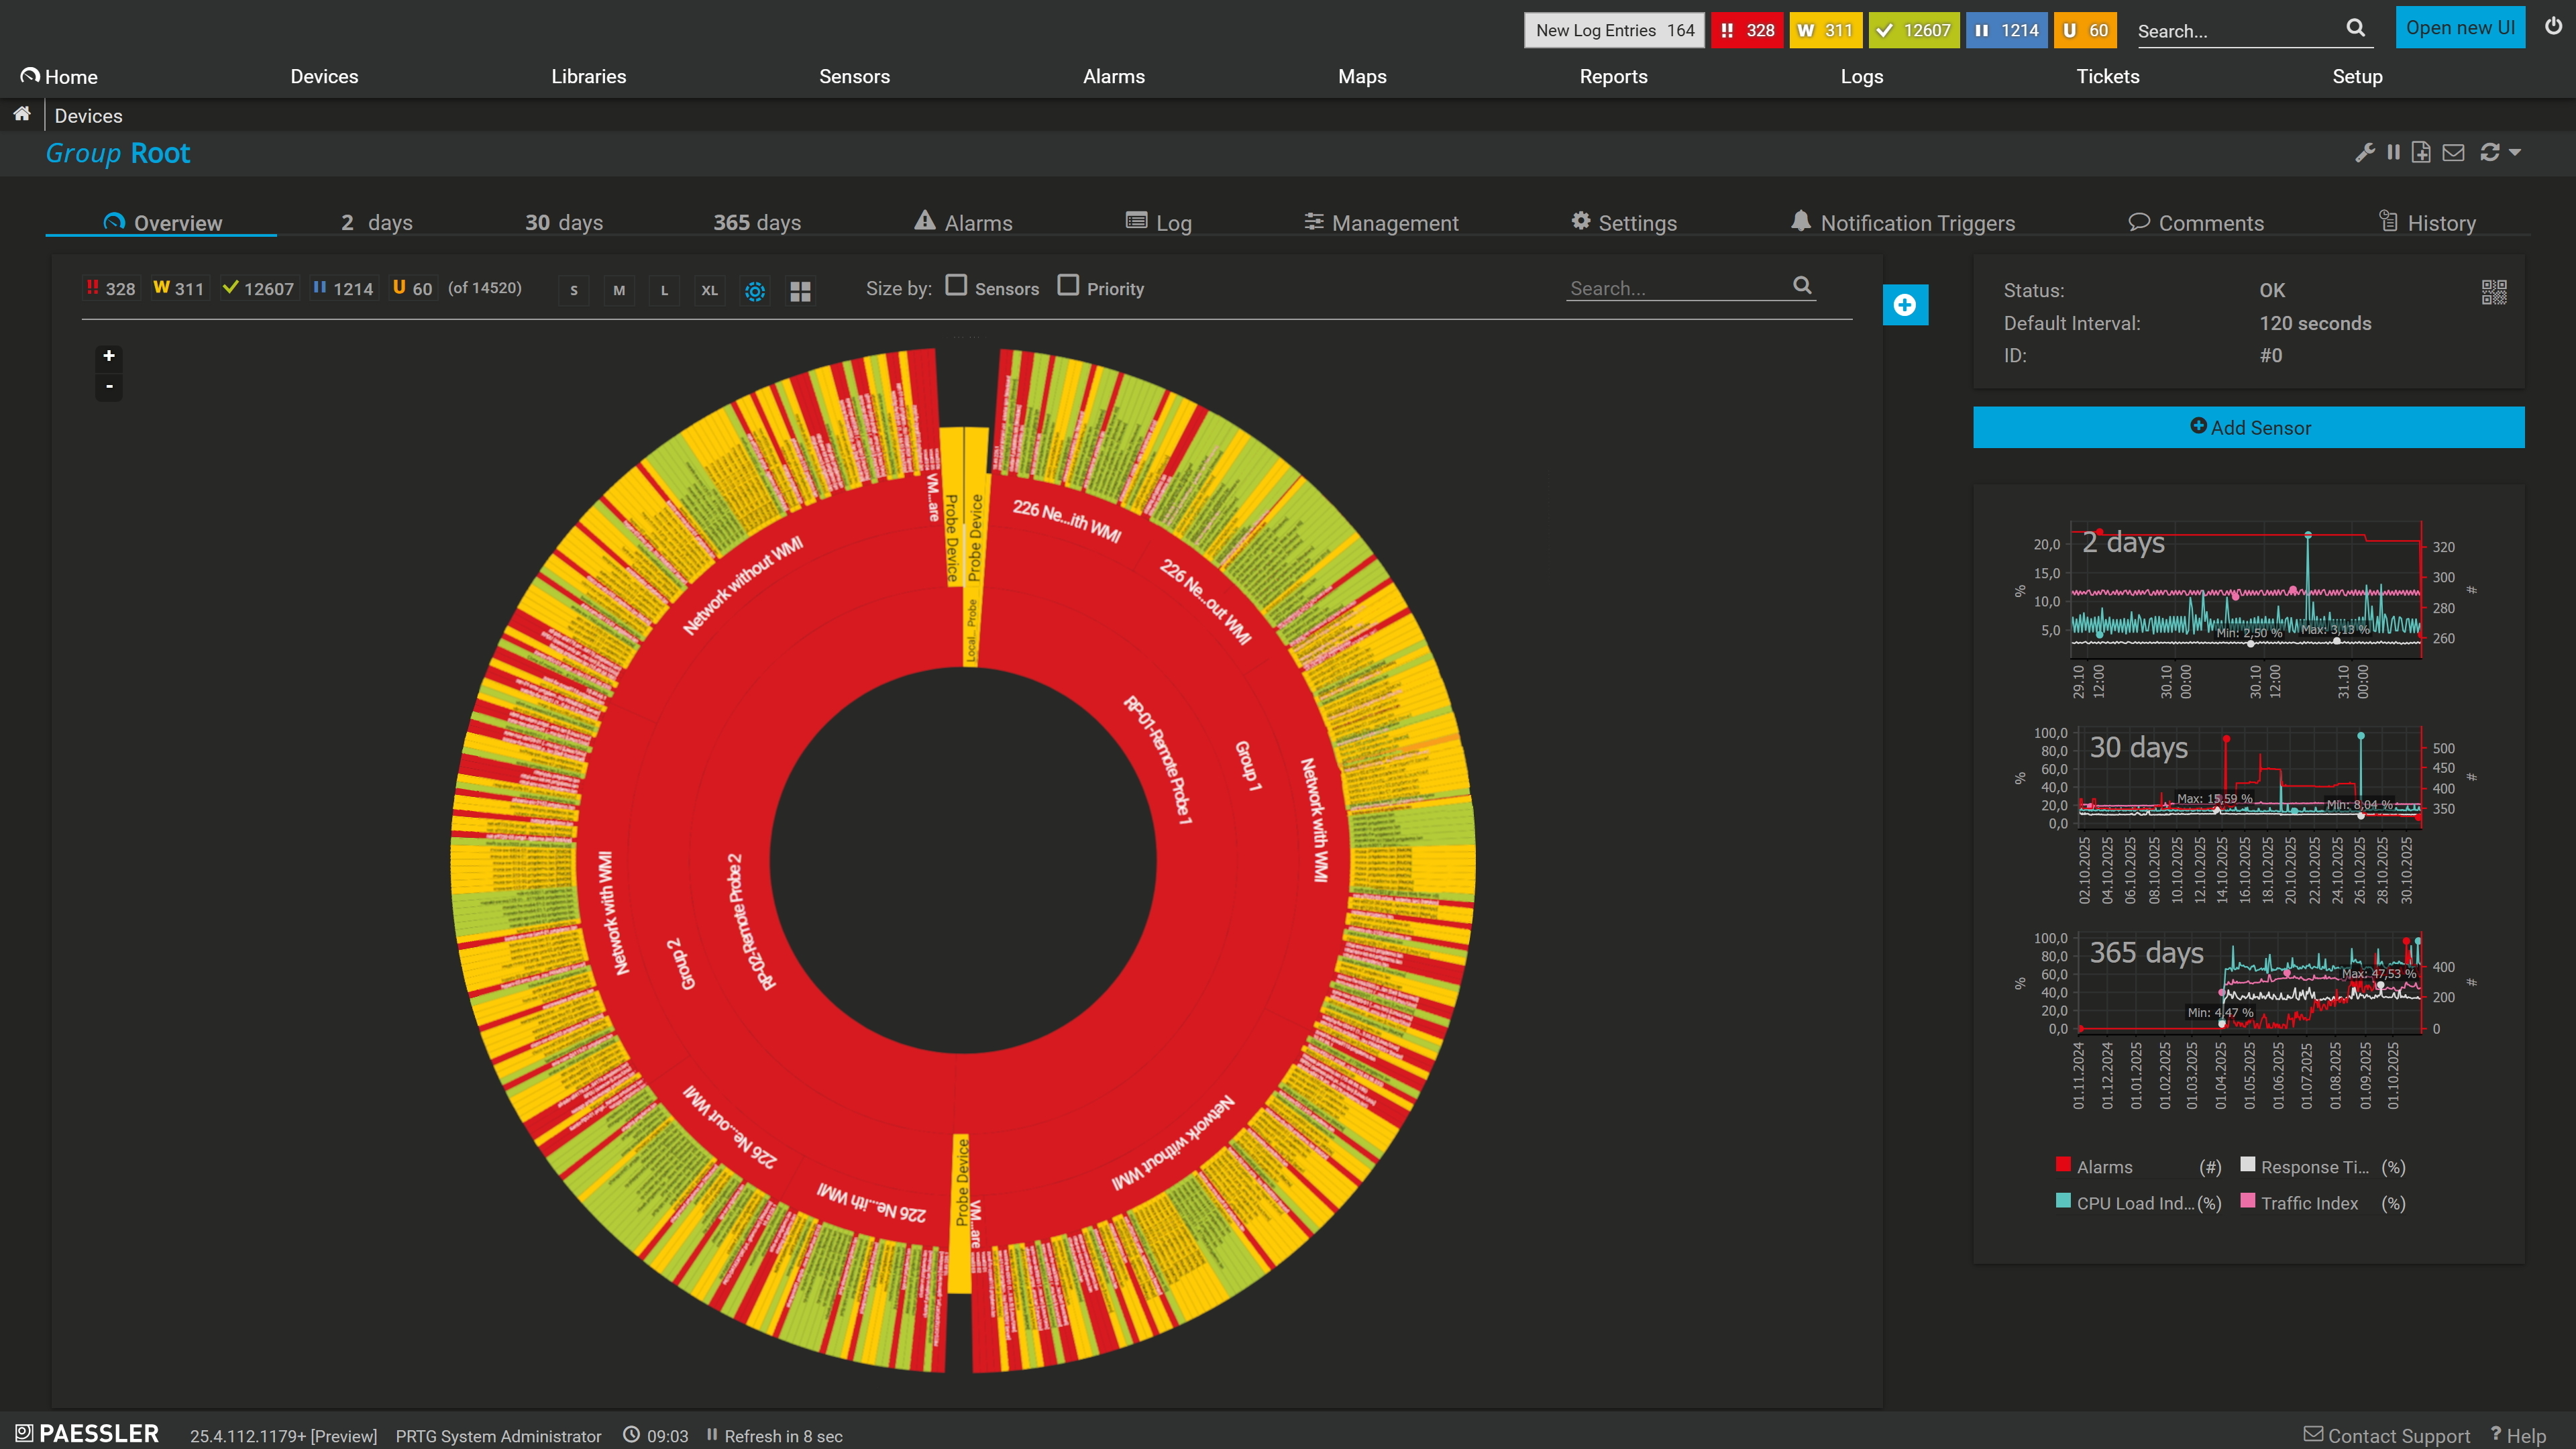
Your entire network, visualized instantly

PRTG Ping sensor graphs showing response time, min, max, and packet loss over time

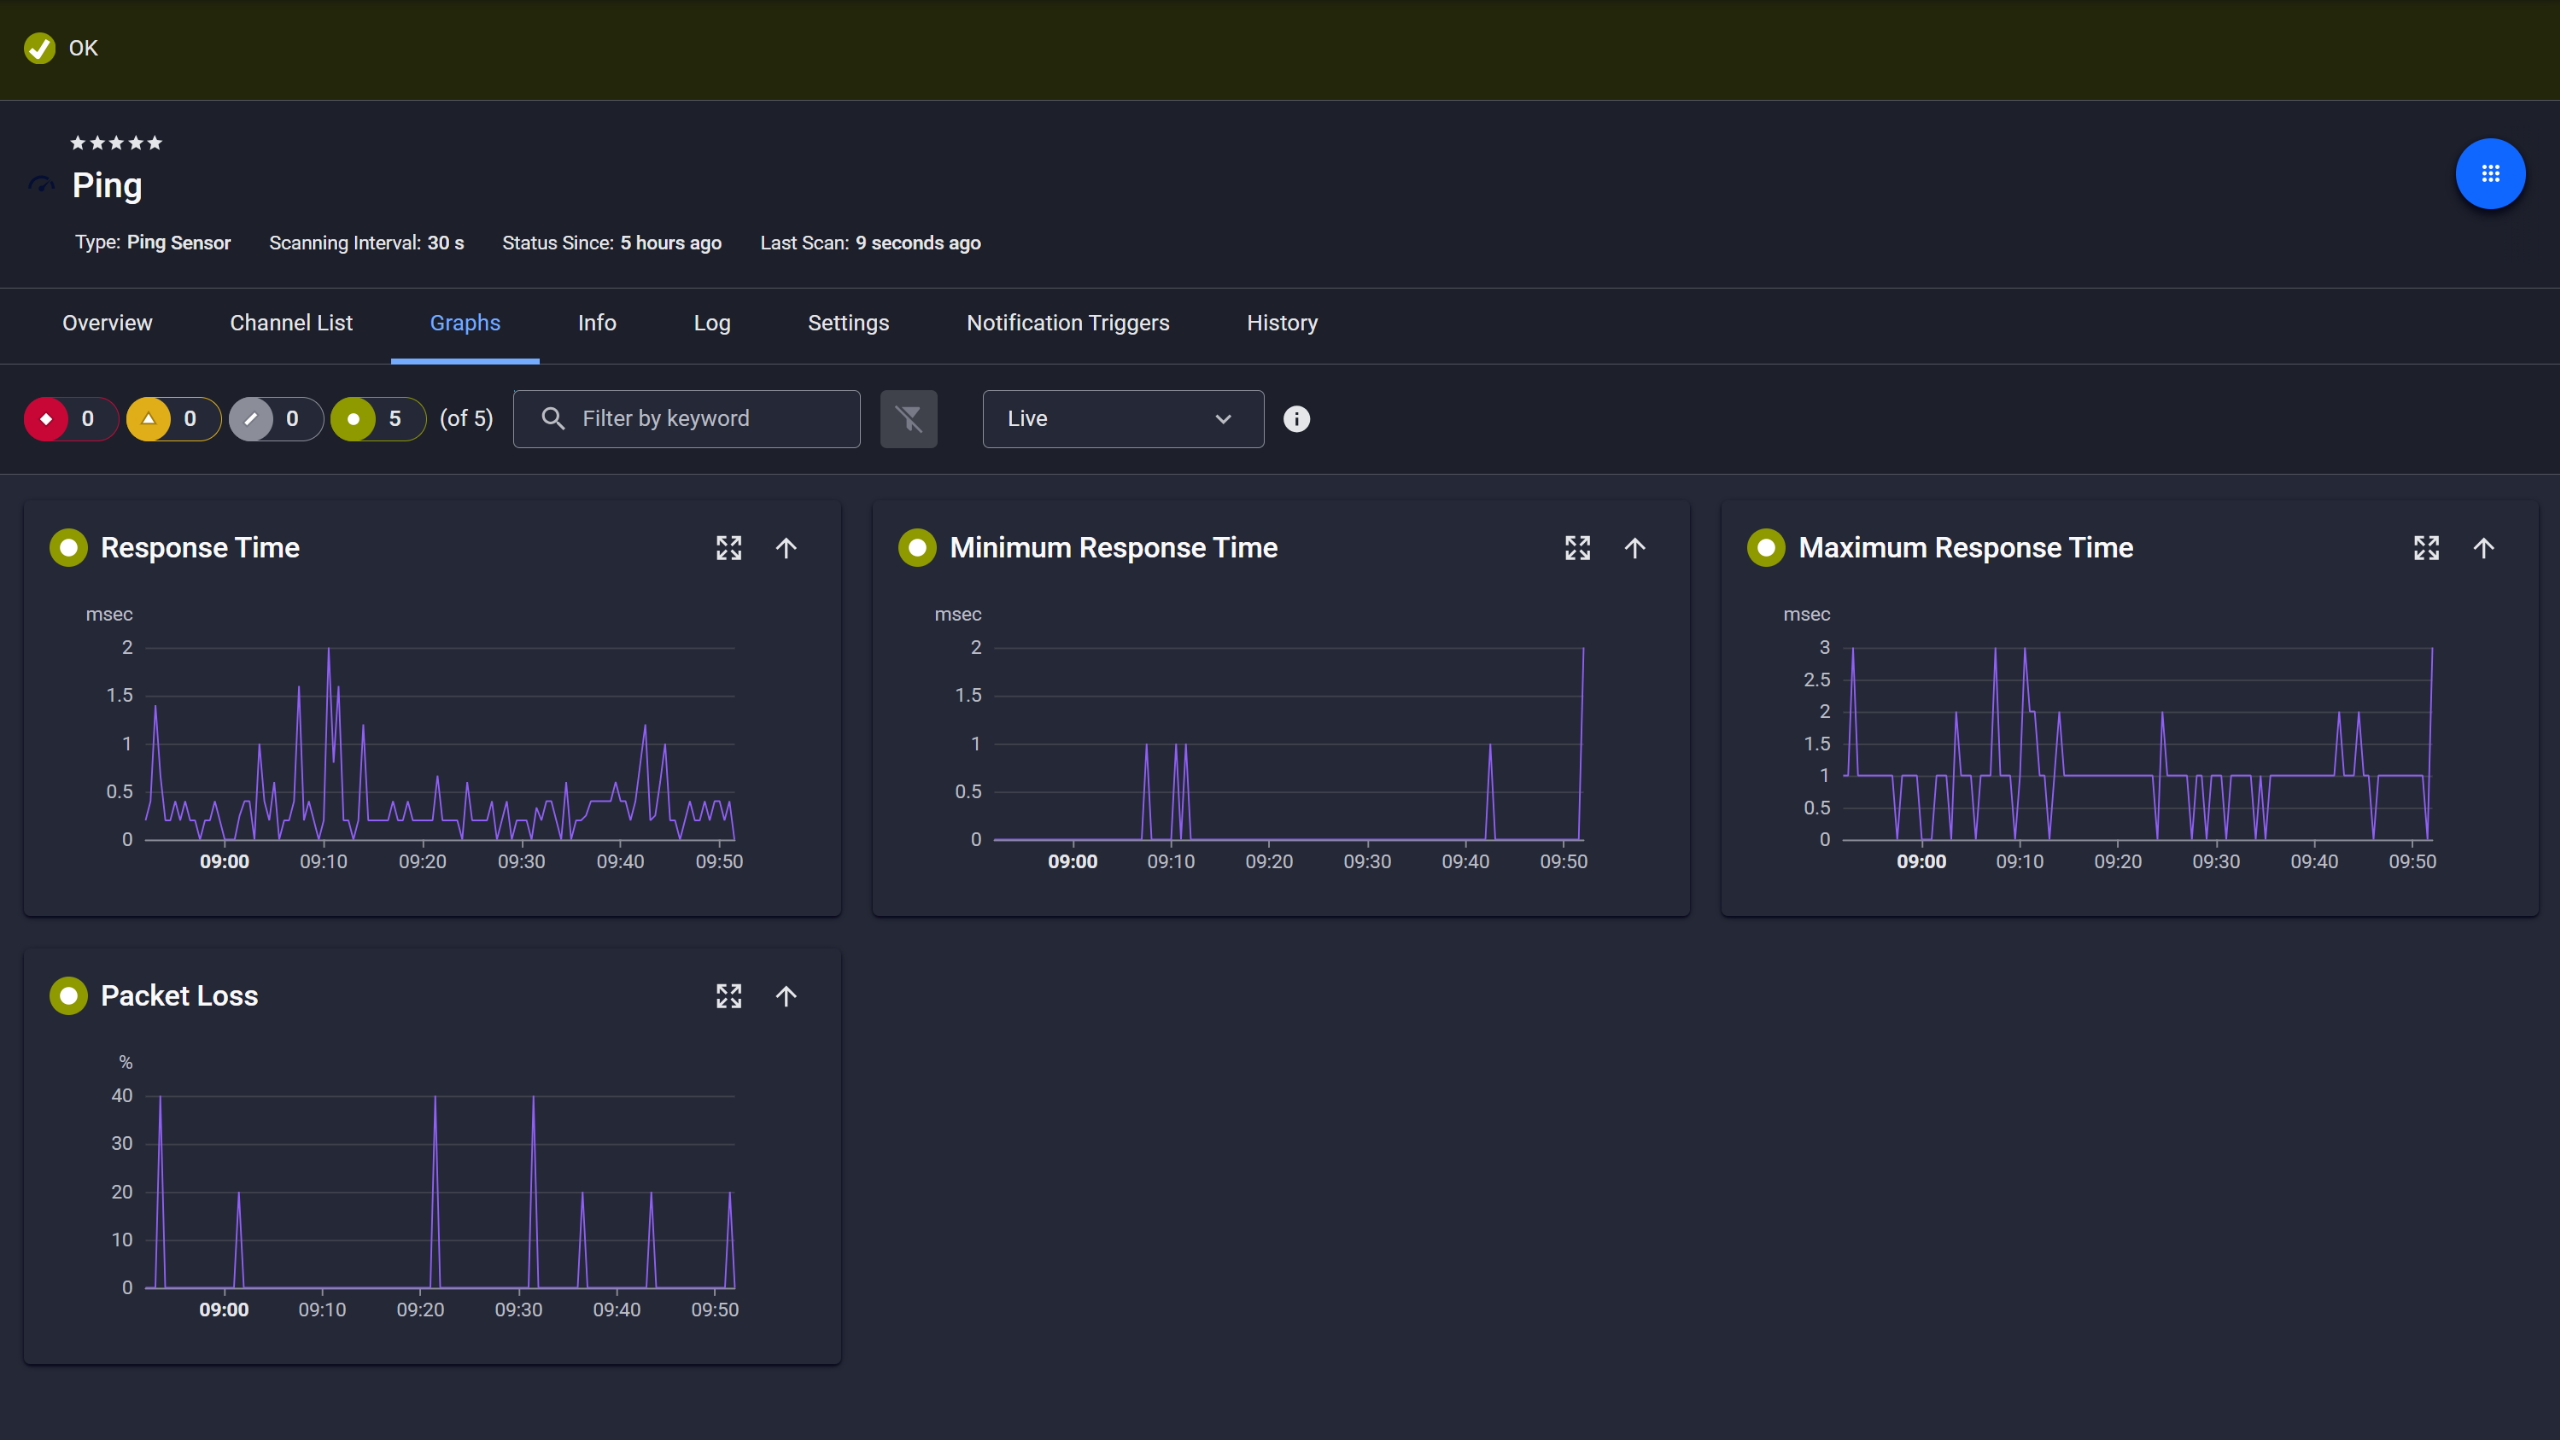
Ping response and packet loss

PRTG reports list showing scheduled monitoring reports with run times and sensor counts

Scheduled reports, always on time

How PRTG Analyzes Network Protocol Traffic 

PRTG uses two distinct methods to capture and analyze protocol-level traffic data. The right choice depends on whether your network devices support flow export and what segment of traffic you need to cover. Here's what each method does and where it applies.

xFlow Data Collection

With flow monitoring, the network device (a router, switch, or firewall) generates a flow record for each traffic flow it handles and exports it to PRTG. Each record includes source and destination IP, port, protocol, byte count, and timing. Packet count too, though that one's less useful day to day. PRTG acts as the flow collector, aggregating this into sensor data and Toplists. 

Setup requires configuring the exporter on the device to point to the PRTG probe's IP and port, then adding the corresponding sensor in PRTG. NetFlow v5/v9, jFlow, sFlow, and IPFIX are all supported. Most enterprise routers, switches, and firewalls from Cisco, Juniper, Palo Alto, and Fortinet support at least one of these natively. PRTG includes basic and custom sensor variants. The custom version lets you define your own channel groupings.

Packet Header Analysis  

PRTG's Packet Sniffer sensor is the option for network segments or devices that don't support flow export. It monitors traffic on the network interface of the PRTG probe system, capturing and analyzing packet headers from data packets (source/destination IP, port, and protocol) without inspecting or storing payload data. Captured data is header-level metadata only; it doesn't store or replay raw network sessions. It's not a substitute for a dedicated packet analyzer. Placement matters here. The sensor only sees traffic passing through the probe's own interface, covering the local segment of the probe machine, not remote segments. A Packet Sniffer (Custom) variant lets you define custom channel groupings instead of using the preconfigured defaults.

Traffic Toplists

Both xFlow sensors and the Packet Sniffer generate three preconfigured Toplists: Top Talkers (bandwidth usage by IP address), Top Connections (bandwidth usage by connection pair), and Top Protocols (bandwidth usage by protocol). These update continuously and are the core of PRTG's traffic analysis capabilities. You get a ranked view of traffic and a clear starting point for network troubleshooting without writing queries or running scripts.

Device Compatibility  

PRTG's flow monitoring works with any device that exports NetFlow v5/v9, jFlow, sFlow, or IPFIX, which covers the vast majority of enterprise routers, switches, and firewalls. The Packet Sniffer sensor runs on the Windows-based PRTG probe system and supports Ethernet and Wi-Fi interfaces. At the classification level, PRTG identifies protocols including TCP, UDP, ICMP, HTTP, HTTPS, DNS, FTP, and other well-known protocols and port assignments present in flow records. Protocol identification is based on what the exporting device includes in the flow record; PRTG does not perform independent deep packet inspection of application-layer content.

free downLoad

Network Protocol Analyzer: PRTG vs. Manual Traffic Analysis

FEATURE

Without PRTG

Without PRTG

With PRTG

With PRTG

Traffic breakdown by IP, connection, protocol

Without PRTG
not included

Lorem ipsum dolor sit amet, consetetur sadipscing elitr, sed diam nonumy eirmod tempor

With PRTG
included

Continuous Toplists: Top Talkers, Top Connections, Top Protocols

Protocol distribution

Without PRTG
not included

Lorem ipsum dolor sit amet, consetetur sadipscing elitr, sed diam nonumy eirmod tempor

With PRTG
included

Always-on protocol breakdown across all monitored interfaces

Historical traffic trends

Without PRTG
not included

Lorem ipsum dolor sit amet, consetetur sadipscing elitr, sed diam nonumy eirmod tempor

With PRTG
included

Persistent time-series data, configurable weeks or months of history

Alerting on traffic behavior

Without PRTG
not included

Lorem ipsum dolor sit amet, consetetur sadipscing elitr, sed diam nonumy eirmod tempor

With PRTG
included

Threshold-based alerts per sensor channel

Capacity planning data

Without PRTG
not included

Spreadsheets assembled from manual samples

With PRTG
included

Scheduled reports generated automatically and exportable

free downLoad

“We strive to equip our systems with state-of-the-art technology to safeguard our educational practices for the future. Part of this includes ensuring that all our systems run smoothly at all times. On any given day, we rarely have time to keep an eye on all our systems. We therefore decided to monitor our school’s IT environment with a centralized network monitoring tool.”

Stefan Roschewitz, IT administrator
BBS Holzminden

“We want to include the tool in our set of solutions in order to solve problems more proactively in our technology infrastructure. PRTG has exceeded all our expectations because it is a reliable, extremely easy-to-use solution. There is no doubt that it lives up to the renowned quality of German technology.”

Esbin Saúl Lázaro García, IT Infrastructure and Security Engineer
Hospital El Pilar

“The reactivity, know-how, and technical solutions of Paessler are outstanding in every situation. For me, no monitoring tool compares to PRTG.”

Andreas Reimann, Senior Networking Communication Architect
Zurich Airport

Paessler PRTG Network Monitor licenses & pricing

Choose the PRTG Network Monitor subscription that's best for you.

License NameLicense descriptionPriceLicense DetailsGet startedPricing Details
PRTG 500$200per month paid annuallyBuy nowBuy now

Enough to monitor multiple aspects of 50 devices

PRTG 1000$358per month paid annuallyBuy nowBuy now

Enough to monitor multiple aspects of 100 devices

PRTG 2500$742per month paid annuallyBuy nowBuy now

Enough to monitor multiple aspects of 250 devices

PRTG 5000$1,300per month paid annuallyBuy nowBuy now

Enough to monitor multiple aspects of 500 devices

PRTG 10000$1,642per month paid annuallyBuy nowBuy now

Enough to monitor multiple aspects of 1000 devices

Over 100,000 Customers Worldwide Love Paessler  

customer success stories

 Network Protocol Analyzer: Frequently Asked Questions


What's the difference between packet sniffing and flow monitoring, and which should I use?

Both give you traffic breakdowns by IP address, connection pair, and protocol, but they work differently. Flow monitoring relies on your network devices exporting flow records (NetFlow, sFlow, jFlow, IPFIX) to PRTG. It covers all traffic those devices handle and is the right starting point for most environments. The Packet Sniffer sensor monitors traffic on the PRTG probe's own network interface and works best for local segment coverage when flow export isn't an option. If your devices support flow export, start there.

Does PRTG replace tools like Wireshark, or do they serve different purposes?

They serve different purposes. Wireshark is an open-source packet analyzer built for deep, manual inspection: decoding individual network packets, examining payload content, and debugging specific protocol behavior. PRTG is a network monitoring tool and traffic analyzer that runs continuously across your infrastructure without decoding payloads or storing raw captures. Use PRTG to identify network issues and locate the source; use Wireshark to go deeper once you know where to look.

What network devices do I need to collect flow data with PRTG?

Any router, switch, or firewall that can export NetFlow v5/v9, jFlow, sFlow, or IPFIX will work. This covers most enterprise equipment from Cisco, Juniper, Palo Alto, Fortinet, and others. You configure the flow exporter on the device to send data to the PRTG probe's IP address and port, then add the corresponding sensor in PRTG. The Packet Sniffer covers the probe's local segment if flow export isn't an option.

Can PRTG monitor protocol traffic on wireless networks?

Yes. Flow monitoring works on Wi-Fi networks as long as your wireless infrastructure (access points, controllers, or the upstream switches and firewalls) supports flow export. The Packet Sniffer sensor can also monitor Wi-Fi interfaces on the PRTG probe system directly. What's available depends on your specific hardware and whether it supports a flow protocol.

How does PRTG handle encrypted traffic in flow monitoring?

PRTG analyzes flow metadata, not packet content, so encryption doesn't block traffic pattern analysis. You can still see which IP addresses are communicating, which ports and protocols are in use, and how much bandwidth is consumed, even when the payload is encrypted. PRTG can't inspect or decode the contents of encrypted sessions. For troubleshooting and traffic analysis, flow-level data is typically sufficient.

How does PRTG scale for multi-site or data center environments?

PRTG uses remote probes for distributed monitoring. Each probe collects data locally, including flow data from devices at that site, and reports back to the central PRTG server. This makes it practical for multi-site setups, data centers, and remote locations without routing all traffic to a central collection point. Scalability is tied to your license tier, which is based on sensor count.

Can PRTG monitor IoT devices and non-standard network endpoints?

If an IoT device or non-standard endpoint is on a segment where flow data is being collected and it generates network traffic, it'll appear in the flow data as a source or destination. PRTG doesn't require an agent on the endpoint for traffic analysis. For more specific monitoring of IoT or embedded systems, PRTG also supports SNMP and other protocols, depending on what the device exposes on the network.

What is a sensor in PRTG, and how many do I need for protocol monitoring?

In PRTG, a sensor monitors one specific data source or metric. For protocol analysis, you typically need one flow sensor per interface or device you want to collect data from, for example, one NetFlow sensor per router interface that exports flow data. Most environments use a handful of sensors per device across all monitoring use cases; the exact count depends on what you're monitoring. PRTG is licensed by sensor count, so the number of flow and Packet Sniffer sensors you add affects your license tier directly. Current pricing is available at paessler.com/pricing.

Paessler PRTG

Paessler PRTG

Network Monitoring Software – Version 26.1.116.1532 (February 9th, 2026)

Hosting icon

Hosting

Download for Windows and cloud-based version PRTG Hosted Monitor available

Languages icon

Languages

English, German, Spanish, French, Portuguese, Dutch, Russian, Japanese, and Simplified Chinese

test

Monitor everything

Network devices, bandwidth, servers, applications, virtual environments, remote systems, IoT, and more

test

Pricing

Choose the PRTG Network Monitor subscription that's best for you

Discover more monitoring insights and stories

Content illustration

Powerful stories from the monitoring world

  • What Is Packet Sniffing? – IT Explained
  • How to identify unknown devices on your network: A complete guide
  • How to Look at Network Traffic: Essential Tools and Methods for ...
Support illustration

Resources to master your monitoring challenges

  • PRTG Manual: Packet Sniffer Sensor - Paessler
  • PRTG Manual: Monitoring Bandwidth via Packet Sniffing - Paessler
  • PRTG Manual: Available Sensor Types - Paessler
Solution illustration

Solutions for all your monitoring needs

  • Network Protocol Analyzer
  • Packet Sniffer
  • Protocol Monitoring
PRTG Logo

Start Monitoring with PRTG and see how it can make your network more reliable and your job easier.

Free download
PRODUCT OVERVIEW

Products

  • Paessler PRTG
    Paessler PRTGMonitor your whole IT infrastructure
    • PRTG Network Monitor
    • PRTG Enterprise Monitor
    • PRTG Hosted Monitor
    • PRTG UVexplorer
    • PRTG extensions
      Extensions for Paessler PRTGExtend your monitoring to a new level
  • Icon Features
    FeaturesExplore all monitoring features

Monitoring with PRTG

  • Network monitoring
  • Bandwidth monitoring
  • SNMP monitoring
  • Network mapping
  • Wi-Fi monitoring
  • Server monitoring
  • Network traffic analyzer
  • NetFlow monitoring
  • Syslog server

Useful Links

  • PRTG Manual
  • Knowledge Base
  • Customer Success Stories
  • About Paessler
  • Subscribe to newsletter
  • PRTG Support
  • PRTG Consulting
  • PRTG Feedback & Roadmap

Contact

Paessler GmbH
Thurn-und-Taxis-Str. 14, 
90411 Nuremberg 
Germany

[email protected]

+49 911 93775-0

  • Contact us
©2026 Paessler GmbHTerms & ConditionsPrivacy PolicyImprintReport VulnerabilityDownload & InstallSitemap
Manual License Activation Manual License Activation Manual License Activation