Custom alerts and data visualization let you quickly identify and prevent network performance issues, anomalies, and potential outages.
With Paessler PRTG, you get complete visibility into every part of your network, helping you truly understand what’s happening across your entire infrastructure. PRTG pulls data from all your network devices, applications, and cloud services, and gives you a clear, comprehensive picture of your network's health and performance.
Keep a close eye on your critical network components in real time. By using smart, sensor-driven technology, PRTG spots potential bottlenecks and anomalies before they become big problems.
This proactive monitoring helps you minimize downtime and avoid costly service disruptions.
User-friendly dashboards in PRTG are fully customizable, and allow you to display the network performance metrics that are most important to your business.
Whether it’s tracking latency, bandwidth usage, or device status, you’ll be able to identify and address issues quickly, helping you allocate resources more efficiently.
The alerting system in PRTG is highly customizable so that you will only be notified about issues that matter.
You can set up alerts for specific thresholds or unusual activity to make sure the right people on your team are informed immediately. This means quicker responses and faster resolutions.
PRTG doesn’t just provide real-time monitoring; it also stores historical data for you to analyze.
With these insights, you can track long-term trends, pinpoint recurring issues, and make data-driven decisions to optimize your network over time.
Diagnose network issues by continuously tracking device states, traffic flows, and latency. Show bandwidth usage, uptime, and other key metrics in real time. Visualize monitoring data in clear graphs and dashboards to identify problems more easily. Gain the overview you need to troubleshoot network slowdowns, outages, and performance bottlenecks.

Device tree view of the complete monitoring setup

Custom PRTG dashboard for keeping an eye on the entire IT infrastructure

Live traffic data graph in PRTG
“All-around winning
network monitor”
“The real beauty of PRTG is the endless possibilities it offers”
“PRTG Network Monitor
is very hard to beat”
PRTG comes with more than 250 native sensor types for monitoring your entire on-premises, cloud, and hybrid cloud environment out of the box. Check out some examples below!
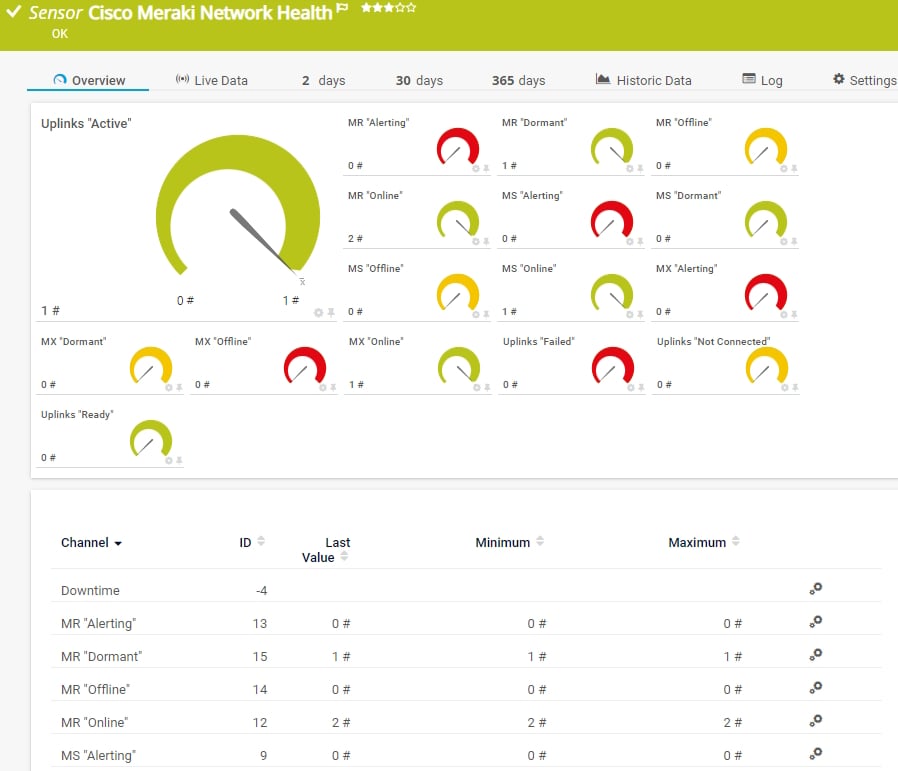
The Cisco Meraki Network Health sensor monitors the health of Cisco Meraki network devices via the Cisco Meraki Dashboard API. It can show the following:
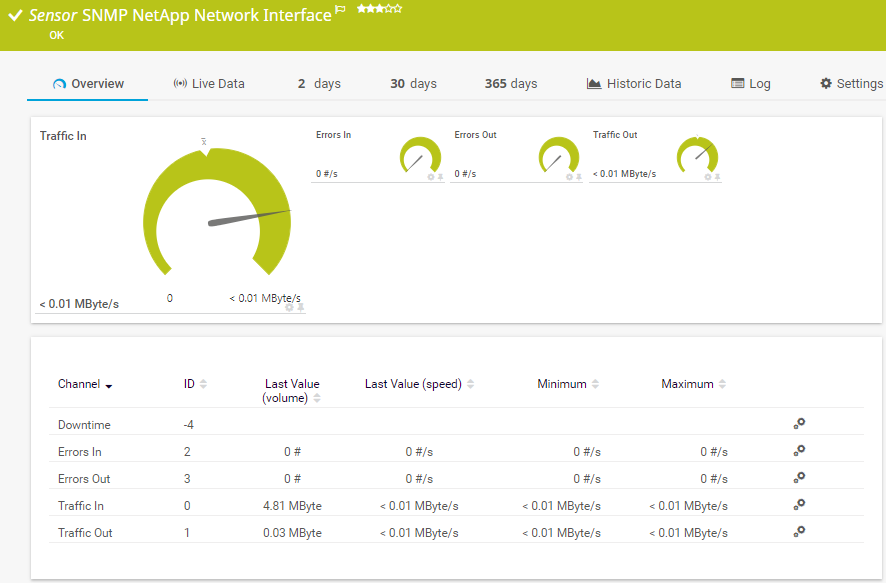
The SNMP NetApp Network Interface sensor monitors a network card of a NetApp storage system. It can show the following:
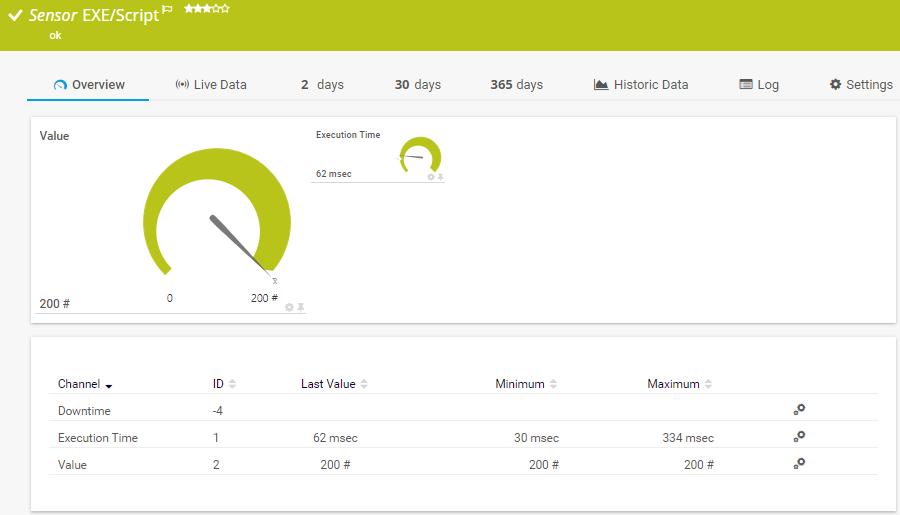
The EXE/Script sensor runs an executable file (.exe) or a script (batch file, VBScript, PowerShell) on the probe system. This option is available as part of the PRTG API. It can show the following:
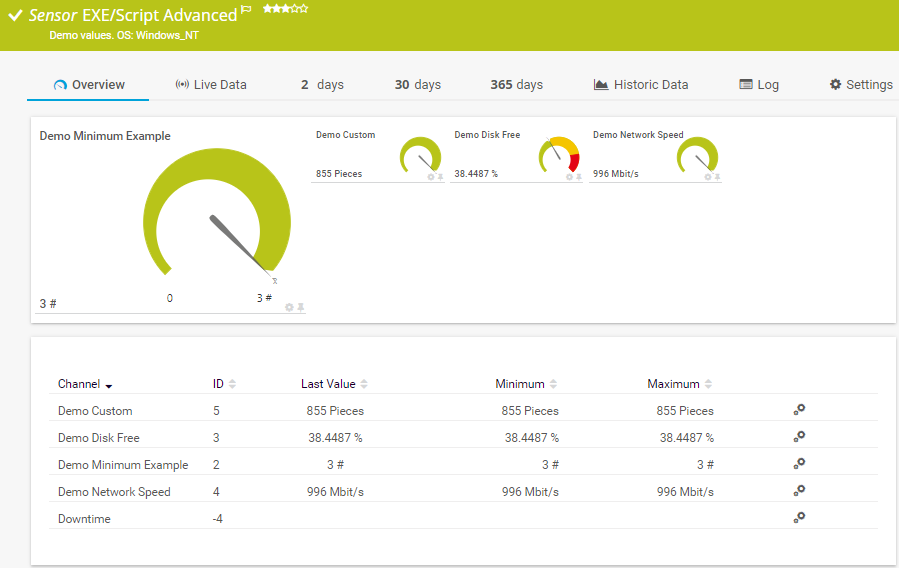
The EXE/Script Advanced sensor runs an executable file (.exe) or a script (batch file, VBScript, PowerShell) on the probe system. This option is available as part of the PRTG API. It can show the following:
See the PRTG Manual for a list of all available sensor types.

Custom alerts and data visualization let you quickly identify and prevent network performance issues, anomalies, and potential outages.
PRTG is set up in a matter of minutes and can be used on a wide variety of mobile devices.

Paessler is a certified partner in the Amazon Web Services ecosystem, which includes a growing community of software vendors who are building solutions on cloud computing.
What does this mean for you?
Partnering with innovative IT vendors, Paessler unleashes synergies to create
new and additional benefits for joined customers.
Combining PRTG’s broad monitoring feature set with IP Fabric’s automated network assurance creates a new level of network visibility and reliability.
Integrating monitoring results from PRTG into NetBrain maps makes the foundation for network automation.
Paessler and Plixer provide a complete solution adding flow and metadata analysis to a powerful network monitoring tool.
Real-time notifications mean faster troubleshooting so that you can act before more serious issues occur.
Network Monitoring Software – Version 26.1.116.1532 (February 9th, 2026)
Download for Windows and cloud-based version PRTG Hosted Monitor available
English, German, Spanish, French, Portuguese, Dutch, Russian, Japanese, and Simplified Chinese
Network devices, bandwidth, servers, applications, virtual environments, remote systems, IoT, and more
Choose the PRTG Network Monitor subscription that's best for you


Network observability refers to the ability to monitor and understand the state of your network infrastructure by collecting and correlating data from various network components. It involves analyzing telemetry data like logs, metrics, and traces to gain real-time insights into network performance, troubleshoot issues, and optimize operations. Paessler PRTG enables network observability by providing comprehensive visibility into your network’s health and performance.
Network observability helps IT teams detect and resolve issues faster, improve performance, and optimize network operations. Unlike traditional network monitoring, which only alerts you to problems, observability provides deep insights into network behavior, allowing for better troubleshooting, root cause analysis, and overall network optimization. With observability features in PRTG, you can visualize network traffic, identify bottlenecks, and monitor critical performance metrics in real-time.
PRTG supports network observability by providing real-time monitoring of your entire network infrastructure, including cloud environments, on-premises systems, and hybrid cloud setups. It gathers telemetry data from devices, apps, and network traffic, visualizing key performance metrics through customizable dashboards. PRTG also offers advanced alerting, anomaly detection, and end-to-end visibility. This allows you to identify and resolve network issues before they impact performance or cause downtime.
PRTG collects a wide range of data, including bandwidth usage, latency, device health, application performance metrics, and more. It pulls telemetry data from network devices, cloud environments, virtual machines, and applications, providing comprehensive visibility into both the infrastructure and network traffic. This data is displayed in real-time and stored for historical analysis.
PRTG helps reduce MTTR by providing actionable insights into network performance issues. Its real-time alerts notify you of performance degradations or anomalies as soon as they happen. With customizable dashboards and in-depth data visualization, you can identify the root cause of issues and minimize downtime. Included automation and alerting features further streamline troubleshooting efforts and lead to quicker resolution times.
Yes, PRTG is well suited for multi-cloud and hybrid cloud environments. It offers the flexibility to monitor connectivity and performance across on-premises, cloud-native, and SaaS environments. Our observability platform tracks network traffic, application performance, and cloud network metrics for full-stack observability. This allows IT teams to maintain end-to-end visibility and optimize workloads across diverse infrastructures without losing sight of potential blind spots.
In PRTG, “sensors” are the basic monitoring elements. One sensor usually monitors one measured value in your network, for example the traffic of a switch port, the CPU load of a server, or the free space on a disk drive. On average, you need about 5-10 sensors per device or one sensor per switch port.
Paessler conducted trials in over 600 IT departments worldwide to tune its network monitoring software closer to the needs of sysadmins. The result of the survey: over 95% of the participants would recommend PRTG – or already have.

Paessler PRTG is used by companies of all sizes. Sysadmins love PRTG because it makes their job a whole lot easier.
Bandwidth, servers, virtual environments, websites, VoIP services – PRTG keeps an eye on your entire network.
Everyone has different monitoring needs. That’s why we let you try PRTG for free.