Custom alerts and data visualization let you quickly identify and prevent network performance issues.
Because enterprise networks have so many moving parts – network devices like routers or firewalls and other hardware, applications, processes, and services – diagnosing the cause of a performance issue can feel like looking for a needle in a haystack.
We've all been there. Hours (or days) tracking down a failed switch, or working out why a critical app isn't running properly… while busy colleagues sit around and wait, and your boss breathes down your neck.
Paessler PRTG monitors traffic across your entire network and sniffs out issues before your system crashes, saving you time, stress, and frustration.

Don't tear your hair out trying to get to the root of a network problem. Whether it's a glitchy protocol, an issue with data packet capture, IP addresses, network security, or something else, our network sniffing tool alerts you immediately and shows you what and where to check, so you can fix things double quick.
Keep an eye on your Ethernet, Wi-Fi, or virtual network from one place. Alongside monitoring traffic, PRTG has preconfigured sensors for servers, routers, switches, and major database and cloud environments. Plus, it grows with your network, no matter how complex it gets.
Yes, really. Access PRTG's full feature set – including network management, unlimited multi-platform probes for Mac- and Linux-based monitoring, the customizable alerting and notification system, reporting, and all of our 250+ preconfigured sensors – for 30 days, 100% free.
Diagnose network issues by continuously tracking data packets. Show traffic volume, the sources of your network traffic, and other key metrics in real time. Visualize monitoring data in clear graphs and dashboards to identify problems more easily. Gain the visibility you need to troubleshoot dips in your network's performance.

Device tree view of the complete monitoring setup
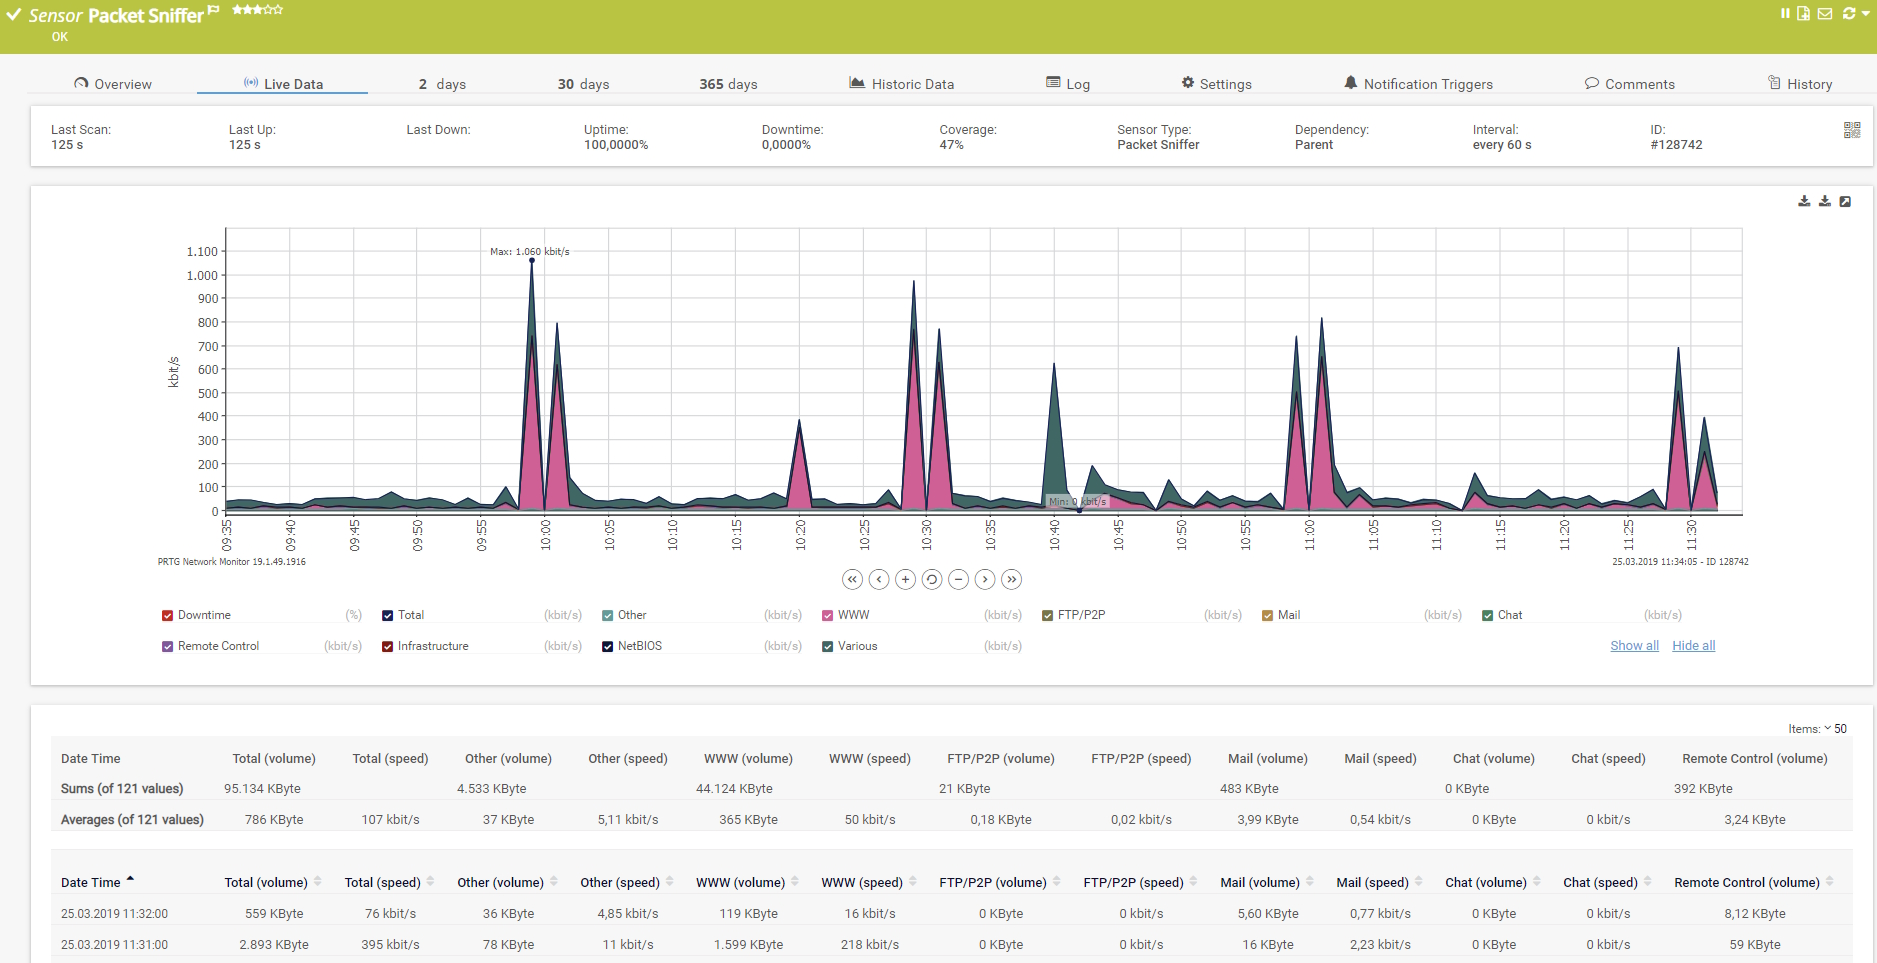
Live data graph of a Packet Sniffer sensor
Packet Sniffer sensor in PRTG
“All-around winning
network monitor”
“The real beauty of PRTG is the endless possibilities it offers”
“PRTG Network Monitor
is very hard to beat”
PRTG comes with more than 250 native sensor types for monitoring your entire on-premises, cloud, and hybrid cloud environment out of the box. Check out some examples below!
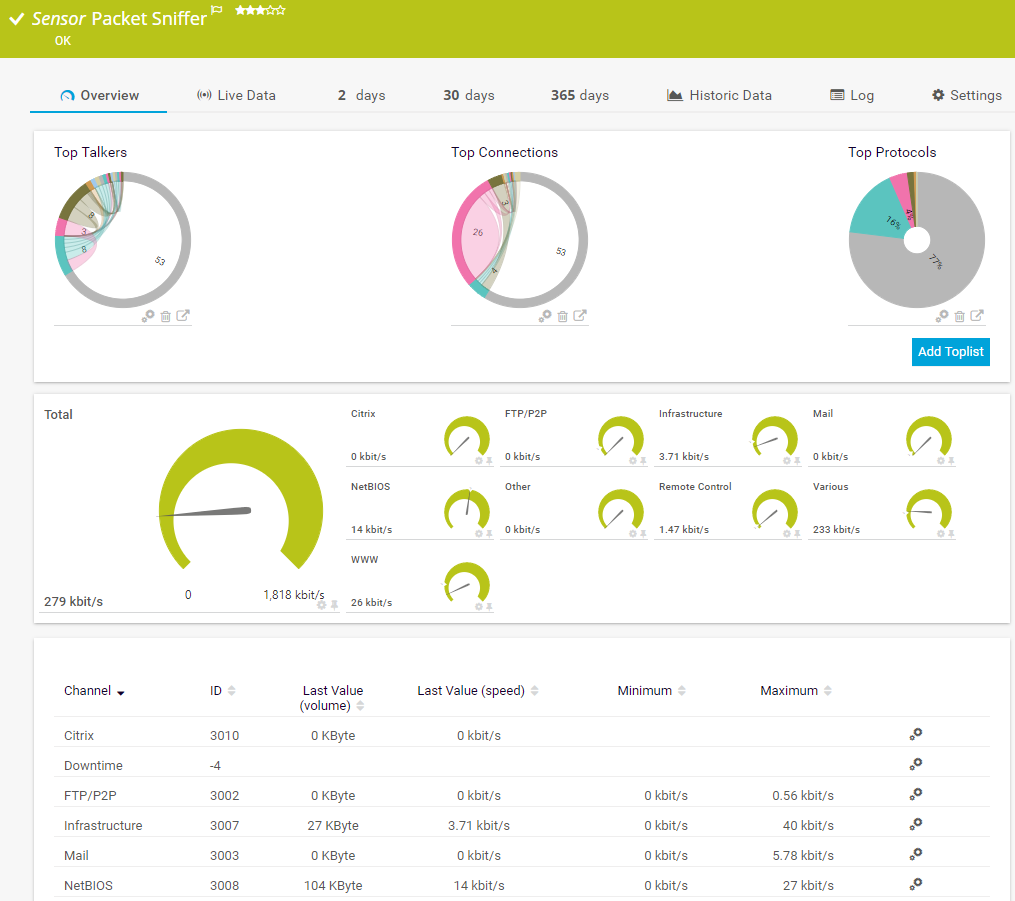
The Packet Sniffer sensor monitors the headers of data packets that pass a local network card using a built-in packet sniffer. You can choose from predefined channels. It can show the following and more:
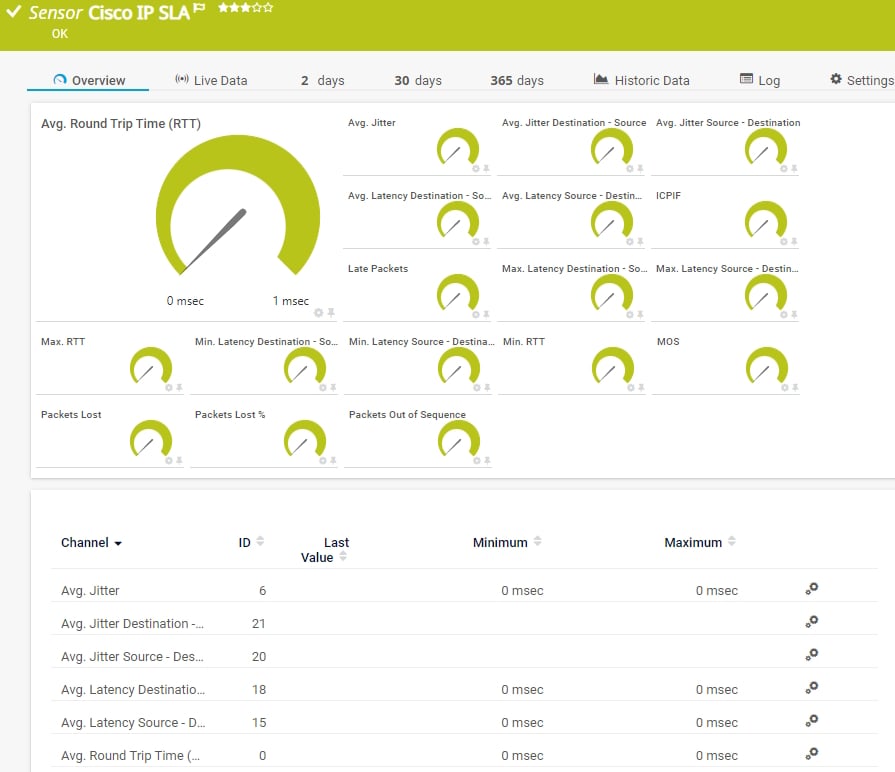
The Cisco IP SLA sensor monitors Voice over IP (VoIP) network parameters using IP service level agreements (SLA) from Cisco. It can show the following:
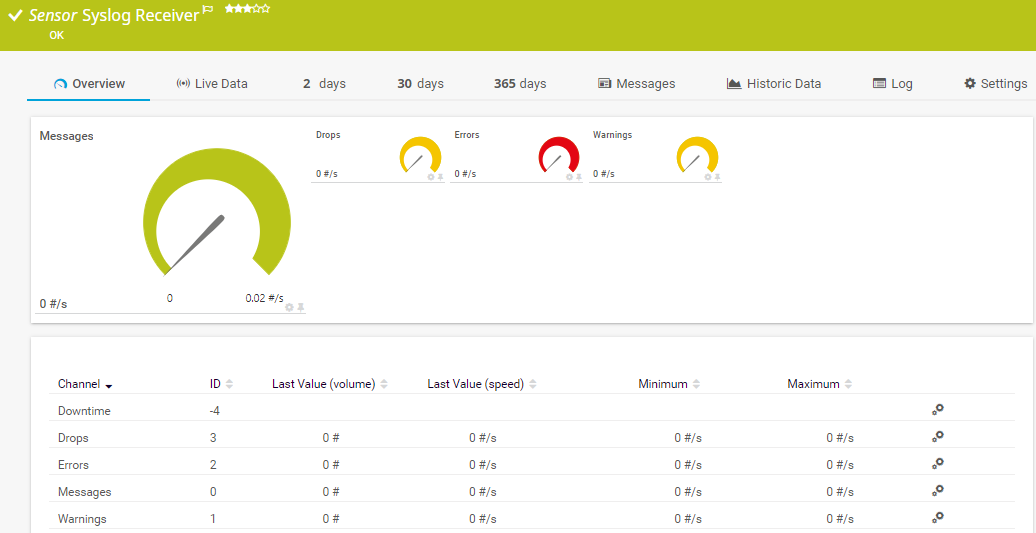
The Syslog Receiver sensor receives and analyzes Syslog messages. It can show the following:
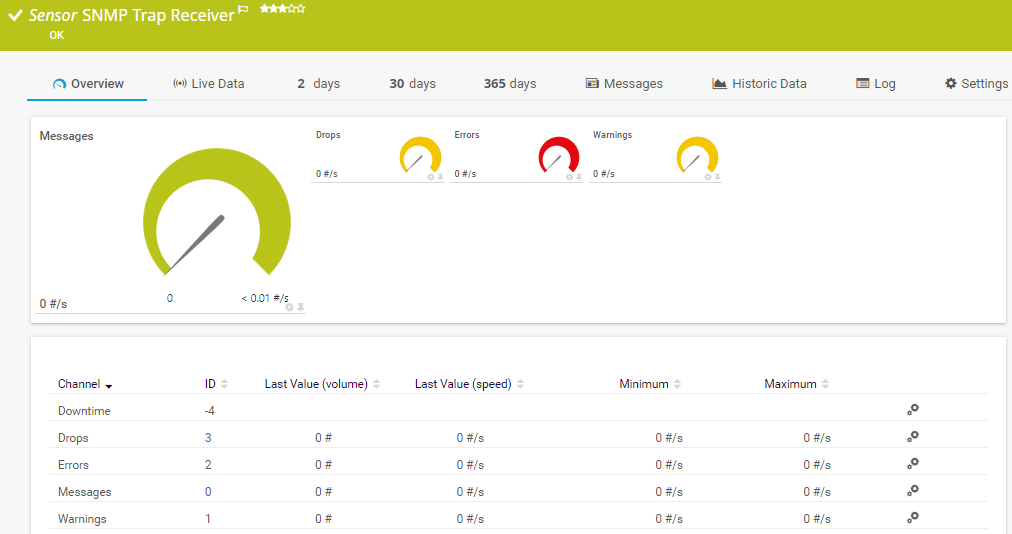
The SNMP Trap Receiver sensor receives and analyzes Simple Network Management Protocol (SNMP) traps. . It can show the following:
See the PRTG Manual for a list of all available sensor types.

Custom alerts and data visualization let you quickly identify and prevent network performance issues.
PRTG is set up in a matter of minutes and can be used on a wide variety of mobile devices.


“Excellent tool for detailed monitoring. Alarms and notifications work greatly. Equipment addition is straight forward and server initial setup is very easy. ...feel safe to purchase it if you intend to monitor a large networking landscape.”
Partnering with innovative IT vendors, Paessler unleashes synergies to create
new and additional benefits for joined customers.
baramundi and PRTG create a secure, reliable and powerful IT infrastructure where you have everything under control - from the traffic in your firewall to the configuration of your clients.
With ScriptRunner Paessler integrates a powerful event automation platform into PRTG Network Monitor.
UVexplorer integrates tightly with PRTG to bring fast and accurate network discovery, detailed device inventory, and automatic network mapping to the PRTG platform.
Real-time notifications mean faster troubleshooting so that you can act before more serious issues occur.
Network Monitoring Software – Version 26.1.116.1532 (February 9th, 2026)
Download for Windows and cloud-based version PRTG Hosted Monitor available
English, German, Spanish, French, Portuguese, Dutch, Russian, Japanese, and Simplified Chinese
Network devices, bandwidth, servers, applications, virtual environments, remote systems, IoT, and more
Choose the PRTG Network Monitor subscription that's best for you

A network sniffer (also known as network analyzer or packet analyzer) is a software that can intercept and log traffic on a network. The tool captures each packet that flows across the infrastructure and analyzes its content.
PRTG is a proprietary software that shows you, as a network sniffing tool, how much traffic is flowing through your network and where it's coming from in real time. It logs every data packet and analyzes its content, so it's quick and easy to track how much bandwidth you're using and troubleshoot performance issues.
Because a network sniffer helps you identify and address network performance issues before it's too late. It's like having a personal guard dog with a highly sensitive nose, continuously sniffing for signs of trouble. But a network sniffer isn't just for troubleshooting. It's also useful for the following:
The simple answer is: it depends (and no, we're not trying to sidestep the question). The free network sniffing tool is perfect for diagnosing a specific problem, or if you have a small network and only need to monitor traffic from limited sources. But if you have a larger, more complex network and need comprehensive monitoring, alerting, and reporting, the full version is probably the better choice. Still unsure? Try the full version for 30 days, completely free. No catches.
We're so confident you'll love PRTG that it comes with a free, no-obligation 30-day trial. Should you decide to keep using it as your future network sniffer and monitoring tool, you can find our pricing list here.
In PRTG, “sensors” are the basic monitoring elements. One sensor usually monitors one measured value in your network, for example the traffic of a switch port, the CPU load of a server, or the free space on a disk drive. On average, you need about 5-10 sensors per device or one sensor per switch port.
Paessler conducted trials in over 600 IT departments worldwide to tune its network monitoring software closer to the needs of sysadmins. The result of the survey: over 95% of the participants would recommend PRTG – or already have.

Paessler PRTG is used by companies of all sizes. Sysadmins love PRTG because it makes their job a whole lot easier.
Bandwidth, servers, virtual environments, websites, VoIP services – PRTG keeps an eye on your entire network.
Everyone has different monitoring needs. That’s why we let you try PRTG for free.