• Company
    • About Us
    • Case Studies
    • Press Center
    • Careers
    • Blog
    • Contact us
  • Contact us
  • Login
 
  • English
    • Deutsch
    • Español
    • Français
    • Italiano
    • Português
Paessler
                    - The Monitoring Experts
  • Products
    • Paessler PRTG
      Paessler PRTGMonitor your whole IT infrastructure
      • PRTG Network Monitor
      • PRTG Enterprise Monitor
      • PRTG Hosted Monitor
      • PRTG UVexplorer
      • PRTG extensionsExtensions for Paessler PRTGExtend your monitoring to a new level
    • Icon Features
      FeaturesExplore all monitoring features
      • Maps & dashboards
      • Alerts & notifications
      • Multiple user interfaces
      • Distributed monitoring
      • Customizable reporting
  • Solutions
    • Industries
      IndustriesMonitor various industry sectors
      • Industrial
      • Healthcare
      • Data Center
      • Education
      • Finance
      • Government
    • IT Topics
      IT TopicsMonitor all areas of IT
      • Network Monitoring
      • Bandwidth Monitoring
      • SNMP Monitor
      • Network Mapping
      • WiFi Monitoring
      • Server Monitoring
  • Pricing
  • Resources
    • Getting Started
      Getting StartedModules for self-paced learning
    • How-to Guides
      How-to GuidesGet the most out of PRTG
    • Videos & Webinars
      Videos & WebinarsLearn from Paessler experts
    • IT  Knowledge
      IT KnowledgeExpand your IT knowledge
    • PRTG Manual
      PRTG ManualFull documentation
    • Knowledge Base
      Knowledge BaseShare community knowledge
    • PRTG Sensor Hub
      PRTG Sensor HubGet sensors, scripts & templates
    • Trainings
      PRTG TrainingLearn how to work with PRTG
  • Partners
    • Icon Handshake
      Become a PartnerFor resellers and channel partners
    • Icon MSP
      Become an MSPDeliver monitoring as a managed service
    • icon partner
      Partner PortalLog in to your partner account
    • Deal Registration
      Deal RegistrationRegister your sales opportunities
    • icon search
      Find a PartnerFind partners selling Paessler products
    • icon technology
      Technology AlliancesSee Paessler technology partnerships
    • Partner HubTools for Your Success
  • Company
    • About Us
    • Case Studies
    • Press Center
    • Careers
    • Blog
    • Contact us
  • Contact us
  • Login
  • English
    • Deutsch
    • Español
    • Français
    • Italiano
    • Português
  • Get a quote
  • Free trial
  1. Home>
  2. IT Topics>
  3. Cloud>
  4. Cloud Observability Tool

Cloud Observability with PRTG

Get real-time insights into your cloud infrastructure, applications, and services for faster troubleshooting and improved reliability

  • Obtain actionable data with comprehensive metrics, logs, and traces across your cloud environments
  • Visualize dependencies and workflows with customizable dashboards tailored to your needs
  • Reduce downtime with real-time alerts and root cause analysis
Free download
PRODUCT OVERVIEW

Our Users Give Top Ratings for Monitoring With Paessler PRTG

Gartner peer insights
spiceworks
G2
Capterra

PRTG cloud observability: What you will find on this page

Table of content

    PRTG makes cloud observability as easy as it gets

    Custom alerts and data visualization let you quickly identify and prevent performance issues.

    Free download
    PRODUCT OVERVIEW

    Optimize performance and prevent issues in your cloud environment

    Are you ready to detect problems faster, avoid downtime and maintain peak performance across your cloud services? Paessler PRTG enables you to optimize your infrastructure, improve application performance and ensure smooth operations - all through an easy-to-use platform that is tailored to your needs.

    Icon sensor

    Real-time monitoring

    Track key metrics, logs, and traces across your cloud environments to detect anomalies as they occur. Get instant alerts so you can respond before problems impact your users. Keep your infrastructure running smoothly by staying informed.

    Icon dashboard

    Custom dashboards

    Create personalized dashboards that visualize dependencies, workloads, and application performance. See everything at a glance and drill down to the details you need. Get the flexibility to monitor what matters most to you.

    Icon reports

    Automated reporting

    Schedule reports to analyze long-term performance trends and identify recurring problems. Use detailed data to improve efficiency and plan for future improvements. Easily generate insights and share them with your team for better decision-making.

    Icon integration

    Seamless integrations

    Connect PRTG to your existing cloud services, APM tools and third party platforms. Use APIs, OpenTelemetry and built-in sensors for a unified monitoring experience. Combine data from multiple sources to get a complete picture of your cloud infrastructure.

    What cloud observability looks like in PRTG

    Diagnose network issues by continuously tracking performance metrics. Show dependencies and other key metrics in real time. Visualize monitoring data in clear graphs and dashboards to identify problems more easily. Gain the overview you need to troubleshoot bottlenecks in cloud environments.

    PRTG Screenshot device tree view

    Device tree view of the complete monitoring setup

    PRTG screenshot map bandwidth monitoring

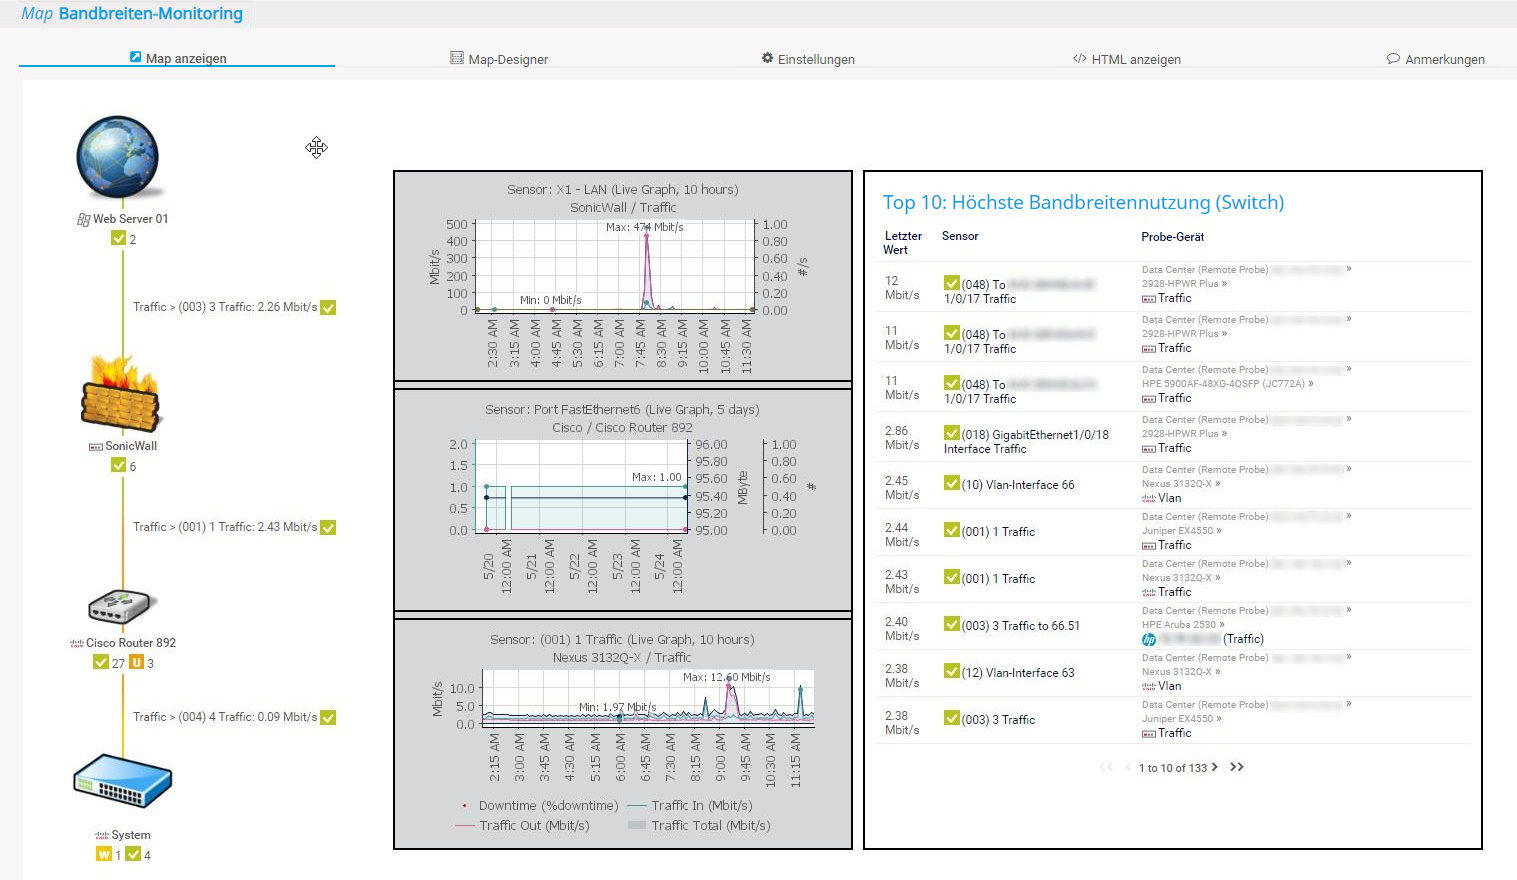
    Custom PRTG dashboard for keeping an eye on bandwidth usage

    PRTG screenshot graph live data traffic

    Live traffic data graph in PRTG

    Start monitoring cloud environments with PRTG and see how it can make your network more reliable and your job easier.

    Free download
    PRODUCT OVERVIEW

    IT experts agree: Paessler PRTG is a great solution for IT infrastructure monitoring

    PCMag

    “All-around winning
     network monitor”

    IT Brief

    “The real beauty of PRTG is the endless possibilities it offers”

    ITPro

    “PRTG Network Monitor 
    is very hard to beat”

    3 reasons why PRTG is the cloud observability tool of your choice

    Unexpected downtime, performance bottlenecks, and lack of visibility can make managing cloud environments frustrating. Without real-time data, identifying the root cause of a problem is guesswork. When cloud services slow down or fail, end users feel the impact immediately. PRTG helps you stay one step ahead by providing the right data at the right time - so you can prevent problems before they escalate.

    Icon secure access

    Secure access

    Monitor cloud services from anywhere with encrypted connections and role-based access control. Ensure that only authorized users have access to critical monitoring data. Protect your monitoring platform with built-in security features.

    Icon setup

    Quick setup

    Install PRTG in minutes and start monitoring your cloud environment without complex configuration. Use pre-configured sensors to instantly connect to cloud services. Spend less time on setup and more time optimizing performance.

    Icon support

    Outstanding support

    Reach out to a knowledgeable support team that helps you resolve issues quickly when you need help. Get expert guidance on setup, troubleshooting, and best practices. Rely on extensive documentation and an active user community for additional resources.

    Explore our preconfigured PRTG sensors for cloud observability

    PRTG comes with more than 250 native sensor types for monitoring your entire on-premises, cloud, and hybrid cloud environment out of the box. Check out some examples below!

    Cloud HTTP v2

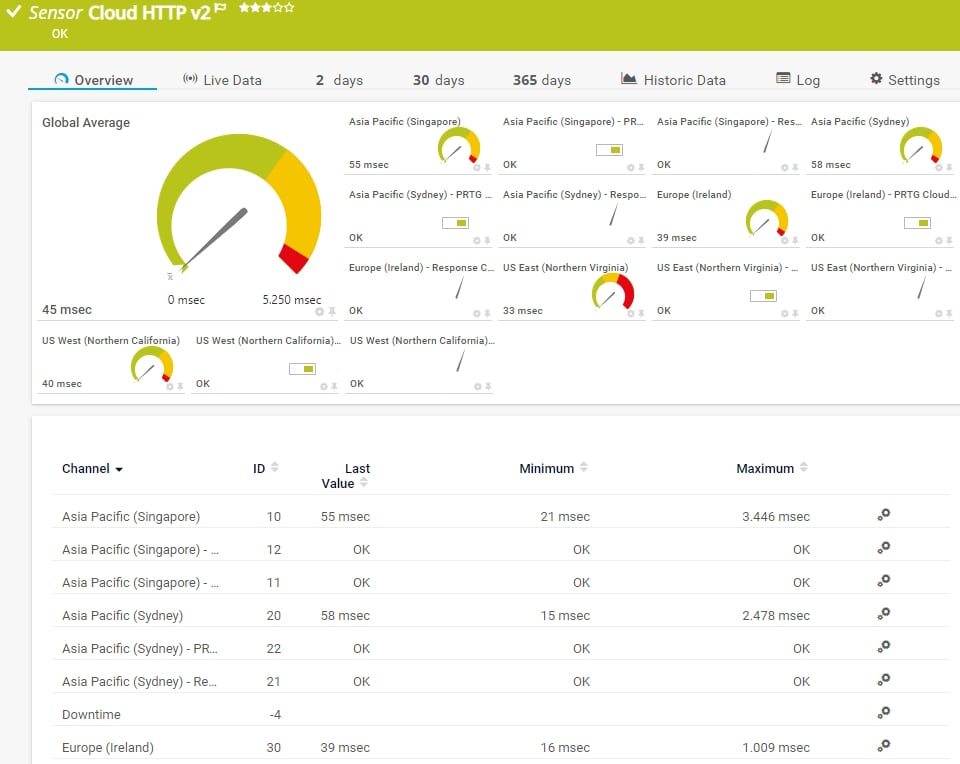
    The Cloud HTTP v2 sensor monitors the loading time of a web server via HTTP from different locations worldwide (Asia Pacific: Singapore,  Asia Pacific: Sydney, Europe: Ireland, US East: Northern Virginia,  US West: Northern California) via the PRTG Cloud. It can show the following:

    • Average global loading time
    • Response time of the target server at the location
    • Response code of the target server at the location
    • If the PRTG Cloud query was successful or not
    Cloud HTTP v2
    Cloud HTTP v2

    Cloud Ping v2

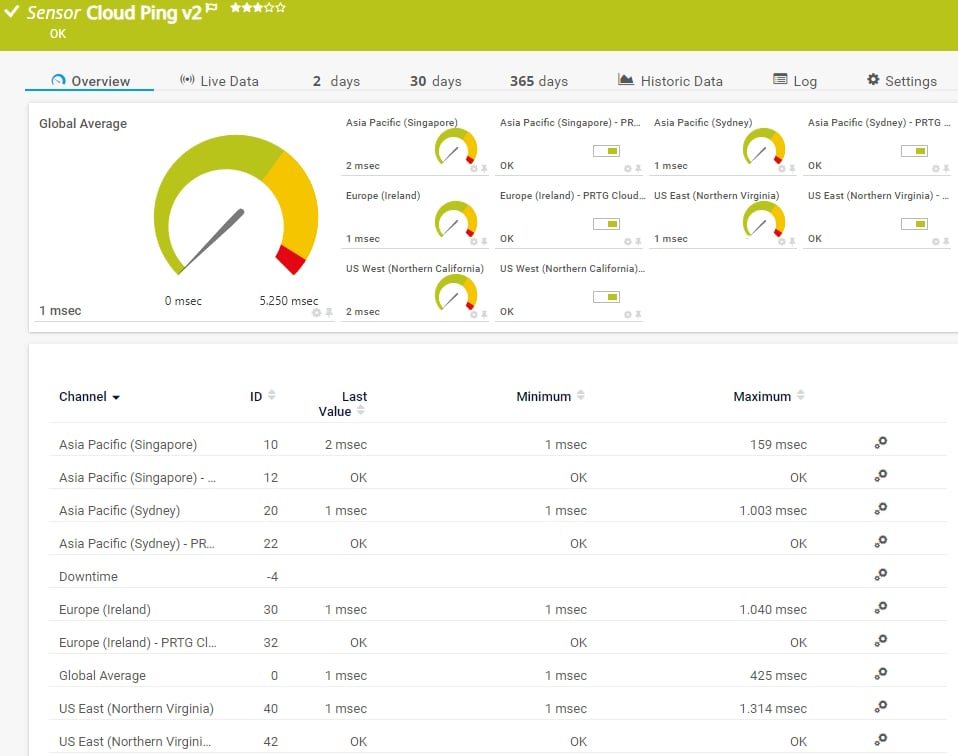
    The Cloud Ping v2 sensor monitors the Transmission Control Protocol (TCP) ping times to its parent device from different locations worldwide (Asia Pacific: Singapore,  Asia Pacific: Sydney, Europe: Ireland, US East: Northern Virginia,  US West: Northern California) via the PRTG Cloud. It can show the following:

    • Average global response time
    • Response time of the target server at the location
    • If the PRTG Cloud query was successful or not
    g_v2_sensor">Cloud Ping v2
    g_v2_sensor">Cloud Ping v2

    Microsoft Azure Virtual Machine

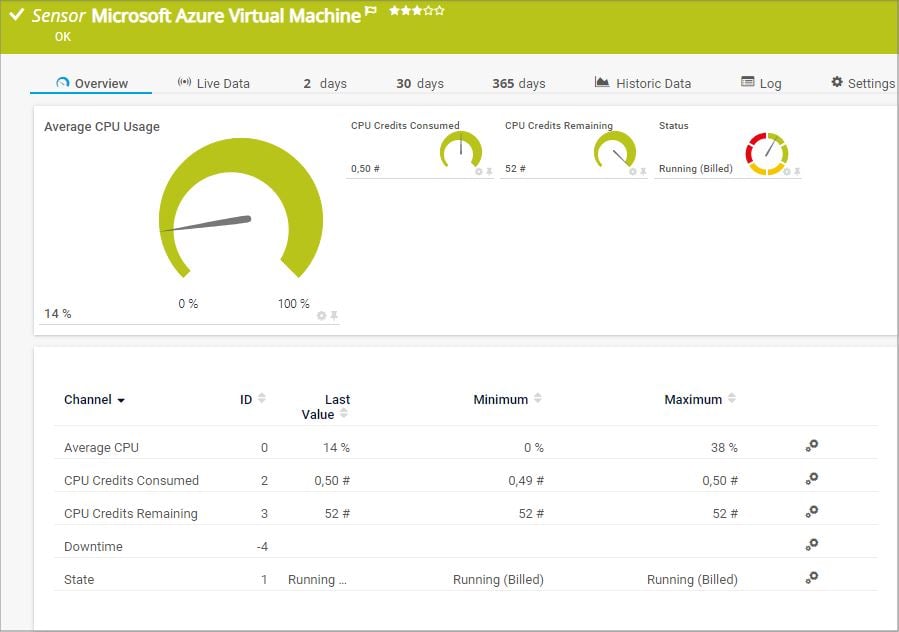
    The Microsoft Azure Virtual Machine sensor monitors the status of a virtual machine (VM) in a Microsoft Azure subscription. It can show the following:

    • Average CPU load
    • Number of consumed CPU credits
    • Number of remaining CPU credits
    • VM status
    Microsoft Azure Virtual Machine
    Microsoft Azure Virtual Machine

    Docker Container Status

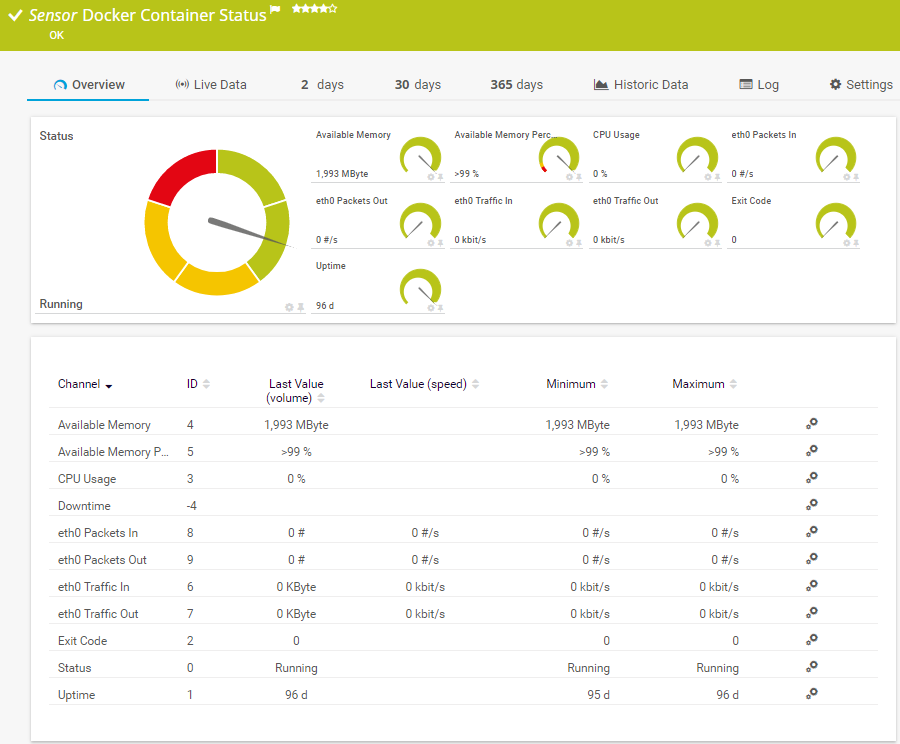
    The Docker Container Status sensor monitors the health and performance of a Docker container. It can show the following:

    • Available memory and CPU usage
    • Number of incoming and outgoing packets
    • Incoming and outgoing traffic
    • Overall status
    • Uptime
    Docker Container Status
    Docker Container Status

    REST Custom v2

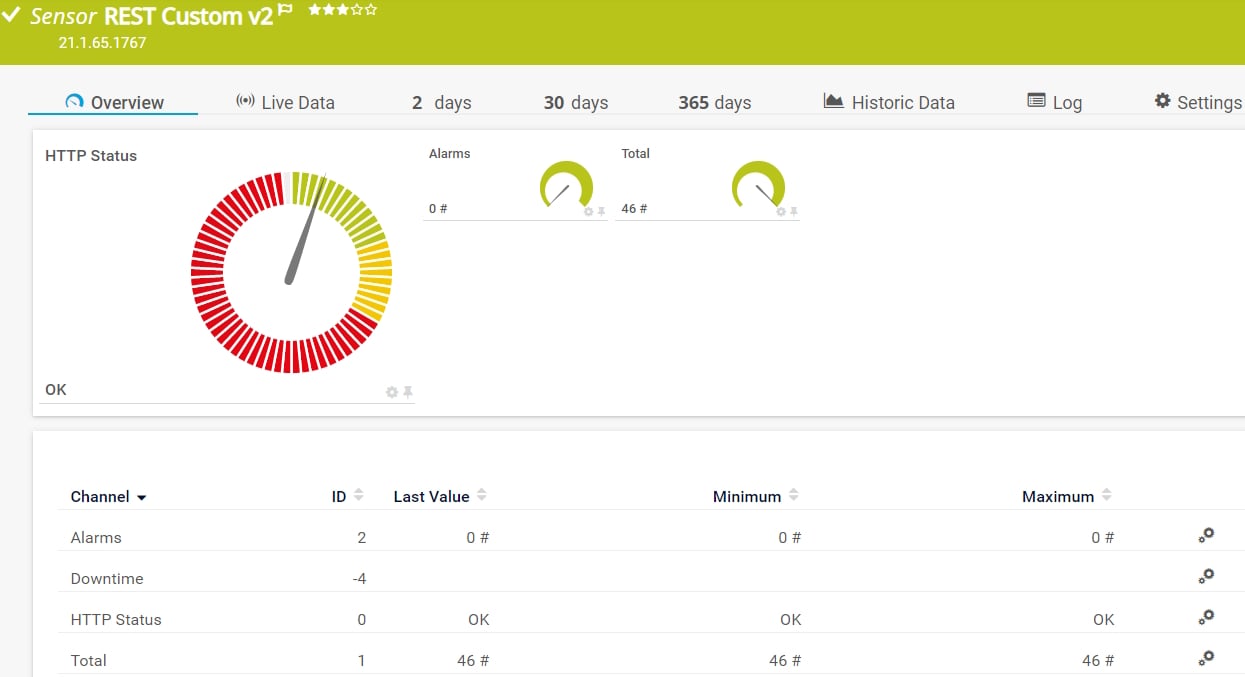
    The REST Custom v2 sensor queries a REST API endpoint and maps the JSON or XML result to sensor values. It can show the following:

    • HTTP status that the requested URL returns
    • Values that the REST API returns in several channels
    REST Custom v2
    REST Custom v2

    See the PRTG Manual for a list of all available sensor types.

    PRTG Is Compatible With All Major Vendors, Products, and Systems

    compatible with all major vendors, products, and systems

    PRTG makes cloud observability as easy as it gets

    Custom alerts and data visualization let you quickly identify and prevent performance issues.

    Free download
    PRODUCT OVERVIEW

    “With PRTG, we can comprehensively monitor our email services in the cloud, and ensure that – as the team in charge – we are immediately informed in the event of a malfunction and can quickly take actions to fix it. It wasn’t until we started using PRTG that we realized how error-ridden our Microsoft cloud service can be.”

    Monitoring expert
    Oettinger Davidoff

    “Part of our infrastructure runs with Azure. This information is then sent to PRTG via Powershell. Paessler is a great solution for us. We get alerts sent directly to our phones and if something goes wrong somewhere, we can immediately deal with it. It’s our lifeline. This is why Paessler gives us a sense of security no matter what the time of day.”

    Gert-Jan Hiddink, DevOps Engineer
    CowManager

    “As more and more companies start to integrate new systems, they aren’t going to use legacy networks. Instead, clients are implementing more cloud-based solutions with newer programming languages. Being able to closely monitor cloud-based solutions and customize sensors based on clients’ needs is extremely helpful in making sure the process runs and continues to function as smoothly as possible.”

    Edgard Concha, Director of Information Systems
    Resolvit

    Your cloud observability tool at a glance – even on the go

    PRTG is set up in a matter of minutes and can be used on a wide variety of mobile devices.

    device overview
    aws

    We are an AWS Technology Partner  

    Paessler is a certified partner in the Amazon Web Services ecosystem, which includes a growing community of software vendors who are building solutions on cloud computing.

    What does this mean for you?

    • Easy integration of AWS services and CloudWatch data with PRTG
    • State-of-the-art features for monitoring your cloud environment
    • Expert technical support around your AWS monitoring setup

    Find the root cause of the problem with our PRTG cloud observability solution

    Real-time notifications mean faster troubleshooting so that you can act before more serious issues occur.

    Free download
    PRODUCT OVERVIEW
    Paessler PRTG

    Paessler PRTG

    Network Monitoring Software – Version 26.1.116.1532 (February 9th, 2026)

    Hosting icon

    Hosting

    Download for Windows and cloud-based version PRTG Hosted Monitor available

    Languages icon

    Languages

    English, German, Spanish, French, Portuguese, Dutch, Russian, Japanese, and Simplified Chinese

    test

    Monitor everything

    Network devices, bandwidth, servers, applications, virtual environments, remote systems, IoT, and more

    test

    Pricing

    Choose the PRTG Network Monitor subscription that's best for you

    Discover more monitoring insights and stories

    Content illustration

    Powerful stories from the monitoring world

    • Observability vs Monitoring: Key Differences Every IT Team Should ...
    • The Future of Monitoring (2/2): The Rise of Observability
    • Network observability for enhanced network performance
    Support illustration

    Resources to master your monitoring challenges

    • PRTG Manual: Monitoring Databases - Paessler
    • Device and Sensor Setup
    • I run PRTG on VMware. How can I obtain best performance?
    Solution illustration

    Solutions for all your monitoring needs

    • Monitoring Cloud
    • Cloud Monitoring
    • AWS Monitoring

    Cloud Observability: FAQ


    What is a cloud observability tool?

    A cloud observability tool helps monitor and analyze the health and performance of cloud environments, including applications, infrastructure, and services. It collects and aggregates telemetry data such as metrics, logs, and traces to provide actionable insights. These tools are essential for identifying problems, optimizing performance, and improving user experience in dynamic cloud environments.

    How does PRTG work as a cloud observability tool?

    PRTG provides full-stack visibility by integrating metrics, log data and other observability data into a single platform. It supports multi-cloud environments, on-premises systems and hybrid infrastructures, making it a versatile solution. With customizable dashboards, automated alerts and comprehensive reporting, you can monitor cloud-native technologies, detect anomalies and optimize application performance.

    Does PRTG integrate with other monitoring tools?

    Yes, PRTG offers robust integrations with popular monitoring tools and platforms such as Prometheus, Grafana and OpenTelemetry. These integrations allow you to unify data sources, leverage specialized functionality, and build a cohesive observability ecosystem tailored to your needs.

    How does PRTG help DevOps teams?

    PRTG supports DevOps teams by streamlining incident response, improving root cause analysis, and enabling continuous application performance monitoring. It tracks data across cloud-native services such as Kubernetes and microservices, ensuring smooth collaboration between development and operations teams. With a focus on automation and proactive alerting, PRTG reduces downtime and accelerates workflows.

    Is PRTG suitable for monitoring serverless applications?

    Yes, PRTG is ideal for monitoring serverless environments. It provides real-time insight into serverless workloads, tracks API performance and aggregates telemetry data for comprehensive visibility. This ensures that you can detect and resolve performance issues efficiently, even in highly dynamic cloud services.

    What are some unique features of PRTG as a cloud observability platform?

    PRTG stands out as an observability platform because of its scalability and flexibility. It supports synthetic monitoring to test user workflows, incident management to handle disruptions, and profiling tools to analyze resource usage. These features make PRTG an excellent choice for various use cases across industries.

    How does PRTG compare to other vendors like Datadog or Dynatrace?

    While Datadog and Dynatrace are powerful tools, PRTG offers a simpler licensing model and easy setup without sacrificing functionality. It supports full stack monitoring and delivers actionable insights through customizable dashboards. In addition, its focus on flexibility and seamless integration with tools such as Splunk and open source platforms ensures that it fits well into existing workflows.

    What is a sensor in PRTG?

    In PRTG, “sensors” are the basic monitoring elements. One sensor usually monitors one measured value in your network, for example the traffic of a switch port, the CPU load of a server, or the free space on a disk drive. On average, you need about 5-10 sensors per device or one sensor per switch port.

    We asked: would you recommend PRTG? Over 95% of our customers say yes!

    Paessler conducted trials in over 600 IT departments worldwide to tune its network monitoring software closer to the needs of sysadmins. The result of the survey: over 95% of the participants would recommend PRTG – or already have.

    recommendation

    Still not convinced?

    Love

    More than 500,000 sysadmins love PRTG

    Paessler PRTG is used by companies of all sizes. Sysadmins love PRTG because it makes their job a whole lot easier.

    PRTG

    Monitor your entire IT infrastructure

    Bandwidth, servers, virtual environments, websites, VoIP services – PRTG keeps an eye on your entire network.

    test

    Try Paessler PRTG for free

    Everyone has different monitoring needs. That’s why we let you try PRTG for free.

    PRTG Logo

    Start monitoring your cloud environment with PRTG and see how it can make your network more reliable and your job easier.

    Free download
    PRODUCT OVERVIEW

    Products

    • Paessler PRTG
      Paessler PRTGMonitor your whole IT infrastructure
      • PRTG Network Monitor
      • PRTG Enterprise Monitor
      • PRTG Hosted Monitor
      • PRTG UVexplorer
      • PRTG extensions
        Extensions for Paessler PRTGExtend your monitoring to a new level
    • Icon Features
      FeaturesExplore all monitoring features

    Monitoring with PRTG

    • Network monitoring
    • Bandwidth monitoring
    • SNMP monitoring
    • Network mapping
    • Wi-Fi monitoring
    • Server monitoring
    • Network traffic analyzer
    • NetFlow monitoring
    • Syslog server

    Useful Links

    • PRTG Manual
    • Knowledge Base
    • Customer Success Stories
    • About Paessler
    • Subscribe to newsletter
    • PRTG Support
    • PRTG Consulting
    • PRTG Feedback & Roadmap

    Contact

    Paessler GmbH
    Thurn-und-Taxis-Str. 14, 
    90411 Nuremberg 
    Germany

    [email protected]

    +49 911 93775-0

    • Contact us
    ©2026 Paessler GmbHTerms & ConditionsPrivacy PolicyImprintReport VulnerabilityDownload & InstallSitemap
    Solutions Solutions Solutions