
Last reviewed: 10/2026


A sensor is one specific thing you monitor: a switch port, a server's CPU load, a website's response time. You buy a license for a set number of sensors, and that's what you pay, no matter how much traffic crosses your network or how many searches your team runs. Most devices need around 5 to 10 sensors to cover fully. A busier month doesn’t change your bill, but monitoring more devices or sites means sizing up your sensor count ahead of time. Add a new site or a busier month and your bill stays exactly where it was. The one thing that does change your license is choosing to monitor more, so a big rollout simply means sizing up your sensor count ahead of time, planned and predictable from the start.
Most infrastructure teams need exactly what PRTG delivers: clear answers to is it up, is it healthy, and will someone tell me before my users do. PRTG's auto-discovery scans your network, finds your devices, and applies the right sensors automatically, so you get threshold-based alerting and trend data without instrumenting a single application or writing a correlation rule. That's the job for most day-to-day infrastructure and network monitoring. For deep log search, security correlation, or business analytics on top of your infrastructure data, PRTG hands off to a dedicated tool for that: it sends its alerts straight to a SIEM or observability platform over syslog or SNMP trap, so the two work side by side.
No, and that's by design. PRTG's auto-discovery finds your devices and applies pre-configured sensors on its own, so a generalist IT admin can have real monitoring running the same day, without learning a query language first. Every alert, dashboard, and threshold gets set up by pointing and clicking through the web interface, not by writing search syntax. That covers the vast majority of infrastructure and network monitoring needs. If you want to go further, custom sensors, the API, and scripting are there for power users, but they're an option, not a requirement to get started.
FEATURE | PRTG PRTG | Splunk Enterprise Splunk Enterprise |
|---|---|---|
Cover network, server, application, and cloud monitoring in one license | PRTG Included in every license: network, server, application, virtualization, and cloud sensors together. | Splunk Enterprise Limited. Full scope requires Splunk Platform plus the separately licensed Splunk Observability Cloud. |
Analyze bandwidth and traffic flows without an add-on | PRTG NetFlow, jFlow, IPFIX, and packet sniffing sensors included in every license. | Splunk Enterprise Limited. Requires installing the NetFlow and SNMP Analytics for Splunk app from Splunkbase. |
Add monitoring locations without a bigger data contract | PRTG License cost is set by sensor count alone, independent of data volume or search activity. | Splunk Enterprise Limited. Cost is metered by GB/day ingested, SVC/vCPU workload units, or per-host entity pricing, all of which scale as sites are added. |
Get alerted before users notice something's down | PRTG Auto-discovery and pre-configured sensors mean alerting is live within minutes, no rule authoring needed. | Splunk Enterprise Available once data sources are onboarded and alerts are authored in SPL. |
Monitor OT and industrial devices alongside your IT network | PRTG Modbus TCP, OPC UA, and MQTT sensors included in every license, configured per device. | Splunk Enterprise Limited. OT visibility comes via third-party apps layered on top, such as Forescout eyeInspect or Cisco Cyber Vision. |
Give every site its own independently managed instance | PRTG Built around independent per-site instances from the start, giving each site full local control. | Splunk Enterprise Limited. Multi-site visibility typically centralizes into one shared Cloud or Enterprise deployment. |
Build executive-ready custom dashboards and reports | PRTG Limited. Advanced reporting and BI-tool integration require the separately licensed Data Exporter extension. | Splunk Enterprise Native, SPL-driven dashboarding and reporting. |
Search and correlate months of raw log data | PRTG Limited. Built for infrastructure and network monitoring; historical data exports to external tools for deeper log analysis. | Splunk Enterprise Core capability: index, search, and correlate machine data at scale via SPL. |
Every PRTG license includes every feature: alerting, network monitoring, and OT sensors are all built in from day one. You pay for the number of sensors you use, and that number determines your bill no matter how much data you generate or how often your team runs a search. According to our 2026 survey of 1,088 IT teams, midmarket customers rate PRTG's value for money above the survey-wide average (61.7% vs. 58.9%).
| License Name | License description | Price | License Details | Get started | Pricing Details | |
|---|---|---|---|---|---|---|
| PRTG 500 | $200 | per month paid annually | Buy nowBuy now | Enough to monitor multiple aspects of 50 devices | ||
| PRTG 1000 | $358 | per month paid annually | Buy nowBuy now | Enough to monitor multiple aspects of 100 devices | ||
| PRTG 2500 | $742 | per month paid annually | Buy nowBuy now | Enough to monitor multiple aspects of 250 devices | ||
| PRTG 5000 | $1,300 | per month paid annually | Buy nowBuy now | Enough to monitor multiple aspects of 500 devices | ||
| PRTG 10000 | $1,642 | per month paid annually | Buy nowBuy now | Enough to monitor multiple aspects of 1000 devices |
”GESAC increasingly focuses on innovation to improve the quality of services offered and the experience of passengers handled every day by Naples Airport. Thanks to PRTG, we finally have unified, automatic, and continuous monitoring of the airport network and can guarantee quick and timely interventions.”
Once auto-discovery finishes scanning your network, PRTG shows every device, sensor, and alert in one interface. You can view your setup as a device tree, a sunburst chart, or a custom map, and drill into any sensor for its live and historical data. It's all included in your existing PRTG license, ready to explore from day one.
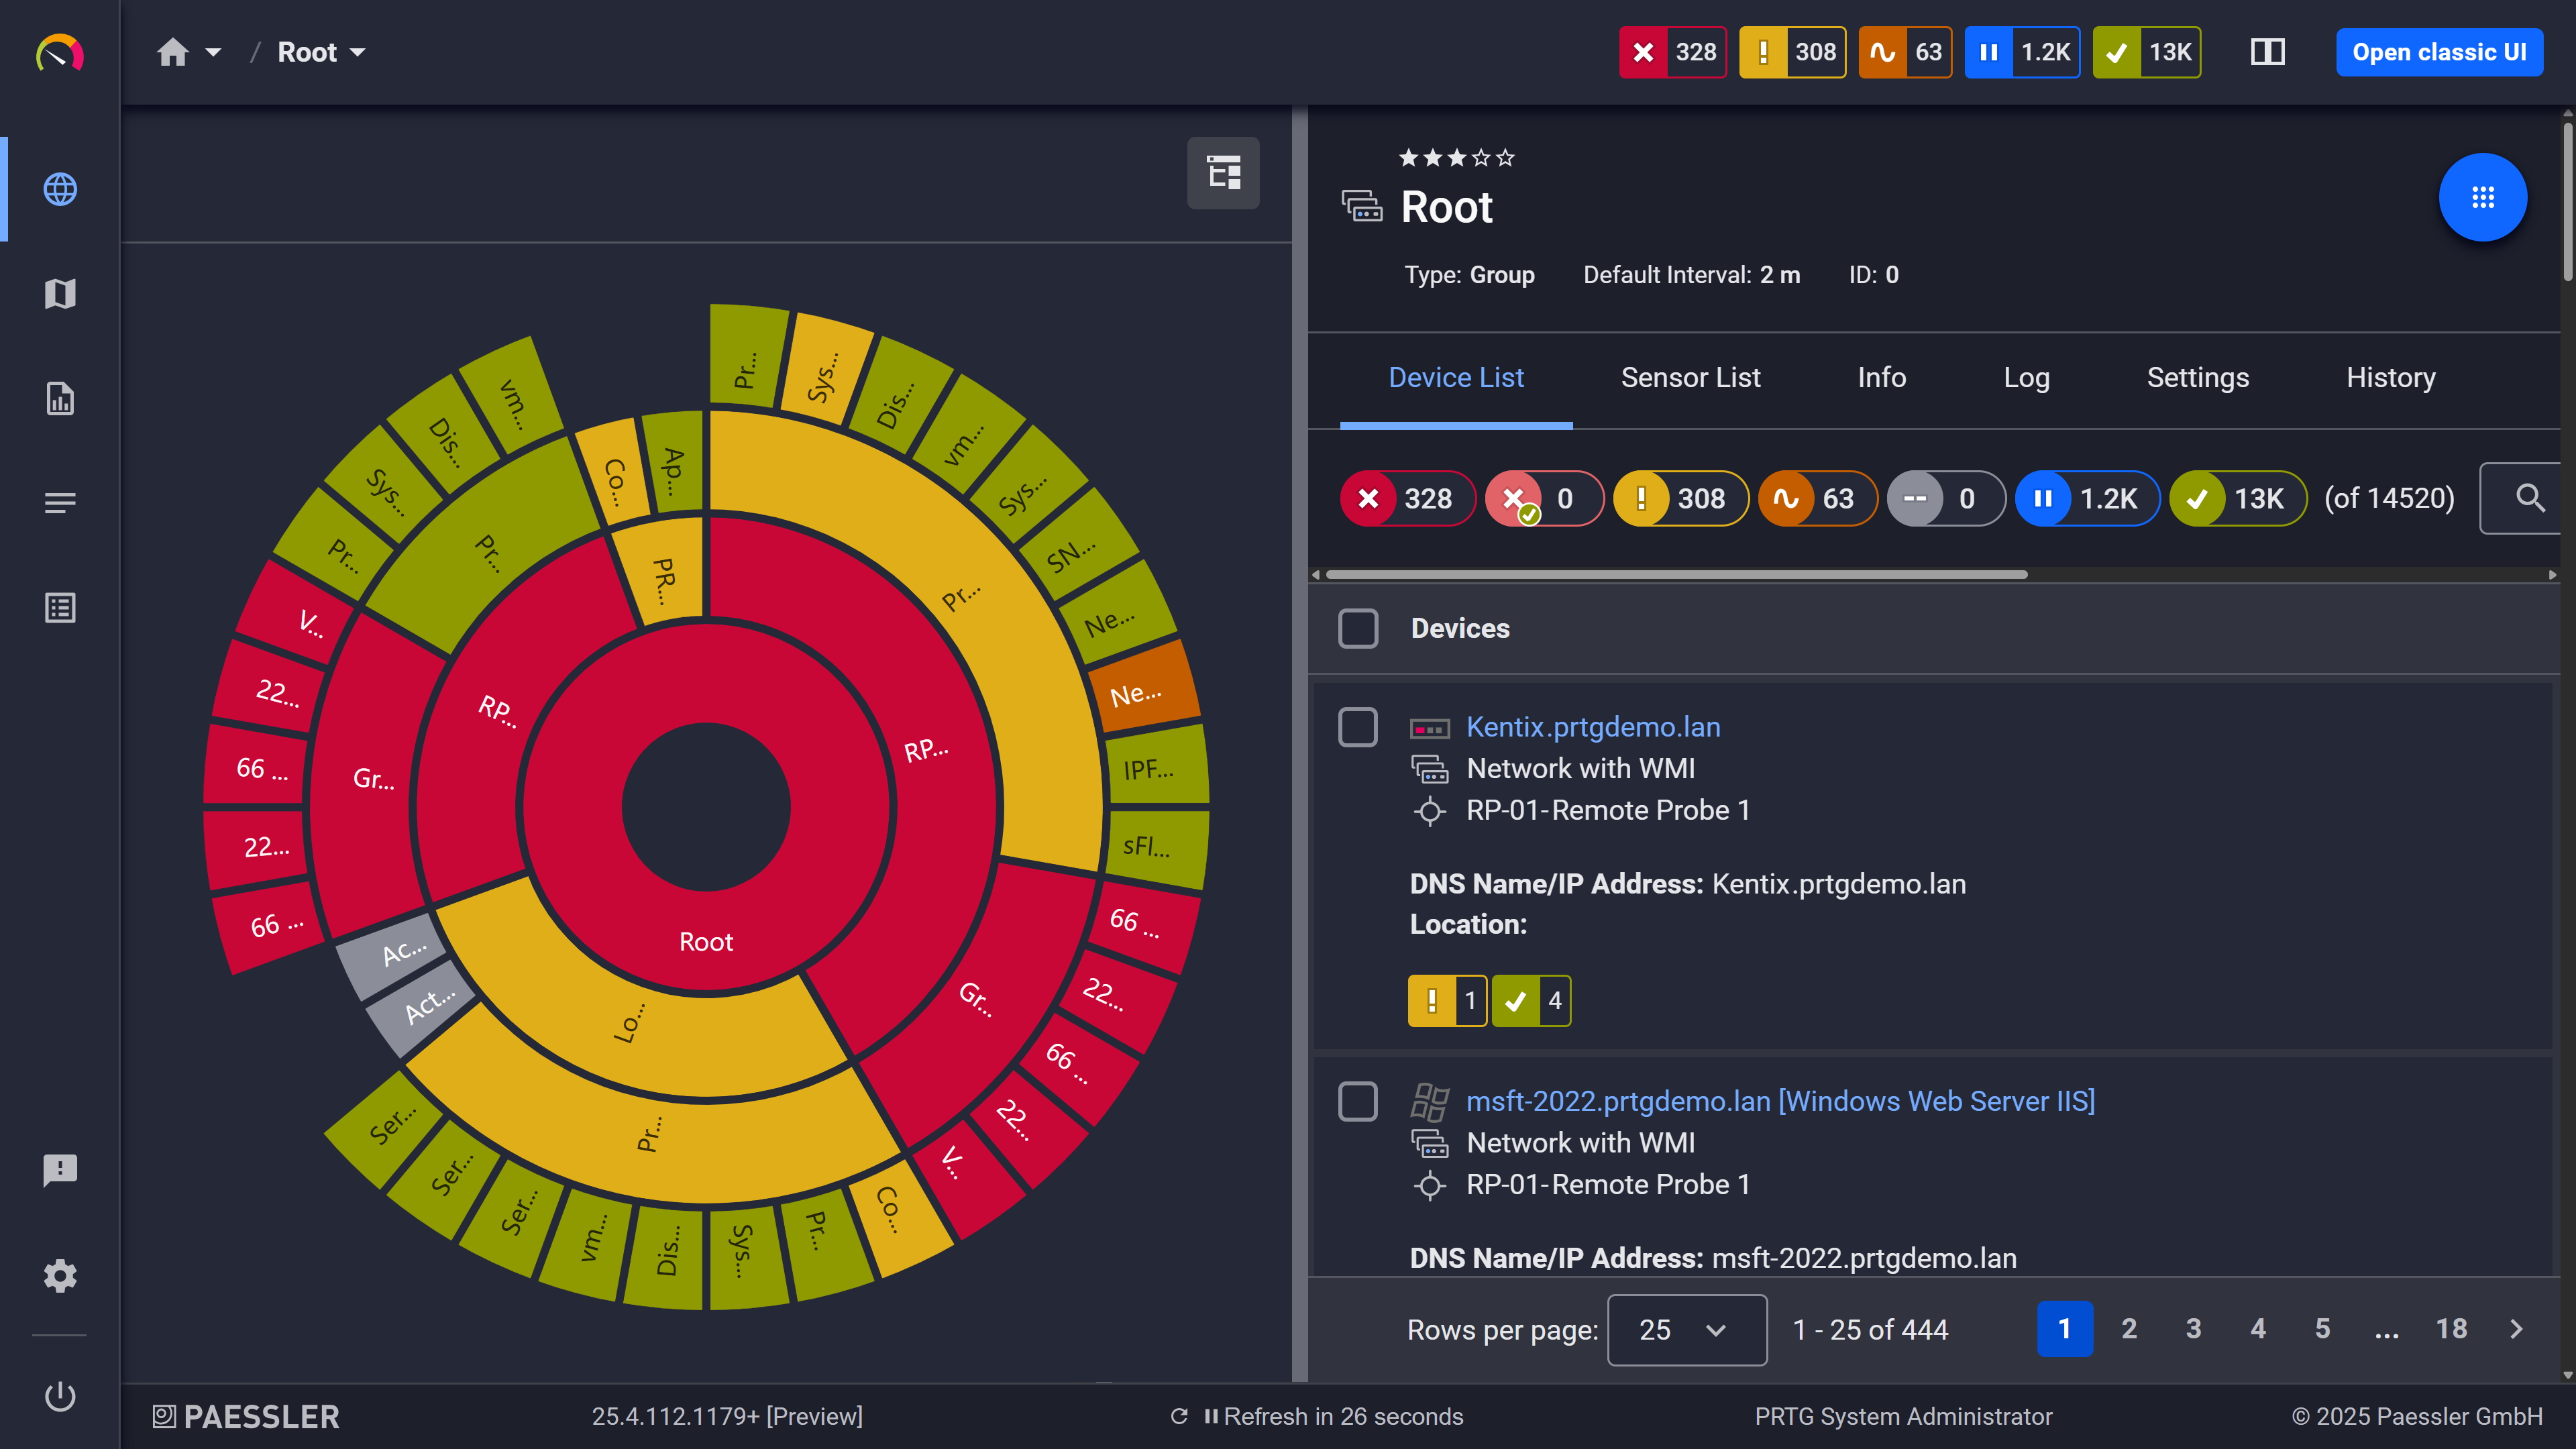
Custom dashboard: your easy-to-grasp overview built from your own sensors
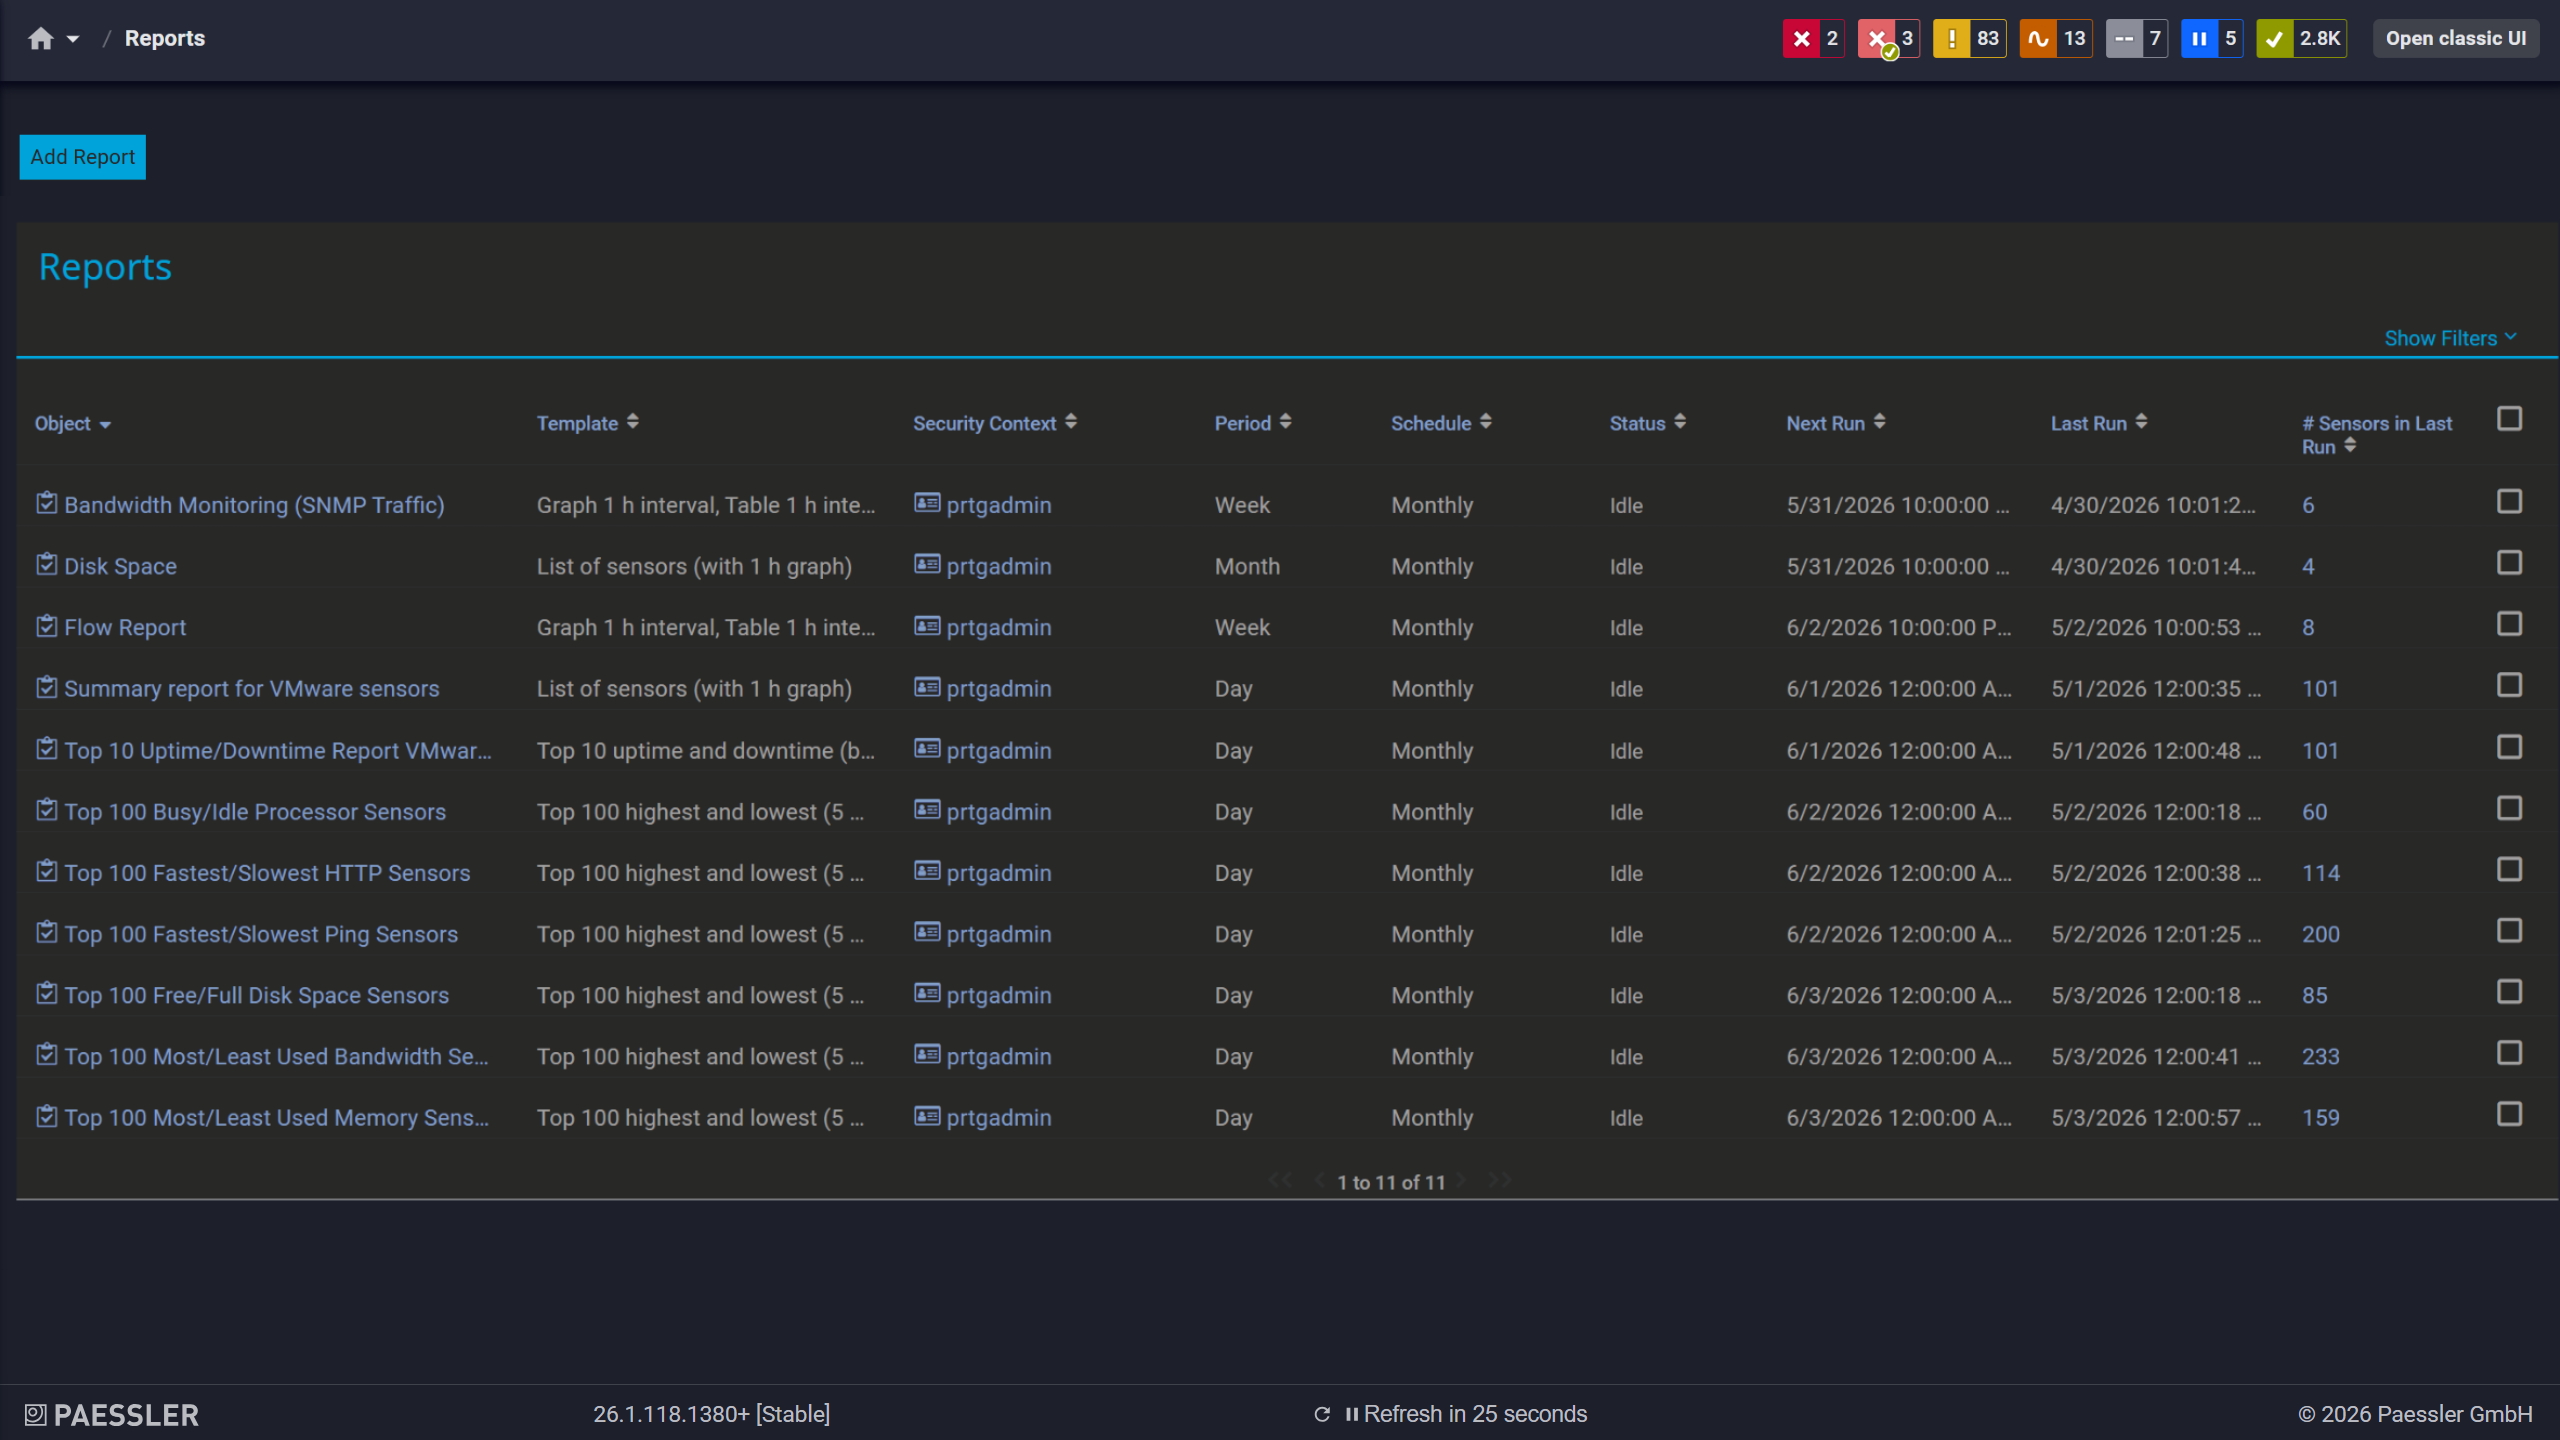
PRTG report screen: See all the reports generated and available to you in one easy to grasp overview
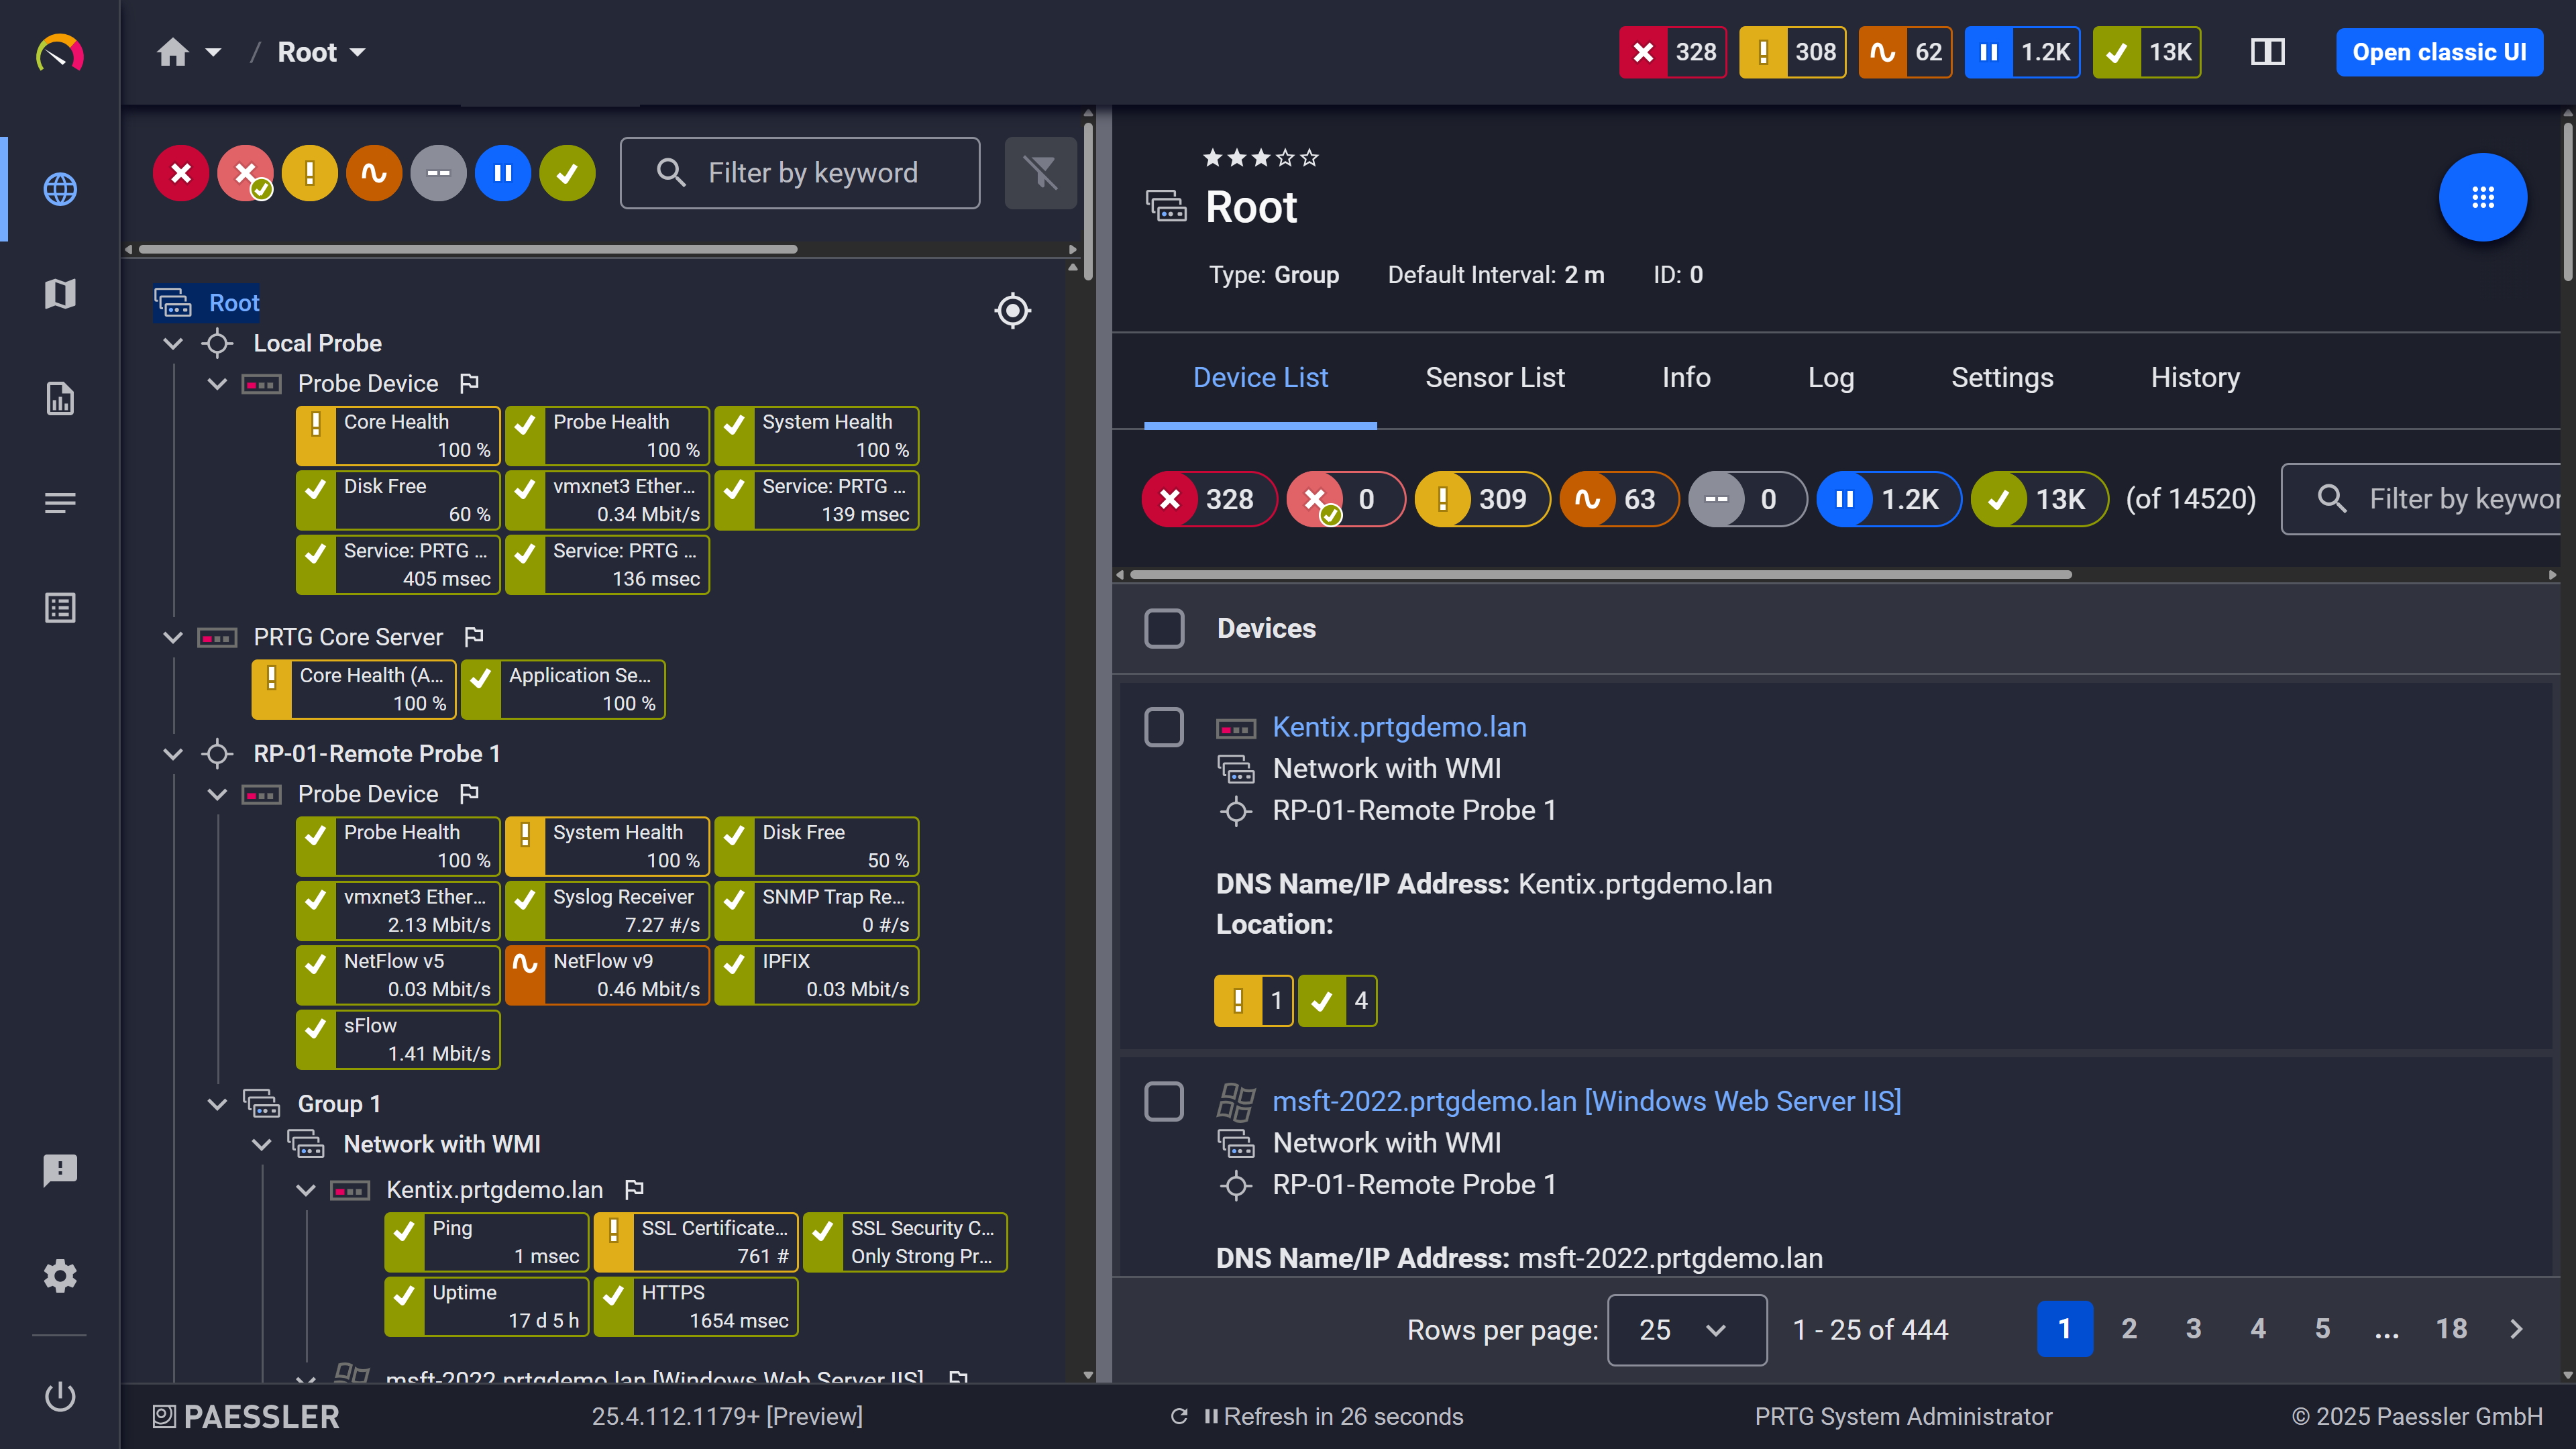
Device tree view: your full infrastructure, organized automatically after auto-discovery
Switching to PRTG follows one simple principle: your live network is the source. PRTG's auto-discovery reads what actually exists and rebuilds your monitoring directly from it. Four steps take you from your current setup to a running PRTG installation.
Have a list of hostnames or IP adresses of your current device. This can be from your own documentation, or get it from your current monitoring tool. In Splunk, run the | metadata type=hosts search in Search & Reporting, or check the Data Summary view's Hosts tab, to list every host that has sent data. This list is your completeness checklist for the entire switch. Then install PRTG alongside your current tool: both can run in parallel during the transition.
Enter your IP ranges and device credentials (e.g. for protocols like SNMP or WMI). PRTG's auto-discovery scans the network segments, identifies device types, and creates suitable sensors from built-in device templates. The rebuild comes from your live network, so it reflects what is really there. Compare the result against your device list from step 1 and add any sensors auto-discovery could not infer.
What you know maps cleanly to PRTG. Forwarders become remote probes, hosts become devices, saved searches and alerts become sensors and notification triggers, and dashboards become maps. Then recreate your alerting workflows with PRTG's notification templates and triggers.
Compare alerts side by side for a few weeks. Adjust thresholds and schedules, and build the maps and reports your team and leadership rely on. Decommission the old tool once PRTG has proven itself in daily operation.
A tool switch is the ideal moment to find out what your old setup wasn't watching. Paessler PRTG UVexplorer, a separate product whose data is surfaced inside PRTG, runs scheduled discoveries that build a multi-vendor topology map and asset inventory of what actually exists on your network. Compare that inventory against what Splunk Enterprise was monitoring, and close any blind spots before they carry over. After cutover, the same point-in-time snapshot confirms that your PRTG rebuild caught everything.
No, they're different products from different companies. Splunk Infrastructure Monitoring is the current name for the infrastructure and metrics monitoring capability inside Splunk Observability Cloud, built on the SignalFx platform Splunk acquired in 2019. PRTG is a standalone network and infrastructure monitoring tool from Paessler, licensed separately from any Splunk product. If you're evaluating PRTG as an alternative for Splunk, it replaces that specific monitoring job on its own, independent of the rest of the Splunk or Observability Cloud stack.
Splunk retired it. Splunk App for Infrastructure reached end of life on August 22, 2022, and Splunk stopped maintaining or developing it after that date. Many of those workflows now live in Splunk Infrastructure Monitoring inside Observability Cloud instead. PRTG's own sensor-based approach to infrastructure monitoring hasn't required a product change or a rename.
PRTG focuses on infrastructure health and performance: is a device up, is a service responding, is a threshold breached. Log ingestion and correlation are what a SIEM does. What PRTG can do is send alerts to your SIEM over syslog or an SNMP trap, so your security team gets infrastructure events inside the same correlation workflow they already use.
Those stay separate either way. Forescout eyeInspect and Cisco Cyber Vision are dedicated OT security platforms that sit alongside Splunk, not inside it, so switching your infrastructure monitoring leaves them fully in place. PRTG covers day-to-day OT device monitoring directly, with sensors for Modbus, OPC UA, and MQTT, once you configure them for your equipment. If you still need dedicated OT threat detection on top of that, it keeps running independently of whichever tool handles your general infrastructure monitoring.
Most of what switchers use Splunkbase apps for day to day, infrastructure and network visibility, is covered natively in PRTG through more than 250 pre-configured sensors, included out of the box. Splunkbase's own apps and add-ons are specific to the Splunk platform, so they don't carry over. For anything outside that built-in coverage, PRTG's custom sensors and API fill the gap.
Both, actually: PRTG works the same way regardless of which Splunk deployment you're using or leaving behind. It runs its own independent auto-discovery against your network, whether your current setup is Splunk Cloud Platform, self-managed Splunk Enterprise, or a mix of both.
Most teams see their network mapped and their first sensors reporting within minutes of installing PRTG, since auto-discovery finds your devices and applies pre-configured sensors automatically. Rebuilding the alerts, thresholds, and dashboards you rely on day to day takes longer, and exactly how long depends on how many you have to recreate. That part is manual work either way: Splunk's own SPL-based configuration doesn't transfer to any other tool, and PRTG rebuilds it fresh through auto-discovery instead. Our migration guide below walks through it step by step.
Yes, and it's one of the more common ways larger organizations run it. PRTG's architecture is built around independent instances from the start, so each site or business unit can run its own monitoring without depending on a central deployment. According to our 2026 survey of 1,088 IT teams, 55.3% of decentralized-enterprise respondents (1,000+ employees) monitor distributed sites or remote offices with PRTG, compared with 40.5% across the full survey. You can consolidate views across sites later without re-architecting anything.
We also compared PRTG with other monitoring tools:
SolarWinds is a module-based platform. But this also means that scaling your monitoring can quickly cost hundreds of thousands of dollars if you want to get a comprehensive software bundle.
The basic version of the open-source tool Nagios is free of charge. But most users spent many hours to set up and customize the tool. In case of problems, browsing through forums is often the only solution.
Zenoss as an open-source solution requires complex and technical expertise. PRTG delivers comprehensive full-stack observability with user-friendly interfaces and transparent pricing.
Auvik is a cloud-based monitoring & mapping tool that is relatively easy to install and configure. However, many monitoring features need to be purchased as extra modules, which can quickly drive up costs.
Start a 30-day trial with unlimited sensors, no commitment required.
Tell us your device count and we'll send you a quote.
See PRTG in a live demo with one of our monitoring experts.
