Today, the availability of business services goes hand in hand with the availability of IT services. For you as an MSP, customer satisfaction is crucial so there is no room for unavailable or non-functional business environments.
But how can you have everything up and running if you are responsible for managing a network with hundreds or thousands of different network hosts? In this how-to guide, we want to demonstrate a scenario for availability monitoring to show you how you can monitor the availability of IT services.
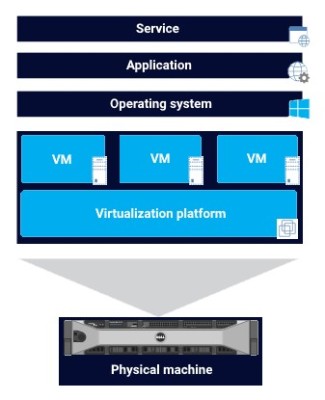
In the same way that an IP packet travels from the physical to the application layer, network monitoring needs to cover all aspects from the Ethernet connection to the residing service.
This means that if you want to monitor the availability of an IT service like a web shop that is hosted on a VMware ESXi host, for example, you also need to monitor all underlying layers including the physical machine (for example, a Dell server), the virtualization platform (here, VMware), the operating system (for example, Windows Server 2019), and the application (for example, a Microsoft IIS web server).
You also need to consider the way you define network availability. Different IT services are reachable via different protocols. For example, if you want to check if a web server is available, you send ICMP packets that you monitor with a Ping v2 sensor, but if you want to check if a website is reachable in a specific internet browser, you use an HTTP v2 sensor. Or, if you want to know if your antivirus software is up and running on your operating system, you can check the availability of the service with a WMI Service sensor or an SNMP Windows Service sensor.
Get full visibility with real-time dashboards, alerts, and customizable sensors
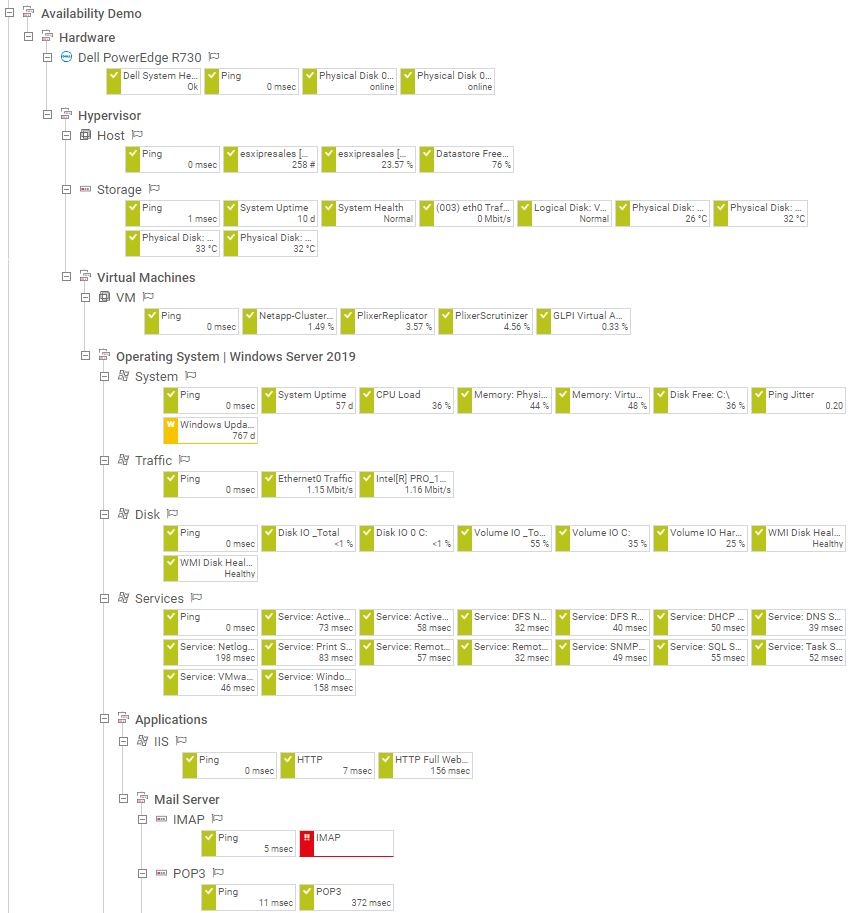
The first layer whose availability you need to monitor is the physical machine, for example, a Dell PowerEdge R730 server.
Set up a Ping v2 sensor to check if the target server is available.
Use a HTTP v2 sensor to check if the iRMC interface is available and accessible via an internet browser.
To check if the Dell hardware components function properly and if they are up and running, you can set up SNMP Dell PowerEdge System Health and SNMP Dell PowerEdge Physical Disk sensors, for example.
The physical server runs, for example, VMware 6.7, which hosts a number of virtual machines and datastores.
PRTG comes with different sensors to monitor your VMware infrastructure.
Use a VMware Host Hardware Status (SOAP) sensor to monitor the hardware status of the VMware host server, and a VMware Host Performance (SOAP) sensor to monitor, for example, CPU, network, and disk usage of the VMware host server.
Set up VMware Datastore (SOAP) sensors to monitor the disk usage of a VMware datastore, and VMware Virtual Machine (SOAP) sensors to monitor virtual machines on the VMware host server.
The virtual machine runs an operating system, for example, Windows Server 2019, that hosts important Windows services such as Windows protection, DNS, or DHCP.
To check if the Windows services are up and running, set up a WMI Service sensor or an SNMP Windows Service sensor.
Custom alerts and data visualization let you quickly identify and prevent all kinds of issues
With Windows Server 2019, you can monitor a Microsoft Internet Information Services (IIS)
web server and Windows services.
Typically, each application runs as a Windows service; therefore, you can monitor these services using a WMI Service sensor or an SNMP Windows Service sensor.
To check the status of the Microsoft IIS web server, or to monitor other applications that use IIS, such as Microsoft SharePoint or Microsoft Reporting Services (SSRS), set up a Windows IIS Application sensor.
For more information, see also How to set up web server monitoring in 3 steps.
The last layer whose availability you need to monitor is the service layer.
IT services come in various colors and shapes, so let’s have a look at two examples:
If you want to monitor the availability of a webpage, for example, an online shop or a company website, from different locations around the world, you can use a Cloud Ping v2 sensor to monitor TCP ping times, or a Cloud HTTP v2 sensor to monitor the loading time of a web server.
To monitor email availability, for example, the response time of a mail server, you can use an SMTP sensor, a POP3 sensor, or an IMAP. With the SMTP&POP3 Round Trip sensor, you can also monitor if emails are delivered and the time they take to be delivered.